|
|
Analogs
-
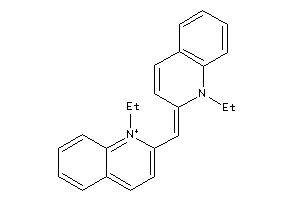
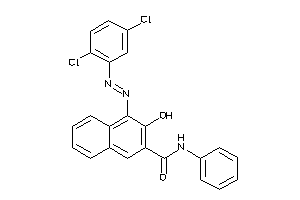
8619414
-
Draw
Identity
99%
90%
80%
70%
Vendors
And 18 More
Clustered Target Annotations
| Code |
Organism Class |
Affinity (nM) |
LE (kcal/mol/atom) |
Type |
|
NQO2-1-E |
Quinone Reductase 2 (cluster #1 Of 4), Eukaryotic |
Eukaryotes |
2700 |
0.31 |
Binding ≤ 10μM
|
Physical Representations
|
Type
pH range
|
xlogP
|
Des A‑Pol
Apolar desolvation
(kcal/mol)
|
Des Pol
Polar desolvation
(kcal/mol)
|
H Don
H-bond donors
|
H Acc
H-bond acceptors
|
Chg
Net charge
|
tPSA
(Ų)
|
MWT
Molecular weight
(g/mol)
|
RB
Rotatable bonds
|
DL |
|
Ref
Reference (pH 7)
|
1.82 |
14.05 |
-21.35 |
0 |
2 |
1 |
9 |
327.451 |
3 |
↓
|
|
|
|
Analogs
-
3877501
-

Draw
Identity
99%
90%
80%
70%
Vendors
Clustered Target Annotations
| Code |
Organism Class |
Affinity (nM) |
LE (kcal/mol/atom) |
Type |
|
NQO2-1-E |
Quinone Reductase 2 (cluster #1 Of 4), Eukaryotic |
Eukaryotes |
2700 |
0.31 |
Binding ≤ 10μM
|
Physical Representations
|
Type
pH range
|
xlogP
|
Des A‑Pol
Apolar desolvation
(kcal/mol)
|
Des Pol
Polar desolvation
(kcal/mol)
|
H Don
H-bond donors
|
H Acc
H-bond acceptors
|
Chg
Net charge
|
tPSA
(Ų)
|
MWT
Molecular weight
(g/mol)
|
RB
Rotatable bonds
|
DL |
|
Ref
Reference (pH 7)
|
1.82 |
2.86 |
-20.32 |
0 |
2 |
1 |
8 |
327.451 |
3 |
↓
|
|
|
|
Analogs
Draw
Identity
99%
90%
80%
70%
Vendors
Clustered Target Annotations
| Code |
Organism Class |
Affinity (nM) |
LE (kcal/mol/atom) |
Type |
|
NQO2-1-E |
Quinone Reductase 2 (cluster #1 Of 4), Eukaryotic |
Eukaryotes |
597 |
0.32 |
Binding ≤ 10μM
|
|
Z80193-2-O |
L1210 (Lymphocytic Leukemia Cells) (cluster #2 Of 12), Other |
Other |
180 |
0.35 |
Functional ≤ 10μM
|
Physical Representations
|
Type
pH range
|
xlogP
|
Des A‑Pol
Apolar desolvation
(kcal/mol)
|
Des Pol
Polar desolvation
(kcal/mol)
|
H Don
H-bond donors
|
H Acc
H-bond acceptors
|
Chg
Net charge
|
tPSA
(Ų)
|
MWT
Molecular weight
(g/mol)
|
RB
Rotatable bonds
|
DL |
|
Ref
Reference (pH 7)
|
3.68 |
8.14 |
-95.48 |
4 |
6 |
2 |
76 |
366.465 |
6 |
↓
|
|
Mid
Mid (pH 6-8)
|
3.68 |
8.59 |
-158.33 |
5 |
6 |
3 |
77 |
367.473 |
6 |
↓
|
|
|
|
Analogs
Draw
Identity
99%
90%
80%
70%
Vendors
Clustered Target Annotations
| Code |
Organism Class |
Affinity (nM) |
LE (kcal/mol/atom) |
Type |
|
NQO2-3-E |
Quinone Reductase 2 (cluster #3 Of 4), Eukaryotic |
Eukaryotes |
6500 |
0.20 |
Binding ≤ 10μM
|
Physical Representations
|
Type
pH range
|
xlogP
|
Des A‑Pol
Apolar desolvation
(kcal/mol)
|
Des Pol
Polar desolvation
(kcal/mol)
|
H Don
H-bond donors
|
H Acc
H-bond acceptors
|
Chg
Net charge
|
tPSA
(Ų)
|
MWT
Molecular weight
(g/mol)
|
RB
Rotatable bonds
|
DL |
|
Ref
Reference (pH 7)
|
6.75 |
16.63 |
-20.12 |
0 |
7 |
0 |
94 |
492.56 |
7 |
↓
|
|
|
|
Analogs
Draw
Identity
99%
90%
80%
70%
Vendors
Clustered Target Annotations
| Code |
Organism Class |
Affinity (nM) |
LE (kcal/mol/atom) |
Type |
|
NQO2-3-E |
Quinone Reductase 2 (cluster #3 Of 4), Eukaryotic |
Eukaryotes |
5300 |
0.22 |
Binding ≤ 10μM
|
Physical Representations
|
Type
pH range
|
xlogP
|
Des A‑Pol
Apolar desolvation
(kcal/mol)
|
Des Pol
Polar desolvation
(kcal/mol)
|
H Don
H-bond donors
|
H Acc
H-bond acceptors
|
Chg
Net charge
|
tPSA
(Ų)
|
MWT
Molecular weight
(g/mol)
|
RB
Rotatable bonds
|
DL |
|
Ref
Reference (pH 7)
|
7.50 |
16.5 |
-14.51 |
0 |
4 |
0 |
48 |
482.008 |
6 |
↓
|
|
|
|
Analogs
-
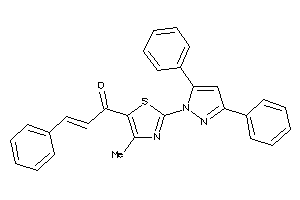
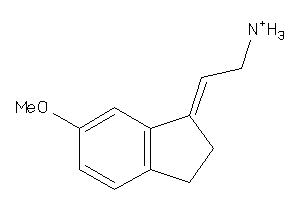
16957596
-
Draw
Identity
99%
90%
80%
70%
Vendors
Clustered Target Annotations
| Code |
Organism Class |
Affinity (nM) |
LE (kcal/mol/atom) |
Type |
|
NQO2-3-E |
Quinone Reductase 2 (cluster #3 Of 4), Eukaryotic |
Eukaryotes |
3200 |
0.23 |
Binding ≤ 10μM
|
Physical Representations
|
Type
pH range
|
xlogP
|
Des A‑Pol
Apolar desolvation
(kcal/mol)
|
Des Pol
Polar desolvation
(kcal/mol)
|
H Don
H-bond donors
|
H Acc
H-bond acceptors
|
Chg
Net charge
|
tPSA
(Ų)
|
MWT
Molecular weight
(g/mol)
|
RB
Rotatable bonds
|
DL |
|
Ref
Reference (pH 7)
|
7.27 |
16.66 |
-14.58 |
0 |
4 |
0 |
48 |
461.59 |
6 |
↓
|
|
|
|
Analogs
Draw
Identity
99%
90%
80%
70%
Vendors
Clustered Target Annotations
| Code |
Organism Class |
Affinity (nM) |
LE (kcal/mol/atom) |
Type |
|
NQO2-1-E |
Quinone Reductase 2 (cluster #1 Of 4), Eukaryotic |
Eukaryotes |
9600 |
0.23 |
Binding ≤ 10μM
|
Physical Representations
|
Type
pH range
|
xlogP
|
Des A‑Pol
Apolar desolvation
(kcal/mol)
|
Des Pol
Polar desolvation
(kcal/mol)
|
H Don
H-bond donors
|
H Acc
H-bond acceptors
|
Chg
Net charge
|
tPSA
(Ų)
|
MWT
Molecular weight
(g/mol)
|
RB
Rotatable bonds
|
DL |
|
Ref
Reference (pH 7)
|
7.56 |
16.08 |
-14.08 |
0 |
4 |
0 |
59 |
402.453 |
4 |
↓
|
|
Lo
Low (pH 4.5-6)
|
7.56 |
16.29 |
-38.1 |
1 |
4 |
1 |
60 |
403.461 |
4 |
↓
|
|
|
|
Analogs
-
4821853
-
Draw
Identity
99%
90%
80%
70%
Vendors
And 2 More
Clustered Target Annotations
| Code |
Organism Class |
Affinity (nM) |
LE (kcal/mol/atom) |
Type |
|
NQO2-1-E |
Quinone Reductase 2 (cluster #1 Of 4), Eukaryotic |
Eukaryotes |
1800 |
0.38 |
Binding ≤ 10μM
|
Physical Representations
|
Type
pH range
|
xlogP
|
Des A‑Pol
Apolar desolvation
(kcal/mol)
|
Des Pol
Polar desolvation
(kcal/mol)
|
H Don
H-bond donors
|
H Acc
H-bond acceptors
|
Chg
Net charge
|
tPSA
(Ų)
|
MWT
Molecular weight
(g/mol)
|
RB
Rotatable bonds
|
DL |
|
Ref
Reference (pH 7)
|
4.64 |
10.13 |
-11.09 |
1 |
2 |
0 |
29 |
270.335 |
2 |
↓
|
|
Mid
Mid (pH 6-8)
|
4.64 |
10.45 |
-31.31 |
2 |
2 |
1 |
30 |
271.343 |
2 |
↓
|
|
|
|
Analogs
Draw
Identity
99%
90%
80%
70%
Vendors
Clustered Target Annotations
| Code |
Organism Class |
Affinity (nM) |
LE (kcal/mol/atom) |
Type |
|
NQO2-1-E |
Quinone Reductase 2 (cluster #1 Of 4), Eukaryotic |
Eukaryotes |
2900 |
0.32 |
Binding ≤ 10μM
|
Physical Representations
|
Type
pH range
|
xlogP
|
Des A‑Pol
Apolar desolvation
(kcal/mol)
|
Des Pol
Polar desolvation
(kcal/mol)
|
H Don
H-bond donors
|
H Acc
H-bond acceptors
|
Chg
Net charge
|
tPSA
(Ų)
|
MWT
Molecular weight
(g/mol)
|
RB
Rotatable bonds
|
DL |
|
Ref
Reference (pH 7)
|
5.22 |
-0.12 |
-25.62 |
1 |
3 |
0 |
33 |
307.356 |
0 |
↓
|
|
|
|
Analogs
Draw
Identity
99%
90%
80%
70%
Vendors
Clustered Target Annotations
| Code |
Organism Class |
Affinity (nM) |
LE (kcal/mol/atom) |
Type |
|
NQO2-1-E |
Quinone Reductase 2 (cluster #1 Of 4), Eukaryotic |
Eukaryotes |
2100 |
0.33 |
Binding ≤ 10μM
|
Physical Representations
|
Type
pH range
|
xlogP
|
Des A‑Pol
Apolar desolvation
(kcal/mol)
|
Des Pol
Polar desolvation
(kcal/mol)
|
H Don
H-bond donors
|
H Acc
H-bond acceptors
|
Chg
Net charge
|
tPSA
(Ų)
|
MWT
Molecular weight
(g/mol)
|
RB
Rotatable bonds
|
DL |
|
Ref
Reference (pH 7)
|
5.58 |
11.04 |
-9.14 |
1 |
2 |
0 |
29 |
308.384 |
1 |
↓
|
|
Lo
Low (pH 4.5-6)
|
5.58 |
11.31 |
-28.77 |
2 |
2 |
1 |
30 |
309.392 |
1 |
↓
|
|
|
|
Analogs
Draw
Identity
99%
90%
80%
70%
Vendors
Clustered Target Annotations
| Code |
Organism Class |
Affinity (nM) |
LE (kcal/mol/atom) |
Type |
|
NQO2-2-E |
Quinone Reductase 2 (cluster #2 Of 4), Eukaryotic |
Eukaryotes |
5100 |
0.32 |
Binding ≤ 10μM
|
Physical Representations
|
Type
pH range
|
xlogP
|
Des A‑Pol
Apolar desolvation
(kcal/mol)
|
Des Pol
Polar desolvation
(kcal/mol)
|
H Don
H-bond donors
|
H Acc
H-bond acceptors
|
Chg
Net charge
|
tPSA
(Ų)
|
MWT
Molecular weight
(g/mol)
|
RB
Rotatable bonds
|
DL |
|
Ref
Reference (pH 7)
|
6.78 |
1.61 |
-7.56 |
0 |
0 |
0 |
0 |
310.421 |
1 |
↓
|
|
|
|
Analogs
-
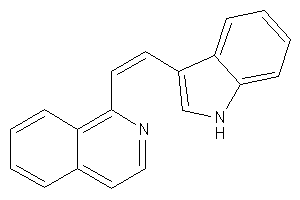
39295391
-
Draw
Identity
99%
90%
80%
70%
Vendors
Clustered Target Annotations
| Code |
Organism Class |
Affinity (nM) |
LE (kcal/mol/atom) |
Type |
|
NQO1-2-E |
Quinone Reductase 1) (cluster #2 Of 3), Eukaryotic |
Eukaryotes |
1100 |
0.31 |
Binding ≤ 10μM
|
|
NQO2-2-E |
Quinone Reductase 2 (cluster #2 Of 4), Eukaryotic |
Eukaryotes |
6000 |
0.27 |
Binding ≤ 10μM
|
Physical Representations
|
Type
pH range
|
xlogP
|
Des A‑Pol
Apolar desolvation
(kcal/mol)
|
Des Pol
Polar desolvation
(kcal/mol)
|
H Don
H-bond donors
|
H Acc
H-bond acceptors
|
Chg
Net charge
|
tPSA
(Ų)
|
MWT
Molecular weight
(g/mol)
|
RB
Rotatable bonds
|
DL |
|
Ref
Reference (pH 7)
|
8.28 |
1.14 |
-10.3 |
0 |
0 |
0 |
0 |
360.481 |
1 |
↓
|
|
|
|
Analogs
Draw
Identity
99%
90%
80%
70%
Vendors
Clustered Target Annotations
| Code |
Organism Class |
Affinity (nM) |
LE (kcal/mol/atom) |
Type |
|
NQO1-1-E |
Quinone Reductase 1) (cluster #1 Of 3), Eukaryotic |
Eukaryotes |
3000 |
0.34 |
Binding ≤ 10μM
|
|
NQO2-4-E |
Quinone Reductase 2 (cluster #4 Of 4), Eukaryotic |
Eukaryotes |
3900 |
0.33 |
Binding ≤ 10μM
|
Physical Representations
|
Type
pH range
|
xlogP
|
Des A‑Pol
Apolar desolvation
(kcal/mol)
|
Des Pol
Polar desolvation
(kcal/mol)
|
H Don
H-bond donors
|
H Acc
H-bond acceptors
|
Chg
Net charge
|
tPSA
(Ų)
|
MWT
Molecular weight
(g/mol)
|
RB
Rotatable bonds
|
DL |
|
Ref
Reference (pH 7)
|
6.31 |
5.86 |
-7.65 |
3 |
4 |
0 |
65 |
304.349 |
4 |
↓
|
|
Hi
High (pH 8-9.5)
|
6.31 |
6.64 |
-54.23 |
2 |
4 |
-1 |
68 |
303.341 |
4 |
↓
|
|
Hi
High (pH 8-9.5)
|
6.31 |
6.63 |
-48.16 |
2 |
4 |
-1 |
68 |
303.341 |
4 |
↓
|
|
|
|
Analogs
Draw
Identity
99%
90%
80%
70%
Vendors
Clustered Target Annotations
| Code |
Organism Class |
Affinity (nM) |
LE (kcal/mol/atom) |
Type |
|
NQO2-4-E |
Quinone Reductase 2 (cluster #4 Of 4), Eukaryotic |
Eukaryotes |
1800 |
0.31 |
Binding ≤ 10μM
|
Physical Representations
|
Type
pH range
|
xlogP
|
Des A‑Pol
Apolar desolvation
(kcal/mol)
|
Des Pol
Polar desolvation
(kcal/mol)
|
H Don
H-bond donors
|
H Acc
H-bond acceptors
|
Chg
Net charge
|
tPSA
(Ų)
|
MWT
Molecular weight
(g/mol)
|
RB
Rotatable bonds
|
DL |
|
Ref
Reference (pH 7)
|
4.42 |
-3.13 |
-43.08 |
5 |
7 |
1 |
121 |
345.386 |
5 |
↓
|
|
|
|
Analogs
Draw
Identity
99%
90%
80%
70%
Vendors
Clustered Target Annotations
| Code |
Organism Class |
Affinity (nM) |
LE (kcal/mol/atom) |
Type |
|
NQO2-4-E |
Quinone Reductase 2 (cluster #4 Of 4), Eukaryotic |
Eukaryotes |
1400 |
0.32 |
Binding ≤ 10μM
|
Physical Representations
|
Type
pH range
|
xlogP
|
Des A‑Pol
Apolar desolvation
(kcal/mol)
|
Des Pol
Polar desolvation
(kcal/mol)
|
H Don
H-bond donors
|
H Acc
H-bond acceptors
|
Chg
Net charge
|
tPSA
(Ų)
|
MWT
Molecular weight
(g/mol)
|
RB
Rotatable bonds
|
DL |
|
Ref
Reference (pH 7)
|
4.78 |
-2.46 |
-41.57 |
5 |
5 |
1 |
96 |
343.41 |
5 |
↓
|
|
|
|
Analogs
-
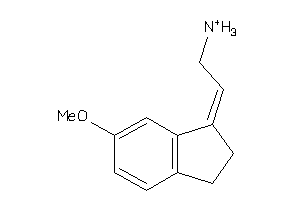
33839075
-
Draw
Identity
99%
90%
80%
70%
Vendors
Clustered Target Annotations
| Code |
Organism Class |
Affinity (nM) |
LE (kcal/mol/atom) |
Type |
|
NQO2-1-E |
Quinone Reductase 2 (cluster #1 Of 4), Eukaryotic |
Eukaryotes |
6000 |
0.24 |
Binding ≤ 10μM
|
Physical Representations
|
Type
pH range
|
xlogP
|
Des A‑Pol
Apolar desolvation
(kcal/mol)
|
Des Pol
Polar desolvation
(kcal/mol)
|
H Don
H-bond donors
|
H Acc
H-bond acceptors
|
Chg
Net charge
|
tPSA
(Ų)
|
MWT
Molecular weight
(g/mol)
|
RB
Rotatable bonds
|
DL |
|
Ref
Reference (pH 7)
|
4.78 |
-3.01 |
-46.22 |
6 |
7 |
1 |
125 |
410.457 |
5 |
↓
|
|
|
|
Analogs
Draw
Identity
99%
90%
80%
70%
Vendors
Clustered Target Annotations
| Code |
Organism Class |
Affinity (nM) |
LE (kcal/mol/atom) |
Type |
|
NQO2-3-E |
Quinone Reductase 2 (cluster #3 Of 4), Eukaryotic |
Eukaryotes |
3800 |
0.21 |
Binding ≤ 10μM
|
Physical Representations
|
Type
pH range
|
xlogP
|
Des A‑Pol
Apolar desolvation
(kcal/mol)
|
Des Pol
Polar desolvation
(kcal/mol)
|
H Don
H-bond donors
|
H Acc
H-bond acceptors
|
Chg
Net charge
|
tPSA
(Ų)
|
MWT
Molecular weight
(g/mol)
|
RB
Rotatable bonds
|
DL |
|
Ref
Reference (pH 7)
|
7.88 |
2.77 |
-16.91 |
0 |
4 |
0 |
47 |
487.628 |
7 |
↓
|
|
|
|
Analogs
Draw
Identity
99%
90%
80%
70%
Vendors
Clustered Target Annotations
| Code |
Organism Class |
Affinity (nM) |
LE (kcal/mol/atom) |
Type |
|
NQO2-3-E |
Quinone Reductase 2 (cluster #3 Of 4), Eukaryotic |
Eukaryotes |
6000 |
0.20 |
Binding ≤ 10μM
|
Physical Representations
|
Type
pH range
|
xlogP
|
Des A‑Pol
Apolar desolvation
(kcal/mol)
|
Des Pol
Polar desolvation
(kcal/mol)
|
H Don
H-bond donors
|
H Acc
H-bond acceptors
|
Chg
Net charge
|
tPSA
(Ų)
|
MWT
Molecular weight
(g/mol)
|
RB
Rotatable bonds
|
DL |
|
Ref
Reference (pH 7)
|
6.78 |
16.66 |
-18.68 |
0 |
7 |
0 |
94 |
492.56 |
7 |
↓
|
|
|
|
Analogs
-
16957625
-
Draw
Identity
99%
90%
80%
70%
Vendors
Clustered Target Annotations
| Code |
Organism Class |
Affinity (nM) |
LE (kcal/mol/atom) |
Type |
|
NQO2-3-E |
Quinone Reductase 2 (cluster #3 Of 4), Eukaryotic |
Eukaryotes |
5800 |
0.22 |
Binding ≤ 10μM
|
Physical Representations
|
Type
pH range
|
xlogP
|
Des A‑Pol
Apolar desolvation
(kcal/mol)
|
Des Pol
Polar desolvation
(kcal/mol)
|
H Don
H-bond donors
|
H Acc
H-bond acceptors
|
Chg
Net charge
|
tPSA
(Ų)
|
MWT
Molecular weight
(g/mol)
|
RB
Rotatable bonds
|
DL |
|
Ref
Reference (pH 7)
|
6.82 |
15.99 |
-14.57 |
0 |
4 |
0 |
48 |
447.563 |
6 |
↓
|
|
|
|
Analogs
Draw
Identity
99%
90%
80%
70%
Vendors
Clustered Target Annotations
| Code |
Organism Class |
Affinity (nM) |
LE (kcal/mol/atom) |
Type |
|
NQO2-1-E |
Quinone Reductase 2 (cluster #1 Of 4), Eukaryotic |
Eukaryotes |
2100 |
0.53 |
Binding ≤ 10μM
|
Physical Representations
|
Type
pH range
|
xlogP
|
Des A‑Pol
Apolar desolvation
(kcal/mol)
|
Des Pol
Polar desolvation
(kcal/mol)
|
H Don
H-bond donors
|
H Acc
H-bond acceptors
|
Chg
Net charge
|
tPSA
(Ų)
|
MWT
Molecular weight
(g/mol)
|
RB
Rotatable bonds
|
DL |
|
Ref
Reference (pH 7)
|
-1.78 |
0.89 |
-28.21 |
1 |
2 |
1 |
20 |
197.261 |
0 |
↓
|
|
|
|
Analogs
Draw
Identity
99%
90%
80%
70%
Vendors
Clustered Target Annotations
| Code |
Organism Class |
Affinity (nM) |
LE (kcal/mol/atom) |
Type |
|
NQO2-1-E |
Quinone Reductase 2 (cluster #1 Of 4), Eukaryotic |
Eukaryotes |
5500 |
0.39 |
Binding ≤ 10μM
|
Physical Representations
|
Type
pH range
|
xlogP
|
Des A‑Pol
Apolar desolvation
(kcal/mol)
|
Des Pol
Polar desolvation
(kcal/mol)
|
H Don
H-bond donors
|
H Acc
H-bond acceptors
|
Chg
Net charge
|
tPSA
(Ų)
|
MWT
Molecular weight
(g/mol)
|
RB
Rotatable bonds
|
DL |
|
Ref
Reference (pH 7)
|
-0.62 |
10.39 |
-32.07 |
0 |
2 |
1 |
9 |
247.321 |
0 |
↓
|
|
|
|
Analogs
-
34589727
-
-
34596901
-
Draw
Identity
99%
90%
80%
70%
Vendors
Clustered Target Annotations
| Code |
Organism Class |
Affinity (nM) |
LE (kcal/mol/atom) |
Type |
|
MTR1A-1-E |
Melatonin Receptor 1A (cluster #1 Of 2), Eukaryotic |
Eukaryotes |
0 |
0.00 |
Binding ≤ 10μM
|
|
MTR1B-1-E |
Melatonin Receptor 1B (cluster #1 Of 2), Eukaryotic |
Eukaryotes |
0 |
0.00 |
Binding ≤ 10μM
|
|
NQO2-3-E |
Quinone Reductase 2 (cluster #3 Of 4), Eukaryotic |
Eukaryotes |
1190 |
0.46 |
Binding ≤ 10μM
|
Physical Representations
|
Type
pH range
|
xlogP
|
Des A‑Pol
Apolar desolvation
(kcal/mol)
|
Des Pol
Polar desolvation
(kcal/mol)
|
H Don
H-bond donors
|
H Acc
H-bond acceptors
|
Chg
Net charge
|
tPSA
(Ų)
|
MWT
Molecular weight
(g/mol)
|
RB
Rotatable bonds
|
DL |
|
Ref
Reference (pH 7)
|
2.45 |
6.09 |
-9.42 |
1 |
3 |
0 |
38 |
245.322 |
4 |
↓
|
|
|
|
Analogs
-
34589727
-
-
34596901
-
Draw
Identity
99%
90%
80%
70%
Vendors
Clustered Target Annotations
| Code |
Organism Class |
Affinity (nM) |
LE (kcal/mol/atom) |
Type |
|
MTR1A-1-E |
Melatonin Receptor 1A (cluster #1 Of 2), Eukaryotic |
Eukaryotes |
1 |
0.70 |
Binding ≤ 10μM
|
|
MTR1B-1-E |
Melatonin Receptor 1B (cluster #1 Of 2), Eukaryotic |
Eukaryotes |
1 |
0.70 |
Binding ≤ 10μM
|
|
NQO2-3-E |
Quinone Reductase 2 (cluster #3 Of 4), Eukaryotic |
Eukaryotes |
467 |
0.49 |
Binding ≤ 10μM
|
Physical Representations
|
Type
pH range
|
xlogP
|
Des A‑Pol
Apolar desolvation
(kcal/mol)
|
Des Pol
Polar desolvation
(kcal/mol)
|
H Don
H-bond donors
|
H Acc
H-bond acceptors
|
Chg
Net charge
|
tPSA
(Ų)
|
MWT
Molecular weight
(g/mol)
|
RB
Rotatable bonds
|
DL |
|
Ref
Reference (pH 7)
|
2.45 |
5.86 |
-12.4 |
1 |
3 |
0 |
38 |
245.322 |
4 |
↓
|
|
|
|
Analogs
-
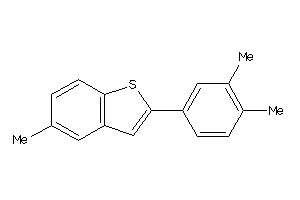
12353732
-
Draw
Identity
99%
90%
80%
70%
Vendors
And 55 More
Clustered Target Annotations
| Code |
Organism Class |
Affinity (nM) |
LE (kcal/mol/atom) |
Type |
|
AHR-1-E |
Aryl Hydrocarbon Receptor (cluster #1 Of 1), Eukaryotic |
Eukaryotes |
169 |
0.56 |
Binding ≤ 10μM
|
|
CAH1-4-E |
Carbonic Anhydrase I (cluster #4 Of 12), Eukaryotic |
Eukaryotes |
2210 |
0.47 |
Binding ≤ 10μM
|
|
CAH12-2-E |
Carbonic Anhydrase XII (cluster #2 Of 9), Eukaryotic |
Eukaryotes |
950 |
0.50 |
Binding ≤ 10μM
|
|
CAH13-7-E |
Carbonic Anhydrase XIII (cluster #7 Of 7), Eukaryotic |
Eukaryotes |
4090 |
0.44 |
Binding ≤ 10μM
|
|
CAH14-4-E |
Carbonic Anhydrase XIV (cluster #4 Of 8), Eukaryotic |
Eukaryotes |
830 |
0.50 |
Binding ≤ 10μM
|
|
CAH15-1-E |
Carbonic Anhydrase 15 (cluster #1 Of 6), Eukaryotic |
Eukaryotes |
9360 |
0.41 |
Binding ≤ 10μM
|
|
CAH2-5-E |
Carbonic Anhydrase II (cluster #5 Of 15), Eukaryotic |
Eukaryotes |
2770 |
0.46 |
Binding ≤ 10μM
|
|
CAH3-1-E |
Carbonic Anhydrase III (cluster #1 Of 6), Eukaryotic |
Eukaryotes |
9090 |
0.42 |
Binding ≤ 10μM
|
|
CAH4-3-E |
Carbonic Anhydrase IV (cluster #3 Of 16), Eukaryotic |
Eukaryotes |
4470 |
0.44 |
Binding ≤ 10μM
|
|
CAH5A-8-E |
Carbonic Anhydrase VA (cluster #8 Of 10), Eukaryotic |
Eukaryotes |
4750 |
0.44 |
Binding ≤ 10μM
|
|
CAH5B-4-E |
Carbonic Anhydrase VB (cluster #4 Of 9), Eukaryotic |
Eukaryotes |
4640 |
0.44 |
Binding ≤ 10μM
|
|
CAH6-2-E |
Carbonic Anhydrase VI (cluster #2 Of 8), Eukaryotic |
Eukaryotes |
8070 |
0.42 |
Binding ≤ 10μM
|
|
CAH7-2-E |
Carbonic Anhydrase VII (cluster #2 Of 8), Eukaryotic |
Eukaryotes |
4350 |
0.44 |
Binding ≤ 10μM
|
|
CAH9-3-E |
Carbonic Anhydrase IX (cluster #3 Of 11), Eukaryotic |
Eukaryotes |
810 |
0.50 |
Binding ≤ 10μM
|
|
ESR1-5-E |
Estrogen Receptor Alpha (cluster #5 Of 5), Eukaryotic |
Eukaryotes |
785 |
0.50 |
Binding ≤ 10μM
|
|
NQO2-4-E |
Quinone Reductase 2 (cluster #4 Of 4), Eukaryotic |
Eukaryotes |
960 |
0.50 |
Binding ≤ 10μM
|
|
PGH1-2-E |
Cyclooxygenase-1 (cluster #2 Of 6), Eukaryotic |
Eukaryotes |
830 |
0.50 |
Binding ≤ 10μM
|
|
PGH2-1-E |
Cyclooxygenase-2 (cluster #1 Of 8), Eukaryotic |
Eukaryotes |
3490 |
0.45 |
Binding ≤ 10μM
|
|
PGH1-1-E |
Cyclooxygenase-1 (cluster #1 Of 2), Eukaryotic |
Eukaryotes |
2840 |
0.46 |
Functional ≤ 10μM
|
|
Z102306-4-O |
Aorta (cluster #4 Of 6), Other |
Other |
6918 |
0.42 |
Functional ≤ 10μM
|
|
Z80156-1-O |
HL-60 (Promyeloblast Leukemia Cells) (cluster #1 Of 12), Other |
Other |
5000 |
0.44 |
Functional ≤ 10μM
|
|
Z80224-12-O |
MCF7 (Breast Carcinoma Cells) (cluster #12 Of 14), Other |
Other |
0 |
0.00 |
Functional ≤ 10μM |
|
Z80418-1-O |
RAW264.7 (Monocytic-macrophage Leukemia Cells) (cluster #1 Of 9), Other |
Other |
4000 |
0.44 |
Functional ≤ 10μM
|
|
Z80492-2-O |
SK-N-SH (Neuroblastoma Cells) (cluster #2 Of 2), Other |
Other |
0 |
0.00 |
Functional ≤ 10μM |
|
Z80682-7-O |
A549 (Lung Carcinoma Cells) (cluster #7 Of 11), Other |
Other |
0 |
0.00 |
Functional ≤ 10μM |
|
Z81247-2-O |
HeLa (Cervical Adenocarcinoma Cells) (cluster #2 Of 9), Other |
Other |
0 |
0.00 |
Functional ≤ 10μM |
Physical Representations
|
Type
pH range
|
xlogP
|
Des A‑Pol
Apolar desolvation
(kcal/mol)
|
Des Pol
Polar desolvation
(kcal/mol)
|
H Don
H-bond donors
|
H Acc
H-bond acceptors
|
Chg
Net charge
|
tPSA
(Ų)
|
MWT
Molecular weight
(g/mol)
|
RB
Rotatable bonds
|
DL |
|
Ref
Reference (pH 7)
|
2.99 |
0.79 |
-8.46 |
3 |
3 |
0 |
61 |
228.247 |
2 |
↓
|
|
|
|
Analogs
Draw
Identity
99%
90%
80%
70%
Vendors
And 1 More
Physical Representations
|
Type
pH range
|
xlogP
|
Des A‑Pol
Apolar desolvation
(kcal/mol)
|
Des Pol
Polar desolvation
(kcal/mol)
|
H Don
H-bond donors
|
H Acc
H-bond acceptors
|
Chg
Net charge
|
tPSA
(Ų)
|
MWT
Molecular weight
(g/mol)
|
RB
Rotatable bonds
|
DL |
|
Ref
Reference (pH 7)
|
2.65 |
4.5 |
-11.69 |
2 |
4 |
0 |
54 |
358.179 |
4 |
↓
|
|
|
|
Analogs
Draw
Identity
99%
90%
80%
70%
Vendors
Clustered Target Annotations
| Code |
Organism Class |
Affinity (nM) |
LE (kcal/mol/atom) |
Type |
|
MTR1A-1-E |
Melatonin Receptor 1A (cluster #1 Of 2), Eukaryotic |
Eukaryotes |
15 |
0.55 |
Binding ≤ 10μM
|
|
MTR1B-1-E |
Melatonin Receptor 1B (cluster #1 Of 2), Eukaryotic |
Eukaryotes |
5 |
0.58 |
Binding ≤ 10μM
|
|
NQO2-1-E |
Quinone Reductase 2 (cluster #1 Of 4), Eukaryotic |
Eukaryotes |
1000 |
0.42 |
Binding ≤ 10μM
|
Physical Representations
|
Type
pH range
|
xlogP
|
Des A‑Pol
Apolar desolvation
(kcal/mol)
|
Des Pol
Polar desolvation
(kcal/mol)
|
H Don
H-bond donors
|
H Acc
H-bond acceptors
|
Chg
Net charge
|
tPSA
(Ų)
|
MWT
Molecular weight
(g/mol)
|
RB
Rotatable bonds
|
DL |
|
Ref
Reference (pH 7)
|
1.33 |
-0.61 |
-19.46 |
2 |
7 |
0 |
99 |
277.28 |
5 |
↓
|
|
|
|
Analogs
Draw
Identity
99%
90%
80%
70%
Vendors
Clustered Target Annotations
| Code |
Organism Class |
Affinity (nM) |
LE (kcal/mol/atom) |
Type |
|
MTR1A-1-E |
Melatonin Receptor 1A (cluster #1 Of 2), Eukaryotic |
Eukaryotes |
0 |
0.00 |
Binding ≤ 10μM
|
|
MTR1B-1-E |
Melatonin Receptor 1B (cluster #1 Of 2), Eukaryotic |
Eukaryotes |
0 |
0.00 |
Binding ≤ 10μM
|
|
NQO2-1-E |
Quinone Reductase 2 (cluster #1 Of 4), Eukaryotic |
Eukaryotes |
0 |
0.00 |
Binding ≤ 10μM
|
Physical Representations
|
Type
pH range
|
xlogP
|
Des A‑Pol
Apolar desolvation
(kcal/mol)
|
Des Pol
Polar desolvation
(kcal/mol)
|
H Don
H-bond donors
|
H Acc
H-bond acceptors
|
Chg
Net charge
|
tPSA
(Ų)
|
MWT
Molecular weight
(g/mol)
|
RB
Rotatable bonds
|
DL |
|
Ref
Reference (pH 7)
|
2.72 |
6.17 |
-12.25 |
1 |
4 |
0 |
43 |
372.206 |
4 |
↓
|
|
|
|
Analogs
Draw
Identity
99%
90%
80%
70%
Vendors
Clustered Target Annotations
| Code |
Organism Class |
Affinity (nM) |
LE (kcal/mol/atom) |
Type |
|
MTR1A-1-E |
Melatonin Receptor 1A (cluster #1 Of 2), Eukaryotic |
Eukaryotes |
1060 |
0.42 |
Binding ≤ 10μM
|
|
MTR1B-1-E |
Melatonin Receptor 1B (cluster #1 Of 2), Eukaryotic |
Eukaryotes |
820 |
0.43 |
Binding ≤ 10μM
|
|
NQO2-1-E |
Quinone Reductase 2 (cluster #1 Of 4), Eukaryotic |
Eukaryotes |
1 |
0.63 |
Binding ≤ 10μM
|
Physical Representations
|
Type
pH range
|
xlogP
|
Des A‑Pol
Apolar desolvation
(kcal/mol)
|
Des Pol
Polar desolvation
(kcal/mol)
|
H Don
H-bond donors
|
H Acc
H-bond acceptors
|
Chg
Net charge
|
tPSA
(Ų)
|
MWT
Molecular weight
(g/mol)
|
RB
Rotatable bonds
|
DL |
|
Ref
Reference (pH 7)
|
1.33 |
4.32 |
-22.55 |
2 |
7 |
0 |
100 |
277.28 |
5 |
↓
|
|
|
|
Analogs
Draw
Identity
99%
90%
80%
70%
Vendors
Clustered Target Annotations
| Code |
Organism Class |
Affinity (nM) |
LE (kcal/mol/atom) |
Type |
|
MT3-1-E |
Metallothionein-3 (cluster #1 Of 1), Eukaryotic |
Eukaryotes |
0 |
0.00 |
Binding ≤ 10μM
|
|
MTR1A-1-E |
Melatonin Receptor 1A (cluster #1 Of 2), Eukaryotic |
Eukaryotes |
1880 |
0.36 |
Binding ≤ 10μM
|
|
MTR1B-1-E |
Melatonin Receptor 1B (cluster #1 Of 2), Eukaryotic |
Eukaryotes |
39 |
0.47 |
Binding ≤ 10μM
|
|
NQO2-1-E |
Quinone Reductase 2 (cluster #1 Of 4), Eukaryotic |
Eukaryotes |
0 |
0.00 |
Binding ≤ 10μM
|
Physical Representations
|
Type
pH range
|
xlogP
|
Des A‑Pol
Apolar desolvation
(kcal/mol)
|
Des Pol
Polar desolvation
(kcal/mol)
|
H Don
H-bond donors
|
H Acc
H-bond acceptors
|
Chg
Net charge
|
tPSA
(Ų)
|
MWT
Molecular weight
(g/mol)
|
RB
Rotatable bonds
|
DL |
|
Ref
Reference (pH 7)
|
2.61 |
6.91 |
-19.59 |
1 |
7 |
0 |
89 |
417.203 |
5 |
↓
|
|
|
|
Analogs
-
3825731
-
-
34629121
-
Draw
Identity
99%
90%
80%
70%
Vendors
Physical Representations
|
Type
pH range
|
xlogP
|
Des A‑Pol
Apolar desolvation
(kcal/mol)
|
Des Pol
Polar desolvation
(kcal/mol)
|
H Don
H-bond donors
|
H Acc
H-bond acceptors
|
Chg
Net charge
|
tPSA
(Ų)
|
MWT
Molecular weight
(g/mol)
|
RB
Rotatable bonds
|
DL |
|
Ref
Reference (pH 7)
|
2.46 |
-0.59 |
-9.43 |
1 |
3 |
0 |
38 |
247.338 |
5 |
↓
|
|
|
|
Analogs
-
34629121
-
-
21169
-
Draw
Identity
99%
90%
80%
70%
Vendors
Clustered Target Annotations
| Code |
Organism Class |
Affinity (nM) |
LE (kcal/mol/atom) |
Type |
|
MTR1A-1-E |
Melatonin Receptor 1A (cluster #1 Of 2), Eukaryotic |
Eukaryotes |
0 |
0.00 |
Binding ≤ 10μM
|
|
MTR1B-1-E |
Melatonin Receptor 1B (cluster #1 Of 2), Eukaryotic |
Eukaryotes |
0 |
0.00 |
Binding ≤ 10μM
|
|
NQO2-4-E |
Quinone Reductase 2 (cluster #4 Of 4), Eukaryotic |
Eukaryotes |
686 |
0.48 |
Binding ≤ 10μM
|
|
NQO2-4-E |
Quinone Reductase 2 (cluster #4 Of 4), Eukaryotic |
Eukaryotes |
3570 |
0.42 |
Binding ≤ 10μM
|
Physical Representations
|
Type
pH range
|
xlogP
|
Des A‑Pol
Apolar desolvation
(kcal/mol)
|
Des Pol
Polar desolvation
(kcal/mol)
|
H Don
H-bond donors
|
H Acc
H-bond acceptors
|
Chg
Net charge
|
tPSA
(Ų)
|
MWT
Molecular weight
(g/mol)
|
RB
Rotatable bonds
|
DL |
|
Ref
Reference (pH 7)
|
2.46 |
-0.59 |
-9.41 |
1 |
3 |
0 |
38 |
247.338 |
5 |
↓
|
|
|
|
Analogs
Draw
Identity
99%
90%
80%
70%
Vendors
Clustered Target Annotations
| Code |
Organism Class |
Affinity (nM) |
LE (kcal/mol/atom) |
Type |
|
NQO2-1-E |
Quinone Reductase 2 (cluster #1 Of 4), Eukaryotic |
Eukaryotes |
148 |
0.37 |
Binding ≤ 10μM
|
|
Z80193-2-O |
L1210 (Lymphocytic Leukemia Cells) (cluster #2 Of 12), Other |
Other |
31 |
0.40 |
Functional ≤ 10μM
|
|
Z80928-1-O |
HCT-116 (Colon Carcinoma Cells) (cluster #1 Of 2), Other |
Other |
4 |
0.45 |
ADME/T ≤ 10μM |
Physical Representations
|
Type
pH range
|
xlogP
|
Des A‑Pol
Apolar desolvation
(kcal/mol)
|
Des Pol
Polar desolvation
(kcal/mol)
|
H Don
H-bond donors
|
H Acc
H-bond acceptors
|
Chg
Net charge
|
tPSA
(Ų)
|
MWT
Molecular weight
(g/mol)
|
RB
Rotatable bonds
|
DL |
|
Ref
Reference (pH 7)
|
3.41 |
7.33 |
-99.64 |
4 |
6 |
2 |
76 |
352.438 |
5 |
↓
|
|
Hi
High (pH 8-9.5)
|
2.38 |
6.03 |
-16.02 |
2 |
6 |
0 |
70 |
350.422 |
6 |
↓
|
|
Hi
High (pH 8-9.5)
|
3.41 |
5.12 |
-38.36 |
3 |
6 |
1 |
75 |
351.43 |
5 |
↓
|
|
|
|
Analogs
Draw
Identity
99%
90%
80%
70%
Vendors
And 24 More
Clustered Target Annotations
| Code |
Organism Class |
Affinity (nM) |
LE (kcal/mol/atom) |
Type |
|
NQO2-4-E |
Quinone Reductase 2 (cluster #4 Of 4), Eukaryotic |
Eukaryotes |
3300 |
0.64 |
Binding ≤ 10μM
|
Physical Representations
|
Type
pH range
|
xlogP
|
Des A‑Pol
Apolar desolvation
(kcal/mol)
|
Des Pol
Polar desolvation
(kcal/mol)
|
H Don
H-bond donors
|
H Acc
H-bond acceptors
|
Chg
Net charge
|
tPSA
(Ų)
|
MWT
Molecular weight
(g/mol)
|
RB
Rotatable bonds
|
DL |
|
Ref
Reference (pH 7)
|
2.35 |
1.13 |
-6.21 |
2 |
2 |
0 |
40 |
160.172 |
0 |
↓
|
|
Hi
High (pH 8-9.5)
|
1.64 |
4.03 |
-47.06 |
0 |
2 |
-1 |
40 |
159.164 |
0 |
↓
|
|
Hi
High (pH 8-9.5)
|
2.08 |
4.04 |
-48.4 |
0 |
2 |
-1 |
40 |
159.164 |
0 |
↓
|
|
|
|
Analogs
Draw
Identity
99%
90%
80%
70%
Vendors
And 5 More
Clustered Target Annotations
| Code |
Organism Class |
Affinity (nM) |
LE (kcal/mol/atom) |
Type |
|
NQO2-1-E |
Quinone Reductase 2 (cluster #1 Of 4), Eukaryotic |
Eukaryotes |
42 |
0.57 |
Binding ≤ 10μM
|
Physical Representations
|
Type
pH range
|
xlogP
|
Des A‑Pol
Apolar desolvation
(kcal/mol)
|
Des Pol
Polar desolvation
(kcal/mol)
|
H Don
H-bond donors
|
H Acc
H-bond acceptors
|
Chg
Net charge
|
tPSA
(Ų)
|
MWT
Molecular weight
(g/mol)
|
RB
Rotatable bonds
|
DL |
|
Ref
Reference (pH 7)
|
1.35 |
5.01 |
-17.29 |
2 |
6 |
0 |
91 |
247.254 |
4 |
↓
|
|
|
|
Analogs
Draw
Identity
99%
90%
80%
70%
Vendors
Clustered Target Annotations
| Code |
Organism Class |
Affinity (nM) |
LE (kcal/mol/atom) |
Type |
|
NQO2-2-E |
Quinone Reductase 2 (cluster #2 Of 4), Eukaryotic |
Eukaryotes |
28 |
0.62 |
Binding ≤ 10μM
|
Physical Representations
|
Type
pH range
|
xlogP
|
Des A‑Pol
Apolar desolvation
(kcal/mol)
|
Des Pol
Polar desolvation
(kcal/mol)
|
H Don
H-bond donors
|
H Acc
H-bond acceptors
|
Chg
Net charge
|
tPSA
(Ų)
|
MWT
Molecular weight
(g/mol)
|
RB
Rotatable bonds
|
DL |
|
Ref
Reference (pH 7)
|
2.44 |
4.27 |
-13.58 |
1 |
3 |
0 |
46 |
249.335 |
4 |
↓
|
|
|
|
Analogs
Draw
Identity
99%
90%
80%
70%
Vendors
And 57 More
Clustered Target Annotations
| Code |
Organism Class |
Affinity (nM) |
LE (kcal/mol/atom) |
Type |
|
MT3-1-E |
Metallothionein-3 (cluster #1 Of 1), Eukaryotic |
Eukaryotes |
65 |
0.59 |
Binding ≤ 10μM
|
|
MTR1A-1-E |
Melatonin Receptor 1A (cluster #1 Of 2), Eukaryotic |
Eukaryotes |
1 |
0.74 |
Binding ≤ 10μM
|
|
MTR1B-1-E |
Melatonin Receptor 1B (cluster #1 Of 2), Eukaryotic |
Eukaryotes |
1 |
0.74 |
Binding ≤ 10μM
|
|
MTR1C-1-E |
Melatonin Receptor 1C (cluster #1 Of 1), Eukaryotic |
Eukaryotes |
1 |
0.74 |
Binding ≤ 10μM
|
|
NQO2-1-E |
Quinone Reductase 2 (cluster #1 Of 4), Eukaryotic |
Eukaryotes |
65 |
0.59 |
Binding ≤ 10μM
|
|
MTR1A-1-E |
Melatonin Receptor 1A (cluster #1 Of 1), Eukaryotic |
Eukaryotes |
23 |
0.63 |
Functional ≤ 10μM
|
|
MTR1B-1-E |
Melatonin Receptor 1B (cluster #1 Of 1), Eukaryotic |
Eukaryotes |
23 |
0.63 |
Functional ≤ 10μM
|
|
MTR1C-1-E |
Melatonin Receptor 1C (cluster #1 Of 1), Eukaryotic |
Eukaryotes |
23 |
0.63 |
Functional ≤ 10μM
|
|
Z50597-1-O |
Rattus Norvegicus (cluster #1 Of 12), Other |
Other |
0 |
0.00 |
Functional ≤ 10μM
|
|
Z81346-1-O |
Melanophores (Melanophore Cells) (cluster #1 Of 1), Other |
Other |
0 |
0.00 |
Functional ≤ 10μM
|
Physical Representations
|
Type
pH range
|
xlogP
|
Des A‑Pol
Apolar desolvation
(kcal/mol)
|
Des Pol
Polar desolvation
(kcal/mol)
|
H Don
H-bond donors
|
H Acc
H-bond acceptors
|
Chg
Net charge
|
tPSA
(Ų)
|
MWT
Molecular weight
(g/mol)
|
RB
Rotatable bonds
|
DL |
|
Ref
Reference (pH 7)
|
1.45 |
3.62 |
-14.46 |
2 |
4 |
0 |
54 |
232.283 |
4 |
↓
|
|
Lo
Low (pH 4.5-6)
|
1.11 |
3.72 |
-41.44 |
2 |
4 |
1 |
52 |
233.291 |
4 |
↓
|
|
Lo
Low (pH 4.5-6)
|
1.11 |
3.72 |
-41.43 |
2 |
4 |
1 |
52 |
233.291 |
4 |
↓
|
|
|
|
Analogs
Draw
Identity
99%
90%
80%
70%
Vendors
Clustered Target Annotations
| Code |
Organism Class |
Affinity (nM) |
LE (kcal/mol/atom) |
Type |
|
NQO2-3-E |
Quinone Reductase 2 (cluster #3 Of 4), Eukaryotic |
Eukaryotes |
4900 |
0.21 |
Binding ≤ 10μM
|
Physical Representations
|
Type
pH range
|
xlogP
|
Des A‑Pol
Apolar desolvation
(kcal/mol)
|
Des Pol
Polar desolvation
(kcal/mol)
|
H Don
H-bond donors
|
H Acc
H-bond acceptors
|
Chg
Net charge
|
tPSA
(Ų)
|
MWT
Molecular weight
(g/mol)
|
RB
Rotatable bonds
|
DL |
|
Ref
Reference (pH 7)
|
8.10 |
16.96 |
-14.87 |
0 |
4 |
0 |
48 |
516.453 |
6 |
↓
|
|
|
|
Analogs
Draw
Identity
99%
90%
80%
70%
Notice: Undefined index: field_name in /domains/zinc12/htdocs/lib/zinc/reporter/ZincAuxiliaryInfoReports.php on line 244
Notice: Undefined index: synonym in /domains/zinc12/htdocs/lib/zinc/reporter/ZincAuxiliaryInfoReports.php on line 245
Vendors
And 9 More
Clustered Target Annotations
| Code |
Organism Class |
Affinity (nM) |
LE (kcal/mol/atom) |
Type |
|
CP19A-3-E |
Cytochrome P450 19A1 (cluster #3 Of 3), Eukaryotic |
Eukaryotes |
960 |
0.50 |
Binding ≤ 10μM
|
|
NQO2-1-E |
Quinone Reductase 2 (cluster #1 Of 4), Eukaryotic |
Eukaryotes |
4100 |
0.44 |
Binding ≤ 10μM
|
Physical Representations
|
Type
pH range
|
xlogP
|
Des A‑Pol
Apolar desolvation
(kcal/mol)
|
Des Pol
Polar desolvation
(kcal/mol)
|
H Don
H-bond donors
|
H Acc
H-bond acceptors
|
Chg
Net charge
|
tPSA
(Ų)
|
MWT
Molecular weight
(g/mol)
|
RB
Rotatable bonds
|
DL |
|
Ref
Reference (pH 7)
|
2.37 |
1.93 |
-11.04 |
0 |
4 |
0 |
40 |
233.267 |
2 |
↓
|
|
|
|
Analogs
Draw
Identity
99%
90%
80%
70%
Vendors
And 1 More
Clustered Target Annotations
| Code |
Organism Class |
Affinity (nM) |
LE (kcal/mol/atom) |
Type |
|
MT3-1-E |
Metallothionein-3 (cluster #1 Of 1), Eukaryotic |
Eukaryotes |
58 |
0.51 |
Binding ≤ 10μM
|
|
MTR1A-1-E |
Melatonin Receptor 1A (cluster #1 Of 2), Eukaryotic |
Eukaryotes |
1000 |
0.42 |
Binding ≤ 10μM
|
|
MTR1B-1-E |
Melatonin Receptor 1B (cluster #1 Of 2), Eukaryotic |
Eukaryotes |
4000 |
0.38 |
Binding ≤ 10μM
|
|
NQO2-1-E |
Quinone Reductase 2 (cluster #1 Of 4), Eukaryotic |
Eukaryotes |
58 |
0.51 |
Binding ≤ 10μM
|
Physical Representations
|
Type
pH range
|
xlogP
|
Des A‑Pol
Apolar desolvation
(kcal/mol)
|
Des Pol
Polar desolvation
(kcal/mol)
|
H Don
H-bond donors
|
H Acc
H-bond acceptors
|
Chg
Net charge
|
tPSA
(Ų)
|
MWT
Molecular weight
(g/mol)
|
RB
Rotatable bonds
|
DL |
|
Ref
Reference (pH 7)
|
1.10 |
2.54 |
-17.68 |
3 |
6 |
0 |
83 |
275.308 |
5 |
↓
|
|
|
|
Analogs
-
1530863
-
Draw
Identity
99%
90%
80%
70%
Vendors
And 51 More
Physical Representations
|
Type
pH range
|
xlogP
|
Des A‑Pol
Apolar desolvation
(kcal/mol)
|
Des Pol
Polar desolvation
(kcal/mol)
|
H Don
H-bond donors
|
H Acc
H-bond acceptors
|
Chg
Net charge
|
tPSA
(Ų)
|
MWT
Molecular weight
(g/mol)
|
RB
Rotatable bonds
|
DL |
|
Ref
Reference (pH 7)
|
2.10 |
3.72 |
-45.19 |
4 |
4 |
1 |
62 |
260.361 |
6 |
↓
|
|
Mid
Mid (pH 6-8)
|
2.10 |
4.21 |
-92.22 |
5 |
4 |
2 |
63 |
261.369 |
6 |
↓
|
|
|
|
Analogs
-
1530862
-
Draw
Identity
99%
90%
80%
70%
Vendors
And 51 More
Physical Representations
|
Type
pH range
|
xlogP
|
Des A‑Pol
Apolar desolvation
(kcal/mol)
|
Des Pol
Polar desolvation
(kcal/mol)
|
H Don
H-bond donors
|
H Acc
H-bond acceptors
|
Chg
Net charge
|
tPSA
(Ų)
|
MWT
Molecular weight
(g/mol)
|
RB
Rotatable bonds
|
DL |
|
Ref
Reference (pH 7)
|
2.10 |
3.72 |
-45.2 |
4 |
4 |
1 |
62 |
260.361 |
6 |
↓
|
|
Mid
Mid (pH 6-8)
|
2.10 |
4.21 |
-92.18 |
5 |
4 |
2 |
63 |
261.369 |
6 |
↓
|
|
|
|
Analogs
Draw
Identity
99%
90%
80%
70%
Vendors
Clustered Target Annotations
| Code |
Organism Class |
Affinity (nM) |
LE (kcal/mol/atom) |
Type |
|
MTR1A-1-E |
Melatonin Receptor 1A (cluster #1 Of 2), Eukaryotic |
Eukaryotes |
19 |
0.51 |
Binding ≤ 10μM
|
|
MTR1B-1-E |
Melatonin Receptor 1B (cluster #1 Of 2), Eukaryotic |
Eukaryotes |
24 |
0.51 |
Binding ≤ 10μM
|
|
NQO2-1-E |
Quinone Reductase 2 (cluster #1 Of 4), Eukaryotic |
Eukaryotes |
0 |
0.00 |
Binding ≤ 10μM
|
Physical Representations
|
Type
pH range
|
xlogP
|
Des A‑Pol
Apolar desolvation
(kcal/mol)
|
Des Pol
Polar desolvation
(kcal/mol)
|
H Don
H-bond donors
|
H Acc
H-bond acceptors
|
Chg
Net charge
|
tPSA
(Ų)
|
MWT
Molecular weight
(g/mol)
|
RB
Rotatable bonds
|
DL |
|
Ref
Reference (pH 7)
|
2.54 |
5.24 |
-18.84 |
2 |
7 |
0 |
100 |
403.176 |
5 |
↓
|
|
|
|
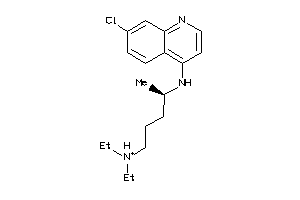
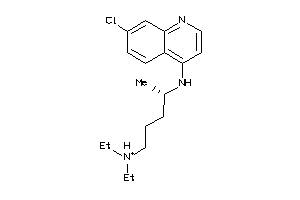
Analogs
Draw
Identity
99%
90%
80%
70%
Vendors
Clustered Target Annotations
| Code |
Organism Class |
Affinity (nM) |
LE (kcal/mol/atom) |
Type |
|
MTR1A-1-E |
Melatonin Receptor 1A (cluster #1 Of 2), Eukaryotic |
Eukaryotes |
0 |
0.00 |
Binding ≤ 10μM
|
|
MTR1B-1-E |
Melatonin Receptor 1B (cluster #1 Of 2), Eukaryotic |
Eukaryotes |
0 |
0.00 |
Binding ≤ 10μM
|
|
NQO2-1-E |
Quinone Reductase 2 (cluster #1 Of 4), Eukaryotic |
Eukaryotes |
70 |
0.48 |
Binding ≤ 10μM
|
Physical Representations
|
Type
pH range
|
xlogP
|
Des A‑Pol
Apolar desolvation
(kcal/mol)
|
Des Pol
Polar desolvation
(kcal/mol)
|
H Don
H-bond donors
|
H Acc
H-bond acceptors
|
Chg
Net charge
|
tPSA
(Ų)
|
MWT
Molecular weight
(g/mol)
|
RB
Rotatable bonds
|
DL |
|
Ref
Reference (pH 7)
|
2.54 |
5.94 |
-15.56 |
2 |
7 |
0 |
100 |
403.176 |
5 |
↓
|
|
|
|
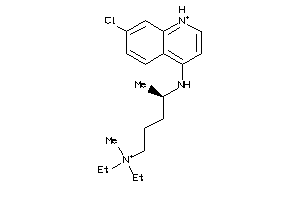
Analogs
Draw
Identity
99%
90%
80%
70%
Vendors
Clustered Target Annotations
| Code |
Organism Class |
Affinity (nM) |
LE (kcal/mol/atom) |
Type |
|
MTR1A-1-E |
Melatonin Receptor 1A (cluster #1 Of 2), Eukaryotic |
Eukaryotes |
1 |
0.57 |
Binding ≤ 10μM
|
|
MTR1B-1-E |
Melatonin Receptor 1B (cluster #1 Of 2), Eukaryotic |
Eukaryotes |
1 |
0.57 |
Binding ≤ 10μM
|
|
NQO2-1-E |
Quinone Reductase 2 (cluster #1 Of 4), Eukaryotic |
Eukaryotes |
6 |
0.52 |
Binding ≤ 10μM
|
Physical Representations
|
Type
pH range
|
xlogP
|
Des A‑Pol
Apolar desolvation
(kcal/mol)
|
Des Pol
Polar desolvation
(kcal/mol)
|
H Don
H-bond donors
|
H Acc
H-bond acceptors
|
Chg
Net charge
|
tPSA
(Ų)
|
MWT
Molecular weight
(g/mol)
|
RB
Rotatable bonds
|
DL |
|
Ref
Reference (pH 7)
|
2.61 |
7.6 |
-15.79 |
1 |
7 |
0 |
89 |
417.203 |
5 |
↓
|
|
|
|
Analogs
-
1530861
-
-
5850156
-
-
5850183
-
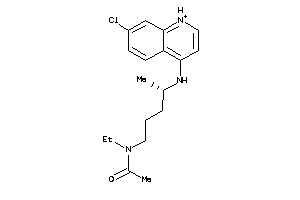
-
6424763
-
-
19144226
-
Draw
Identity
99%
90%
80%
70%
Vendors
And 66 More
Clustered Target Annotations
| Code |
Organism Class |
Affinity (nM) |
LE (kcal/mol/atom) |
Type |
|
HRP1-1-E |
Histidine-rich Protein (cluster #1 Of 1), Eukaryotic |
Eukaryotes |
400 |
0.41 |
Binding ≤ 10μM
|
|
KCNH2-5-E |
HERG (cluster #5 Of 5), Eukaryotic |
Eukaryotes |
2512 |
0.36 |
Binding ≤ 10μM
|
|
NQO2-1-E |
Quinone Reductase 2 (cluster #1 Of 4), Eukaryotic |
Eukaryotes |
1500 |
0.37 |
Binding ≤ 10μM
|
|
PRIO-1-E |
Prion Protein (cluster #1 Of 1), Eukaryotic |
Eukaryotes |
4000 |
0.34 |
Binding ≤ 10μM
|
|
HRP1-1-E |
Histidine-rich Protein (cluster #1 Of 1), Eukaryotic |
Eukaryotes |
77 |
0.45 |
Functional ≤ 10μM
|
|
Z100275-1-O |
Hemozoin (cluster #1 Of 1), Other |
Other |
400 |
0.41 |
Binding ≤ 10μM
|
|
Z100275-1-O |
Hemozoin (cluster #1 Of 1), Other |
Other |
77 |
0.45 |
Functional ≤ 10μM
|
|
Z100498-2-O |
Hepatocytes (cluster #2 Of 2), Other |
Other |
1900 |
0.36 |
Functional ≤ 10μM
|
|
Z101682-1-O |
BK Polyomavirus (cluster #1 Of 2), Other |
Other |
1700 |
0.37 |
Functional ≤ 10μM
|
|
Z102013-2-O |
Plasmodium Malariae (cluster #2 Of 2), Other |
Other |
14 |
0.50 |
Functional ≤ 10μM
|
|
Z102015-1-O |
Plasmodium Vivax (cluster #1 Of 1), Other |
Other |
90 |
0.45 |
Functional ≤ 10μM
|
|
Z50136-2-O |
Plasmodium Falciparum (isolate FcB1 / Columbia) (cluster #2 Of 3), Other |
Other |
167 |
0.43 |
Functional ≤ 10μM
|
|
Z50424-2-O |
Cryptosporidium Parvum (cluster #2 Of 2), Other |
Other |
27 |
0.48 |
Functional ≤ 10μM
|
|
Z50425-3-O |
Plasmodium Falciparum (cluster #3 Of 22), Other |
Other |
100 |
0.45 |
Functional ≤ 10μM
|
|
Z50426-9-O |
Plasmodium Falciparum (isolate K1 / Thailand) (cluster #9 Of 9), Other |
Other |
900 |
0.38 |
Functional ≤ 10μM
|
|
Z50468-2-O |
Giardia Intestinalis (cluster #2 Of 4), Other |
Other |
401 |
0.41 |
Functional ≤ 10μM
|
|
Z50473-4-O |
Plasmodium Berghei (cluster #4 Of 5), Other |
Other |
72 |
0.45 |
Functional ≤ 10μM
|
|
Z50474-1-O |
Plasmodium Yoelii (cluster #1 Of 1), Other |
Other |
106 |
0.44 |
Functional ≤ 10μM
|
|
Z80136-1-O |
FM3A (Breast Carcinoma Cells) (cluster #1 Of 6), Other |
Other |
0 |
0.00 |
Functional ≤ 10μM
|
|
Z80682-2-O |
A549 (Lung Carcinoma Cells) (cluster #2 Of 11), Other |
Other |
40 |
0.47 |
Functional ≤ 10μM
|
|
Z81138-1-O |
ScN2a (Scrapie-infected Neuroblastoma Cells) (cluster #1 Of 3), Other |
Other |
4000 |
0.34 |
Functional ≤ 10μM
|
|
Z81247-1-O |
HeLa (Cervical Adenocarcinoma Cells) (cluster #1 Of 9), Other |
Other |
9670 |
0.32 |
Functional ≤ 10μM
|
|
Z100081-2-O |
PBMC (Peripheral Blood Mononuclear Cells) (cluster #2 Of 2), Other |
Other |
5100 |
0.34 |
ADME/T ≤ 10μM
|
|
Z80186-3-O |
K562 (Erythroleukemia Cells) (cluster #3 Of 3), Other |
Other |
32 |
0.48 |
ADME/T ≤ 10μM
|
|
Z80291-2-O |
MRC5 (Embryonic Lung Fibroblast Cells) (cluster #2 Of 3), Other |
Other |
64 |
0.46 |
ADME/T ≤ 10μM
|
|
Z81020-1-O |
HepG2 (Hepatoblastoma Cells) (cluster #1 Of 1), Other |
Other |
8300 |
0.32 |
ADME/T ≤ 10μM |
|
Z81115-1-O |
KB (Squamous Cell Carcinoma) (cluster #1 Of 3), Other |
Other |
600 |
0.40 |
ADME/T ≤ 10μM
|
|
Z81135-5-O |
L6 (Skeletal Muscle Myoblast Cells) (cluster #5 Of 6), Other |
Other |
7700 |
0.33 |
ADME/T ≤ 10μM
|
Physical Representations
|
Type
pH range
|
xlogP
|
Des A‑Pol
Apolar desolvation
(kcal/mol)
|
Des Pol
Polar desolvation
(kcal/mol)
|
H Don
H-bond donors
|
H Acc
H-bond acceptors
|
Chg
Net charge
|
tPSA
(Ų)
|
MWT
Molecular weight
(g/mol)
|
RB
Rotatable bonds
|
DL |
|
Ref
Reference (pH 7)
|
5.01 |
10.55 |
-81.59 |
3 |
3 |
2 |
31 |
321.896 |
8 |
↓
|
|
|
|
Analogs
-
5850156
-
-
5850183
-
-
6424763
-
-
19144226
-
-
19144231
-
Draw
Identity
99%
90%
80%
70%
Vendors
And 64 More
Clustered Target Annotations
| Code |
Organism Class |
Affinity (nM) |
LE (kcal/mol/atom) |
Type |
|
HRP1-1-E |
Histidine-rich Protein (cluster #1 Of 1), Eukaryotic |
Eukaryotes |
400 |
0.41 |
Binding ≤ 10μM
|
|
KCNH2-5-E |
HERG (cluster #5 Of 5), Eukaryotic |
Eukaryotes |
2512 |
0.36 |
Binding ≤ 10μM
|
|
NQO2-1-E |
Quinone Reductase 2 (cluster #1 Of 4), Eukaryotic |
Eukaryotes |
1500 |
0.37 |
Binding ≤ 10μM
|
|
PRIO-1-E |
Prion Protein (cluster #1 Of 1), Eukaryotic |
Eukaryotes |
4000 |
0.34 |
Binding ≤ 10μM
|
|
HRP1-1-E |
Histidine-rich Protein (cluster #1 Of 1), Eukaryotic |
Eukaryotes |
77 |
0.45 |
Functional ≤ 10μM
|
|
Z100275-1-O |
Hemozoin (cluster #1 Of 1), Other |
Other |
400 |
0.41 |
Binding ≤ 10μM
|
|
Z100275-1-O |
Hemozoin (cluster #1 Of 1), Other |
Other |
77 |
0.45 |
Functional ≤ 10μM
|
|
Z100498-2-O |
Hepatocytes (cluster #2 Of 2), Other |
Other |
1900 |
0.36 |
Functional ≤ 10μM
|
|
Z101682-1-O |
BK Polyomavirus (cluster #1 Of 2), Other |
Other |
1700 |
0.37 |
Functional ≤ 10μM
|
|
Z102013-2-O |
Plasmodium Malariae (cluster #2 Of 2), Other |
Other |
14 |
0.50 |
Functional ≤ 10μM
|
|
Z102015-1-O |
Plasmodium Vivax (cluster #1 Of 1), Other |
Other |
90 |
0.45 |
Functional ≤ 10μM
|
|
Z50136-2-O |
Plasmodium Falciparum (isolate FcB1 / Columbia) (cluster #2 Of 3), Other |
Other |
167 |
0.43 |
Functional ≤ 10μM
|
|
Z50424-2-O |
Cryptosporidium Parvum (cluster #2 Of 2), Other |
Other |
27 |
0.48 |
Functional ≤ 10μM
|
|
Z50425-3-O |
Plasmodium Falciparum (cluster #3 Of 22), Other |
Other |
100 |
0.45 |
Functional ≤ 10μM
|
|
Z50426-9-O |
Plasmodium Falciparum (isolate K1 / Thailand) (cluster #9 Of 9), Other |
Other |
900 |
0.38 |
Functional ≤ 10μM
|
|
Z50468-2-O |
Giardia Intestinalis (cluster #2 Of 4), Other |
Other |
401 |
0.41 |
Functional ≤ 10μM
|
|
Z50473-4-O |
Plasmodium Berghei (cluster #4 Of 5), Other |
Other |
72 |
0.45 |
Functional ≤ 10μM
|
|
Z50474-1-O |
Plasmodium Yoelii (cluster #1 Of 1), Other |
Other |
106 |
0.44 |
Functional ≤ 10μM
|
|
Z80136-1-O |
FM3A (Breast Carcinoma Cells) (cluster #1 Of 6), Other |
Other |
0 |
0.00 |
Functional ≤ 10μM
|
|
Z80682-2-O |
A549 (Lung Carcinoma Cells) (cluster #2 Of 11), Other |
Other |
40 |
0.47 |
Functional ≤ 10μM
|
|
Z81138-1-O |
ScN2a (Scrapie-infected Neuroblastoma Cells) (cluster #1 Of 3), Other |
Other |
4000 |
0.34 |
Functional ≤ 10μM
|
|
Z81247-1-O |
HeLa (Cervical Adenocarcinoma Cells) (cluster #1 Of 9), Other |
Other |
9670 |
0.32 |
Functional ≤ 10μM
|
|
Z100081-2-O |
PBMC (Peripheral Blood Mononuclear Cells) (cluster #2 Of 2), Other |
Other |
5100 |
0.34 |
ADME/T ≤ 10μM
|
|
Z80186-3-O |
K562 (Erythroleukemia Cells) (cluster #3 Of 3), Other |
Other |
32 |
0.48 |
ADME/T ≤ 10μM
|
|
Z80291-2-O |
MRC5 (Embryonic Lung Fibroblast Cells) (cluster #2 Of 3), Other |
Other |
64 |
0.46 |
ADME/T ≤ 10μM
|
|
Z81020-1-O |
HepG2 (Hepatoblastoma Cells) (cluster #1 Of 1), Other |
Other |
8300 |
0.32 |
ADME/T ≤ 10μM |
|
Z81115-1-O |
KB (Squamous Cell Carcinoma) (cluster #1 Of 3), Other |
Other |
600 |
0.40 |
ADME/T ≤ 10μM
|
|
Z81135-5-O |
L6 (Skeletal Muscle Myoblast Cells) (cluster #5 Of 6), Other |
Other |
7700 |
0.33 |
ADME/T ≤ 10μM
|
Physical Representations
|
Type
pH range
|
xlogP
|
Des A‑Pol
Apolar desolvation
(kcal/mol)
|
Des Pol
Polar desolvation
(kcal/mol)
|
H Don
H-bond donors
|
H Acc
H-bond acceptors
|
Chg
Net charge
|
tPSA
(Ų)
|
MWT
Molecular weight
(g/mol)
|
RB
Rotatable bonds
|
DL |
|
Ref
Reference (pH 7)
|
5.01 |
10.55 |
-81.48 |
3 |
3 |
2 |
31 |
321.896 |
8 |
↓
|
|