|
|
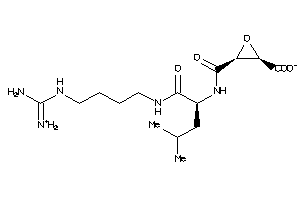
Analogs
Draw
Identity
99%
90%
80%
70%
Vendors
Clustered Target Annotations
| Code |
Organism Class |
Affinity (nM) |
LE (kcal/mol/atom) |
Type |
|
CATL1-1-E |
Cathepsin L (cluster #1 Of 5), Eukaryotic |
Eukaryotes |
2 |
0.35 |
Binding ≤ 10μM
|
Physical Representations
|
Type
pH range
|
xlogP
|
Des A‑Pol
Apolar desolvation
(kcal/mol)
|
Des Pol
Polar desolvation
(kcal/mol)
|
H Don
H-bond donors
|
H Acc
H-bond acceptors
|
Chg
Net charge
|
tPSA
(Ų)
|
MWT
Molecular weight
(g/mol)
|
RB
Rotatable bonds
|
DL |
|
Ref
Reference (pH 7)
|
4.64 |
8.95 |
-23.61 |
3 |
7 |
0 |
108 |
491.613 |
10 |
↓
|
|
|
|
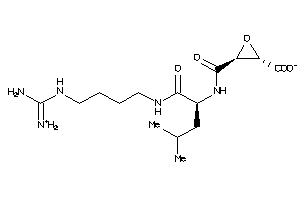
Analogs
Draw
Identity
99%
90%
80%
70%
Vendors
Physical Representations
|
Type
pH range
|
xlogP
|
Des A‑Pol
Apolar desolvation
(kcal/mol)
|
Des Pol
Polar desolvation
(kcal/mol)
|
H Don
H-bond donors
|
H Acc
H-bond acceptors
|
Chg
Net charge
|
tPSA
(Ų)
|
MWT
Molecular weight
(g/mol)
|
RB
Rotatable bonds
|
DL |
|
Ref
Reference (pH 7)
|
2.65 |
6.28 |
-64.28 |
4 |
6 |
1 |
109 |
392.405 |
8 |
↓
|
|
Hi
High (pH 8-9.5)
|
2.65 |
5.12 |
-18.7 |
3 |
6 |
0 |
105 |
391.397 |
8 |
↓
|
|
|
|
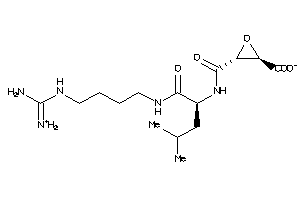
Analogs
Draw
Identity
99%
90%
80%
70%
Vendors
Clustered Target Annotations
| Code |
Organism Class |
Affinity (nM) |
LE (kcal/mol/atom) |
Type |
|
CATC-2-E |
Dipeptidyl Peptidase I (cluster #2 Of 3), Eukaryotic |
Eukaryotes |
2 |
0.61 |
Binding ≤ 10μM |
|
CATK-1-E |
Cathepsin K (cluster #1 Of 3), Eukaryotic |
Eukaryotes |
40 |
0.52 |
Binding ≤ 10μM |
|
CATL1-1-E |
Cathepsin L (cluster #1 Of 5), Eukaryotic |
Eukaryotes |
501 |
0.44 |
Binding ≤ 10μM |
|
CATS-2-E |
Cathepsin S (cluster #2 Of 2), Eukaryotic |
Eukaryotes |
1000 |
0.42 |
Binding ≤ 10μM |
Physical Representations
|
Type
pH range
|
xlogP
|
Des A‑Pol
Apolar desolvation
(kcal/mol)
|
Des Pol
Polar desolvation
(kcal/mol)
|
H Don
H-bond donors
|
H Acc
H-bond acceptors
|
Chg
Net charge
|
tPSA
(Ų)
|
MWT
Molecular weight
(g/mol)
|
RB
Rotatable bonds
|
DL |
|
Ref
Reference (pH 7)
|
2.80 |
5.93 |
-11.49 |
1 |
5 |
0 |
73 |
423.13 |
3 |
↓
|
|
Mid
Mid (pH 6-8)
|
2.80 |
6.13 |
-33.48 |
1 |
5 |
0 |
76 |
423.13 |
3 |
↓
|
|
|
|
Analogs
Draw
Identity
99%
90%
80%
70%
Vendors
Clustered Target Annotations
| Code |
Organism Class |
Affinity (nM) |
LE (kcal/mol/atom) |
Type |
|
CAN2-1-E |
Calpain 2 (cluster #1 Of 1), Eukaryotic |
Eukaryotes |
184 |
0.29 |
Binding ≤ 10μM
|
|
CATB-1-E |
Cathepsin B (cluster #1 Of 6), Eukaryotic |
Eukaryotes |
85 |
0.30 |
Binding ≤ 10μM
|
|
CATL1-1-E |
Cathepsin L (cluster #1 Of 5), Eukaryotic |
Eukaryotes |
1 |
0.38 |
Binding ≤ 10μM
|
Physical Representations
|
Type
pH range
|
xlogP
|
Des A‑Pol
Apolar desolvation
(kcal/mol)
|
Des Pol
Polar desolvation
(kcal/mol)
|
H Don
H-bond donors
|
H Acc
H-bond acceptors
|
Chg
Net charge
|
tPSA
(Ų)
|
MWT
Molecular weight
(g/mol)
|
RB
Rotatable bonds
|
DL |
|
Ref
Reference (pH 7)
|
5.37 |
-2.7 |
-18.02 |
3 |
7 |
0 |
104 |
446.503 |
11 |
↓
|
|
|
|
Analogs
-
4475165
-
-
13493525
-
Draw
Identity
99%
90%
80%
70%
Vendors
Clustered Target Annotations
| Code |
Organism Class |
Affinity (nM) |
LE (kcal/mol/atom) |
Type |
|
CATB-1-E |
Cathepsin B (cluster #1 Of 6), Eukaryotic |
Eukaryotes |
16 |
0.44 |
Binding ≤ 10μM
|
|
CATC-1-E |
Dipeptidyl Peptidase I (cluster #1 Of 3), Eukaryotic |
Eukaryotes |
770 |
0.34 |
Binding ≤ 10μM
|
|
CATH-1-E |
Cathepsin H (cluster #1 Of 2), Eukaryotic |
Eukaryotes |
190 |
0.38 |
Binding ≤ 10μM
|
|
CATL1-1-E |
Cathepsin L (cluster #1 Of 5), Eukaryotic |
Eukaryotes |
47 |
0.41 |
Binding ≤ 10μM
|
|
CATS-2-E |
Cathepsin S (cluster #2 Of 2), Eukaryotic |
Eukaryotes |
7 |
0.46 |
Binding ≤ 10μM
|
|
PAPA1-2-E |
Papain (cluster #2 Of 2), Eukaryotic |
Eukaryotes |
47 |
0.41 |
Binding ≤ 10μM
|
|
Q9N6S8-1-E |
Falcipain 2 (cluster #1 Of 2), Eukaryotic |
Eukaryotes |
58 |
0.41 |
Binding ≤ 10μM
|
|
Q9NBA7-1-E |
Cysteine Protease Falcipain-3 (cluster #1 Of 2), Eukaryotic |
Eukaryotes |
75 |
0.40 |
Binding ≤ 10μM
|
|
Z50425-1-O |
Plasmodium Falciparum (cluster #1 Of 22), Other |
Other |
9300 |
0.28 |
Functional ≤ 10μM
|
|
Z50426-3-O |
Plasmodium Falciparum (isolate K1 / Thailand) (cluster #3 Of 9), Other |
Other |
2500 |
0.31 |
Functional ≤ 10μM
|
Physical Representations
|
Type
pH range
|
xlogP
|
Des A‑Pol
Apolar desolvation
(kcal/mol)
|
Des Pol
Polar desolvation
(kcal/mol)
|
H Don
H-bond donors
|
H Acc
H-bond acceptors
|
Chg
Net charge
|
tPSA
(Ų)
|
MWT
Molecular weight
(g/mol)
|
RB
Rotatable bonds
|
DL |
|
Ref
Reference (pH 7)
|
-1.37 |
1.58 |
-72.44 |
7 |
10 |
0 |
174 |
357.411 |
12 |
↓
|
|
|
|
Analogs
-
13493525
-
-
4095645
-
Draw
Identity
99%
90%
80%
70%
Vendors
Clustered Target Annotations
| Code |
Organism Class |
Affinity (nM) |
LE (kcal/mol/atom) |
Type |
|
CATB-1-E |
Cathepsin B (cluster #1 Of 6), Eukaryotic |
Eukaryotes |
16 |
0.44 |
Binding ≤ 10μM
|
|
CATC-1-E |
Dipeptidyl Peptidase I (cluster #1 Of 3), Eukaryotic |
Eukaryotes |
770 |
0.34 |
Binding ≤ 10μM
|
|
CATH-1-E |
Cathepsin H (cluster #1 Of 2), Eukaryotic |
Eukaryotes |
190 |
0.38 |
Binding ≤ 10μM
|
|
CATL1-1-E |
Cathepsin L (cluster #1 Of 5), Eukaryotic |
Eukaryotes |
47 |
0.41 |
Binding ≤ 10μM
|
|
CATS-2-E |
Cathepsin S (cluster #2 Of 2), Eukaryotic |
Eukaryotes |
7 |
0.46 |
Binding ≤ 10μM
|
|
PAPA1-2-E |
Papain (cluster #2 Of 2), Eukaryotic |
Eukaryotes |
47 |
0.41 |
Binding ≤ 10μM
|
|
Q9N6S8-1-E |
Falcipain 2 (cluster #1 Of 2), Eukaryotic |
Eukaryotes |
58 |
0.41 |
Binding ≤ 10μM
|
|
Q9NBA7-1-E |
Cysteine Protease Falcipain-3 (cluster #1 Of 2), Eukaryotic |
Eukaryotes |
75 |
0.40 |
Binding ≤ 10μM
|
|
Z50425-1-O |
Plasmodium Falciparum (cluster #1 Of 22), Other |
Other |
9300 |
0.28 |
Functional ≤ 10μM
|
|
Z50426-3-O |
Plasmodium Falciparum (isolate K1 / Thailand) (cluster #3 Of 9), Other |
Other |
2500 |
0.31 |
Functional ≤ 10μM
|
Physical Representations
|
Type
pH range
|
xlogP
|
Des A‑Pol
Apolar desolvation
(kcal/mol)
|
Des Pol
Polar desolvation
(kcal/mol)
|
H Don
H-bond donors
|
H Acc
H-bond acceptors
|
Chg
Net charge
|
tPSA
(Ų)
|
MWT
Molecular weight
(g/mol)
|
RB
Rotatable bonds
|
DL |
|
Ref
Reference (pH 7)
|
-1.37 |
1.94 |
-73.1 |
7 |
10 |
0 |
174 |
357.411 |
12 |
↓
|
|
|
|
Analogs
Draw
Identity
99%
90%
80%
70%
Vendors
And 1 More
Physical Representations
|
Type
pH range
|
xlogP
|
Des A‑Pol
Apolar desolvation
(kcal/mol)
|
Des Pol
Polar desolvation
(kcal/mol)
|
H Don
H-bond donors
|
H Acc
H-bond acceptors
|
Chg
Net charge
|
tPSA
(Ų)
|
MWT
Molecular weight
(g/mol)
|
RB
Rotatable bonds
|
DL |
|
Ref
Reference (pH 7)
|
3.61 |
5.18 |
-13.56 |
2 |
6 |
0 |
91 |
303.362 |
7 |
↓
|
|
Hi
High (pH 8-9.5)
|
3.80 |
2.8 |
-43.27 |
1 |
6 |
-1 |
98 |
302.354 |
7 |
↓
|
|
|
|
Analogs
Draw
Identity
99%
90%
80%
70%
Vendors
Clustered Target Annotations
| Code |
Organism Class |
Affinity (nM) |
LE (kcal/mol/atom) |
Type |
|
CATB-1-E |
Cathepsin B (cluster #1 Of 6), Eukaryotic |
Eukaryotes |
6200 |
0.20 |
Binding ≤ 10μM
|
|
CATF-1-E |
Cathepsin F (cluster #1 Of 1), Eukaryotic |
Eukaryotes |
1100 |
0.23 |
Binding ≤ 10μM
|
|
CATK-1-E |
Cathepsin K (cluster #1 Of 3), Eukaryotic |
Eukaryotes |
40 |
0.28 |
Binding ≤ 10μM
|
|
CATL1-1-E |
Cathepsin L (cluster #1 Of 5), Eukaryotic |
Eukaryotes |
760 |
0.23 |
Binding ≤ 10μM
|
|
CATL2-1-E |
Cathepsin L2 (cluster #1 Of 1), Eukaryotic |
Eukaryotes |
75 |
0.27 |
Binding ≤ 10μM
|
|
CATS-2-E |
Cathepsin S (cluster #2 Of 2), Eukaryotic |
Eukaryotes |
120 |
0.26 |
Binding ≤ 10μM
|
|
CMA1-1-E |
Mast Cell Protease 3 (cluster #1 Of 1), Eukaryotic |
Eukaryotes |
32 |
0.28 |
Binding ≤ 10μM
|
|
Z50643-1-O |
Hepatitis C Virus (cluster #1 Of 2), Other |
Other |
14 |
0.30 |
Binding ≤ 10μM
|
|
Z50643-5-O |
Hepatitis C Virus (cluster #5 Of 5), Other |
Other |
200 |
0.25 |
Functional ≤ 10μM |
|
A3EZI9-2-V |
Hepatitis C Virus NS3 Protease/helicase (cluster #2 Of 3), Viral |
Viruses |
14 |
0.30 |
Binding ≤ 10μM
|
|
A3EZI9-2-V |
Hepatitis C Virus NS3 Protease/helicase (cluster #2 Of 3), Viral |
Viruses |
14 |
0.30 |
Binding ≤ 10μM
|
|
D2K2A8-1-V |
Hepatitis C Virus NS4A Protein (cluster #1 Of 1), Viral |
Viruses |
14 |
0.30 |
Binding ≤ 10μM
|
Physical Representations
|
Type
pH range
|
xlogP
|
Des A‑Pol
Apolar desolvation
(kcal/mol)
|
Des Pol
Polar desolvation
(kcal/mol)
|
H Don
H-bond donors
|
H Acc
H-bond acceptors
|
Chg
Net charge
|
tPSA
(Ų)
|
MWT
Molecular weight
(g/mol)
|
RB
Rotatable bonds
|
DL |
|
Ref
Reference (pH 7)
|
1.80 |
6.12 |
-12.14 |
5 |
10 |
0 |
151 |
519.687 |
10 |
↓
|
|
|
|
Analogs
Draw
Identity
99%
90%
80%
70%
Vendors
Clustered Target Annotations
| Code |
Organism Class |
Affinity (nM) |
LE (kcal/mol/atom) |
Type |
|
CATB-1-E |
Cathepsin B (cluster #1 Of 6), Eukaryotic |
Eukaryotes |
6200 |
0.20 |
Binding ≤ 10μM
|
|
CATF-1-E |
Cathepsin F (cluster #1 Of 1), Eukaryotic |
Eukaryotes |
1100 |
0.23 |
Binding ≤ 10μM
|
|
CATK-1-E |
Cathepsin K (cluster #1 Of 3), Eukaryotic |
Eukaryotes |
40 |
0.28 |
Binding ≤ 10μM
|
|
CATL1-1-E |
Cathepsin L (cluster #1 Of 5), Eukaryotic |
Eukaryotes |
760 |
0.23 |
Binding ≤ 10μM
|
|
CATL2-1-E |
Cathepsin L2 (cluster #1 Of 1), Eukaryotic |
Eukaryotes |
75 |
0.27 |
Binding ≤ 10μM
|
|
CATS-2-E |
Cathepsin S (cluster #2 Of 2), Eukaryotic |
Eukaryotes |
120 |
0.26 |
Binding ≤ 10μM
|
|
CMA1-1-E |
Mast Cell Protease 3 (cluster #1 Of 1), Eukaryotic |
Eukaryotes |
32 |
0.28 |
Binding ≤ 10μM
|
|
Z50643-1-O |
Hepatitis C Virus (cluster #1 Of 2), Other |
Other |
14 |
0.30 |
Binding ≤ 10μM
|
|
Z50643-5-O |
Hepatitis C Virus (cluster #5 Of 5), Other |
Other |
200 |
0.25 |
Functional ≤ 10μM |
|
A3EZI9-2-V |
Hepatitis C Virus NS3 Protease/helicase (cluster #2 Of 3), Viral |
Viruses |
14 |
0.30 |
Binding ≤ 10μM
|
Physical Representations
|
Type
pH range
|
xlogP
|
Des A‑Pol
Apolar desolvation
(kcal/mol)
|
Des Pol
Polar desolvation
(kcal/mol)
|
H Don
H-bond donors
|
H Acc
H-bond acceptors
|
Chg
Net charge
|
tPSA
(Ų)
|
MWT
Molecular weight
(g/mol)
|
RB
Rotatable bonds
|
DL |
|
Ref
Reference (pH 7)
|
1.80 |
6.18 |
-13.07 |
5 |
10 |
0 |
151 |
519.687 |
10 |
↓
|
|
|
|
Analogs
Draw
Identity
99%
90%
80%
70%
Vendors
Clustered Target Annotations
| Code |
Organism Class |
Affinity (nM) |
LE (kcal/mol/atom) |
Type |
|
CATB-1-E |
Cathepsin B (cluster #1 Of 6), Eukaryotic |
Eukaryotes |
4400 |
0.15 |
Binding ≤ 10μM
|
|
CATK-1-E |
Cathepsin K (cluster #1 Of 3), Eukaryotic |
Eukaryotes |
630 |
0.18 |
Binding ≤ 10μM
|
|
CATL1-1-E |
Cathepsin L (cluster #1 Of 5), Eukaryotic |
Eukaryotes |
3500 |
0.16 |
Binding ≤ 10μM
|
|
CATL2-1-E |
Cathepsin L2 (cluster #1 Of 1), Eukaryotic |
Eukaryotes |
1350 |
0.17 |
Binding ≤ 10μM
|
|
CATS-2-E |
Cathepsin S (cluster #2 Of 2), Eukaryotic |
Eukaryotes |
300 |
0.19 |
Binding ≤ 10μM
|
|
CELA1-1-E |
Elastase 1 (cluster #1 Of 1), Eukaryotic |
Eukaryotes |
30 |
0.21 |
Binding ≤ 10μM
|
|
CMA1-1-E |
Mast Cell Protease 3 (cluster #1 Of 1), Eukaryotic |
Eukaryotes |
26 |
0.22 |
Binding ≤ 10μM
|
|
ELNE-2-E |
Neutrophil Elastase (cluster #2 Of 3), Eukaryotic |
Eukaryotes |
8000 |
0.15 |
Binding ≤ 10μM
|
|
Z50643-1-O |
Hepatitis C Virus (cluster #1 Of 2), Other |
Other |
44 |
0.21 |
Binding ≤ 10μM
|
|
Z50643-5-O |
Hepatitis C Virus (cluster #5 Of 5), Other |
Other |
9600 |
0.14 |
Functional ≤ 10μM
|
Physical Representations
|
Type
pH range
|
xlogP
|
Des A‑Pol
Apolar desolvation
(kcal/mol)
|
Des Pol
Polar desolvation
(kcal/mol)
|
H Don
H-bond donors
|
H Acc
H-bond acceptors
|
Chg
Net charge
|
tPSA
(Ų)
|
MWT
Molecular weight
(g/mol)
|
RB
Rotatable bonds
|
DL |
|
Ref
Reference (pH 7)
|
2.76 |
8.42 |
-16.9 |
4 |
13 |
0 |
180 |
679.863 |
14 |
↓
|
|
|
|
Analogs
Draw
Identity
99%
90%
80%
70%
Vendors
And 14 More
Clustered Target Annotations
| Code |
Organism Class |
Affinity (nM) |
LE (kcal/mol/atom) |
Type |
|
CATK-3-E |
Cathepsin K (cluster #3 Of 3), Eukaryotic |
Eukaryotes |
3981 |
1.08 |
Binding ≤ 10μM |
|
CATL1-4-E |
Cathepsin L (cluster #4 Of 5), Eukaryotic |
Eukaryotes |
4000 |
1.08 |
Binding ≤ 10μM
|
Physical Representations
|
Type
pH range
|
xlogP
|
Des A‑Pol
Apolar desolvation
(kcal/mol)
|
Des Pol
Polar desolvation
(kcal/mol)
|
H Don
H-bond donors
|
H Acc
H-bond acceptors
|
Chg
Net charge
|
tPSA
(Ų)
|
MWT
Molecular weight
(g/mol)
|
RB
Rotatable bonds
|
DL |
|
Ref
Reference (pH 7)
|
0.52 |
6.22 |
-5.23 |
0 |
2 |
0 |
27 |
96.133 |
0 |
↓
|
|
|
|
Analogs
-
4097409
-
Draw
Identity
99%
90%
80%
70%
Vendors
And 3 More
Clustered Target Annotations
| Code |
Organism Class |
Affinity (nM) |
LE (kcal/mol/atom) |
Type |
|
CATB-3-E |
Cathepsin B (cluster #3 Of 6), Eukaryotic |
Eukaryotes |
8600 |
0.79 |
Binding ≤ 10μM
|
|
CATL1-2-E |
Cathepsin L (cluster #2 Of 5), Eukaryotic |
Eukaryotes |
9300 |
0.78 |
Binding ≤ 10μM
|
|
Q95PM0-3-E |
Rhodesain (cluster #3 Of 3), Eukaryotic |
Eukaryotes |
5310 |
0.82 |
Binding ≤ 10μM
|
|
TRPA1-5-E |
Transient Receptor Potential Cation Channel Subfamily A Member 1 (cluster #5 Of 5), Eukaryotic |
Eukaryotes |
1320 |
0.91 |
Binding ≤ 10μM |
|
Z50425-19-O |
Plasmodium Falciparum (cluster #19 Of 22), Other |
Other |
5210 |
0.82 |
Functional ≤ 10μM
|
|
Z80156-11-O |
HL-60 (Promyeloblast Leukemia Cells) (cluster #11 Of 12), Other |
Other |
5500 |
0.82 |
Functional ≤ 10μM
|
Physical Representations
|
Type
pH range
|
xlogP
|
Des A‑Pol
Apolar desolvation
(kcal/mol)
|
Des Pol
Polar desolvation
(kcal/mol)
|
H Don
H-bond donors
|
H Acc
H-bond acceptors
|
Chg
Net charge
|
tPSA
(Ų)
|
MWT
Molecular weight
(g/mol)
|
RB
Rotatable bonds
|
DL |
|
Ref
Reference (pH 7)
|
2.06 |
-0.02 |
-9.12 |
0 |
1 |
0 |
17 |
162.279 |
5 |
↓
|
|
|
|
Analogs
-
1530846
-
Draw
Identity
99%
90%
80%
70%
Vendors
And 3 More
Clustered Target Annotations
| Code |
Organism Class |
Affinity (nM) |
LE (kcal/mol/atom) |
Type |
|
CATB-3-E |
Cathepsin B (cluster #3 Of 6), Eukaryotic |
Eukaryotes |
8600 |
0.79 |
Binding ≤ 10μM
|
|
CATL1-2-E |
Cathepsin L (cluster #2 Of 5), Eukaryotic |
Eukaryotes |
9300 |
0.78 |
Binding ≤ 10μM
|
|
Q95PM0-3-E |
Rhodesain (cluster #3 Of 3), Eukaryotic |
Eukaryotes |
5310 |
0.82 |
Binding ≤ 10μM
|
|
TRPA1-5-E |
Transient Receptor Potential Cation Channel Subfamily A Member 1 (cluster #5 Of 5), Eukaryotic |
Eukaryotes |
1320 |
0.91 |
Binding ≤ 10μM |
|
Z50425-19-O |
Plasmodium Falciparum (cluster #19 Of 22), Other |
Other |
5210 |
0.82 |
Functional ≤ 10μM
|
|
Z80156-11-O |
HL-60 (Promyeloblast Leukemia Cells) (cluster #11 Of 12), Other |
Other |
5500 |
0.82 |
Functional ≤ 10μM
|
Physical Representations
|
Type
pH range
|
xlogP
|
Des A‑Pol
Apolar desolvation
(kcal/mol)
|
Des Pol
Polar desolvation
(kcal/mol)
|
H Don
H-bond donors
|
H Acc
H-bond acceptors
|
Chg
Net charge
|
tPSA
(Ų)
|
MWT
Molecular weight
(g/mol)
|
RB
Rotatable bonds
|
DL |
|
Ref
Reference (pH 7)
|
2.06 |
-0.26 |
-9.78 |
0 |
1 |
0 |
17 |
162.279 |
5 |
↓
|
|
|
|
Analogs
Draw
Identity
99%
90%
80%
70%
Vendors
And 6 More
Clustered Target Annotations
| Code |
Organism Class |
Affinity (nM) |
LE (kcal/mol/atom) |
Type |
|
CAN2-1-E |
Calpain 2 (cluster #1 Of 1), Eukaryotic |
Eukaryotes |
104 |
0.30 |
Binding ≤ 10μM |
|
CATB-1-E |
Cathepsin B (cluster #1 Of 6), Eukaryotic |
Eukaryotes |
70 |
0.30 |
Binding ≤ 10μM |
|
CATL1-1-E |
Cathepsin L (cluster #1 Of 5), Eukaryotic |
Eukaryotes |
1 |
0.38 |
Binding ≤ 10μM |
|
CATL2-1-E |
Cathepsin L2 (cluster #1 Of 1), Eukaryotic |
Eukaryotes |
1 |
0.38 |
Binding ≤ 10μM |
Physical Representations
|
Type
pH range
|
xlogP
|
Des A‑Pol
Apolar desolvation
(kcal/mol)
|
Des Pol
Polar desolvation
(kcal/mol)
|
H Don
H-bond donors
|
H Acc
H-bond acceptors
|
Chg
Net charge
|
tPSA
(Ų)
|
MWT
Molecular weight
(g/mol)
|
RB
Rotatable bonds
|
DL |
|
Ref
Reference (pH 7)
|
3.82 |
11.54 |
-52.19 |
2 |
7 |
-1 |
108 |
445.495 |
11 |
↓
|
|
|
|
Analogs
Draw
Identity
99%
90%
80%
70%
Vendors
Physical Representations
|
Type
pH range
|
xlogP
|
Des A‑Pol
Apolar desolvation
(kcal/mol)
|
Des Pol
Polar desolvation
(kcal/mol)
|
H Don
H-bond donors
|
H Acc
H-bond acceptors
|
Chg
Net charge
|
tPSA
(Ų)
|
MWT
Molecular weight
(g/mol)
|
RB
Rotatable bonds
|
DL |
|
Ref
Reference (pH 7)
|
2.87 |
-2.16 |
-52.34 |
3 |
7 |
1 |
89 |
412.558 |
7 |
↓
|
|
|
|
Analogs
-
2369677
-
Draw
Identity
99%
90%
80%
70%
Vendors
Physical Representations
|
Type
pH range
|
xlogP
|
Des A‑Pol
Apolar desolvation
(kcal/mol)
|
Des Pol
Polar desolvation
(kcal/mol)
|
H Don
H-bond donors
|
H Acc
H-bond acceptors
|
Chg
Net charge
|
tPSA
(Ų)
|
MWT
Molecular weight
(g/mol)
|
RB
Rotatable bonds
|
DL |
|
Ref
Reference (pH 7)
|
1.83 |
5.46 |
-11.78 |
2 |
3 |
0 |
60 |
223.231 |
0 |
↓
|
|
|
|
|
|
|
Analogs
-
1996112
-
Draw
Identity
99%
90%
80%
70%
Vendors
Clustered Target Annotations
| Code |
Organism Class |
Affinity (nM) |
LE (kcal/mol/atom) |
Type |
|
CAN1-1-E |
Calpain 1 (cluster #1 Of 2), Eukaryotic |
Eukaryotes |
20 |
0.38 |
Binding ≤ 10μM
|
|
CAN2-1-E |
Calpain 2 (cluster #1 Of 1), Eukaryotic |
Eukaryotes |
10 |
0.40 |
Binding ≤ 10μM
|
|
CANX-1-E |
Calpain 1/2 (cluster #1 Of 1), Eukaryotic |
Eukaryotes |
10 |
0.40 |
Binding ≤ 10μM
|
|
CATB-1-E |
Cathepsin B (cluster #1 Of 6), Eukaryotic |
Eukaryotes |
25 |
0.38 |
Binding ≤ 10μM
|
|
CATL1-1-E |
Cathepsin L (cluster #1 Of 5), Eukaryotic |
Eukaryotes |
1270 |
0.29 |
Binding ≤ 10μM
|
|
CPNS1-1-E |
Calpain Small Subunit 1 (cluster #1 Of 2), Eukaryotic |
Eukaryotes |
40 |
0.37 |
Binding ≤ 10μM |
|
Q3HTL5-1-E |
Falcipain 2B (cluster #1 Of 1), Eukaryotic |
Eukaryotes |
5000 |
0.27 |
Binding ≤ 10μM
|
|
Q9N6S8-1-E |
Falcipain 2 (cluster #1 Of 2), Eukaryotic |
Eukaryotes |
5000 |
0.27 |
Binding ≤ 10μM
|
|
CAN1-1-E |
Calpain 1 (cluster #1 Of 1), Eukaryotic |
Eukaryotes |
700 |
0.31 |
Functional ≤ 10μM
|
|
CAN2-1-E |
Calpain 2 (cluster #1 Of 1), Eukaryotic |
Eukaryotes |
700 |
0.31 |
Functional ≤ 10μM
|
|
CPNS1-1-E |
Calpain Small Subunit 1 (cluster #1 Of 1), Eukaryotic |
Eukaryotes |
700 |
0.31 |
Functional ≤ 10μM
|
|
Z100494-1-O |
C2C12 (Myoblast Cells) (cluster #1 Of 1), Other |
Other |
10000 |
0.25 |
Binding ≤ 10μM
|
|
Z50425-3-O |
Plasmodium Falciparum (cluster #3 Of 22), Other |
Other |
3981 |
0.27 |
Functional ≤ 10μM
|
Physical Representations
|
Type
pH range
|
xlogP
|
Des A‑Pol
Apolar desolvation
(kcal/mol)
|
Des Pol
Polar desolvation
(kcal/mol)
|
H Don
H-bond donors
|
H Acc
H-bond acceptors
|
Chg
Net charge
|
tPSA
(Ų)
|
MWT
Molecular weight
(g/mol)
|
RB
Rotatable bonds
|
DL |
|
Ref
Reference (pH 7)
|
5.17 |
8.75 |
-13.99 |
2 |
6 |
0 |
85 |
382.46 |
10 |
↓
|
|
|
|
Analogs
-
1534489
-
Draw
Identity
99%
90%
80%
70%
Vendors
Clustered Target Annotations
| Code |
Organism Class |
Affinity (nM) |
LE (kcal/mol/atom) |
Type |
|
CAN1-1-E |
Calpain 1 (cluster #1 Of 2), Eukaryotic |
Eukaryotes |
20 |
0.38 |
Binding ≤ 10μM
|
|
CAN2-1-E |
Calpain 2 (cluster #1 Of 1), Eukaryotic |
Eukaryotes |
10 |
0.40 |
Binding ≤ 10μM
|
|
CANX-1-E |
Calpain 1/2 (cluster #1 Of 1), Eukaryotic |
Eukaryotes |
10 |
0.40 |
Binding ≤ 10μM
|
|
CATB-1-E |
Cathepsin B (cluster #1 Of 6), Eukaryotic |
Eukaryotes |
25 |
0.38 |
Binding ≤ 10μM
|
|
CATL1-1-E |
Cathepsin L (cluster #1 Of 5), Eukaryotic |
Eukaryotes |
1270 |
0.29 |
Binding ≤ 10μM
|
|
CPNS1-1-E |
Calpain Small Subunit 1 (cluster #1 Of 2), Eukaryotic |
Eukaryotes |
40 |
0.37 |
Binding ≤ 10μM |
|
Q3HTL5-1-E |
Falcipain 2B (cluster #1 Of 1), Eukaryotic |
Eukaryotes |
5000 |
0.27 |
Binding ≤ 10μM
|
|
Q9N6S8-1-E |
Falcipain 2 (cluster #1 Of 2), Eukaryotic |
Eukaryotes |
5000 |
0.27 |
Binding ≤ 10μM
|
|
CAN1-1-E |
Calpain 1 (cluster #1 Of 1), Eukaryotic |
Eukaryotes |
700 |
0.31 |
Functional ≤ 10μM
|
|
CAN2-1-E |
Calpain 2 (cluster #1 Of 1), Eukaryotic |
Eukaryotes |
700 |
0.31 |
Functional ≤ 10μM
|
|
CPNS1-1-E |
Calpain Small Subunit 1 (cluster #1 Of 1), Eukaryotic |
Eukaryotes |
700 |
0.31 |
Functional ≤ 10μM
|
|
Z100494-1-O |
C2C12 (Myoblast Cells) (cluster #1 Of 1), Other |
Other |
10000 |
0.25 |
Binding ≤ 10μM
|
|
Z50425-3-O |
Plasmodium Falciparum (cluster #3 Of 22), Other |
Other |
3981 |
0.27 |
Functional ≤ 10μM
|
Physical Representations
|
Type
pH range
|
xlogP
|
Des A‑Pol
Apolar desolvation
(kcal/mol)
|
Des Pol
Polar desolvation
(kcal/mol)
|
H Don
H-bond donors
|
H Acc
H-bond acceptors
|
Chg
Net charge
|
tPSA
(Ų)
|
MWT
Molecular weight
(g/mol)
|
RB
Rotatable bonds
|
DL |
|
Ref
Reference (pH 7)
|
5.17 |
8.75 |
-13.21 |
2 |
6 |
0 |
85 |
382.46 |
10 |
↓
|
|
|
|
Analogs
Draw
Identity
99%
90%
80%
70%
Vendors
Physical Representations
|
Type
pH range
|
xlogP
|
Des A‑Pol
Apolar desolvation
(kcal/mol)
|
Des Pol
Polar desolvation
(kcal/mol)
|
H Don
H-bond donors
|
H Acc
H-bond acceptors
|
Chg
Net charge
|
tPSA
(Ų)
|
MWT
Molecular weight
(g/mol)
|
RB
Rotatable bonds
|
DL |
|
Ref
Reference (pH 7)
|
2.72 |
-3.23 |
-54.88 |
3 |
8 |
1 |
102 |
467.619 |
6 |
↓
|
|
|
|
Analogs
-
1576130
-
Draw
Identity
99%
90%
80%
70%
Vendors
And 10 More
Clustered Target Annotations
| Code |
Organism Class |
Affinity (nM) |
LE (kcal/mol/atom) |
Type |
|
CATB-1-E |
Cathepsin B (cluster #1 Of 6), Eukaryotic |
Eukaryotes |
45 |
0.38 |
Binding ≤ 10μM |
|
CATL1-1-E |
Cathepsin L (cluster #1 Of 5), Eukaryotic |
Eukaryotes |
16 |
0.40 |
Binding ≤ 10μM |
|
CATL2-1-E |
Cathepsin L2 (cluster #1 Of 1), Eukaryotic |
Eukaryotes |
16 |
0.40 |
Binding ≤ 10μM |
Physical Representations
|
Type
pH range
|
xlogP
|
Des A‑Pol
Apolar desolvation
(kcal/mol)
|
Des Pol
Polar desolvation
(kcal/mol)
|
H Don
H-bond donors
|
H Acc
H-bond acceptors
|
Chg
Net charge
|
tPSA
(Ų)
|
MWT
Molecular weight
(g/mol)
|
RB
Rotatable bonds
|
DL |
|
Ref
Reference (pH 7)
|
2.36 |
-2.18 |
-43.82 |
2 |
7 |
-1 |
107 |
369.397 |
9 |
↓
|
|
|
|
Analogs
Draw
Identity
99%
90%
80%
70%
Vendors
Physical Representations
|
Type
pH range
|
xlogP
|
Des A‑Pol
Apolar desolvation
(kcal/mol)
|
Des Pol
Polar desolvation
(kcal/mol)
|
H Don
H-bond donors
|
H Acc
H-bond acceptors
|
Chg
Net charge
|
tPSA
(Ų)
|
MWT
Molecular weight
(g/mol)
|
RB
Rotatable bonds
|
DL |
|
Ref
Reference (pH 7)
|
3.96 |
8.66 |
-25.86 |
2 |
6 |
0 |
99 |
525.568 |
10 |
↓
|
|
|
|
|
|
|
Analogs
Draw
Identity
99%
90%
80%
70%
Vendors
Clustered Target Annotations
| Code |
Organism Class |
Affinity (nM) |
LE (kcal/mol/atom) |
Type |
|
CATB-1-E |
Cathepsin B (cluster #1 Of 6), Eukaryotic |
Eukaryotes |
680 |
0.25 |
Binding ≤ 10μM
|
|
CATL1-1-E |
Cathepsin L (cluster #1 Of 5), Eukaryotic |
Eukaryotes |
510 |
0.26 |
Binding ≤ 10μM
|
Physical Representations
|
Type
pH range
|
xlogP
|
Des A‑Pol
Apolar desolvation
(kcal/mol)
|
Des Pol
Polar desolvation
(kcal/mol)
|
H Don
H-bond donors
|
H Acc
H-bond acceptors
|
Chg
Net charge
|
tPSA
(Ų)
|
MWT
Molecular weight
(g/mol)
|
RB
Rotatable bonds
|
DL |
|
Ref
Reference (pH 7)
|
5.50 |
11.63 |
-17.98 |
2 |
6 |
0 |
85 |
462.521 |
12 |
↓
|
|
|
|
Analogs
Draw
Identity
99%
90%
80%
70%
Vendors
Physical Representations
|
Type
pH range
|
xlogP
|
Des A‑Pol
Apolar desolvation
(kcal/mol)
|
Des Pol
Polar desolvation
(kcal/mol)
|
H Don
H-bond donors
|
H Acc
H-bond acceptors
|
Chg
Net charge
|
tPSA
(Ų)
|
MWT
Molecular weight
(g/mol)
|
RB
Rotatable bonds
|
DL |
|
Ref
Reference (pH 7)
|
3.64 |
8.51 |
-21.23 |
1 |
4 |
0 |
63 |
307.349 |
2 |
↓
|
|
|
|
Analogs
-
2367730
-
Draw
Identity
99%
90%
80%
70%
Vendors
Clustered Target Annotations
| Code |
Organism Class |
Affinity (nM) |
LE (kcal/mol/atom) |
Type |
|
CATL1-5-E |
Cathepsin L (cluster #5 Of 5), Eukaryotic |
Eukaryotes |
130 |
0.32 |
Binding ≤ 10μM
|
Physical Representations
|
Type
pH range
|
xlogP
|
Des A‑Pol
Apolar desolvation
(kcal/mol)
|
Des Pol
Polar desolvation
(kcal/mol)
|
H Don
H-bond donors
|
H Acc
H-bond acceptors
|
Chg
Net charge
|
tPSA
(Ų)
|
MWT
Molecular weight
(g/mol)
|
RB
Rotatable bonds
|
DL |
|
Ref
Reference (pH 7)
|
1.28 |
-5.96 |
-53.13 |
5 |
7 |
1 |
111 |
422.534 |
8 |
↓
|
|
|
|
Analogs
Draw
Identity
99%
90%
80%
70%
Vendors
Physical Representations
|
Type
pH range
|
xlogP
|
Des A‑Pol
Apolar desolvation
(kcal/mol)
|
Des Pol
Polar desolvation
(kcal/mol)
|
H Don
H-bond donors
|
H Acc
H-bond acceptors
|
Chg
Net charge
|
tPSA
(Ų)
|
MWT
Molecular weight
(g/mol)
|
RB
Rotatable bonds
|
DL |
|
Ref
Reference (pH 7)
|
3.10 |
7.43 |
-16.98 |
2 |
7 |
0 |
100 |
401.898 |
7 |
↓
|
|
Hi
High (pH 8-9.5)
|
3.29 |
5.07 |
-42.14 |
1 |
7 |
-1 |
106 |
400.89 |
7 |
↓
|
|
|
|
Analogs
Draw
Identity
99%
90%
80%
70%
Vendors
Physical Representations
|
Type
pH range
|
xlogP
|
Des A‑Pol
Apolar desolvation
(kcal/mol)
|
Des Pol
Polar desolvation
(kcal/mol)
|
H Don
H-bond donors
|
H Acc
H-bond acceptors
|
Chg
Net charge
|
tPSA
(Ų)
|
MWT
Molecular weight
(g/mol)
|
RB
Rotatable bonds
|
DL |
|
Ref
Reference (pH 7)
|
3.30 |
9.43 |
-10.66 |
1 |
6 |
0 |
79 |
300.272 |
3 |
↓
|
|
|
|
Analogs
-
36373156
-
Draw
Identity
99%
90%
80%
70%
Vendors
Clustered Target Annotations
| Code |
Organism Class |
Affinity (nM) |
LE (kcal/mol/atom) |
Type |
|
CATK-2-E |
Cathepsin K (cluster #2 Of 3), Eukaryotic |
Eukaryotes |
51 |
0.68 |
Binding ≤ 10μM
|
|
CATL1-3-E |
Cathepsin L (cluster #3 Of 5), Eukaryotic |
Eukaryotes |
8900 |
0.47 |
Binding ≤ 10μM
|
Physical Representations
|
Type
pH range
|
xlogP
|
Des A‑Pol
Apolar desolvation
(kcal/mol)
|
Des Pol
Polar desolvation
(kcal/mol)
|
H Don
H-bond donors
|
H Acc
H-bond acceptors
|
Chg
Net charge
|
tPSA
(Ų)
|
MWT
Molecular weight
(g/mol)
|
RB
Rotatable bonds
|
DL |
|
Ref
Reference (pH 7)
|
4.68 |
4.63 |
-9.83 |
1 |
4 |
0 |
55 |
215.293 |
7 |
↓
|
|