|
|
|
|
|
Analogs
-
26392960
-
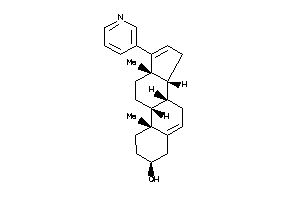
-
44830820
-
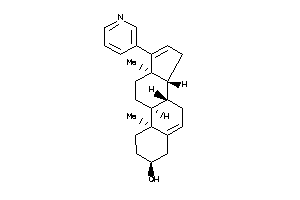
Draw
Identity
99%
90%
80%
70%
Vendors
And 14 More
Physical Representations
|
Type
pH range
|
xlogP
|
Des A‑Pol
Apolar desolvation
(kcal/mol)
|
Des Pol
Polar desolvation
(kcal/mol)
|
H Don
H-bond donors
|
H Acc
H-bond acceptors
|
Chg
Net charge
|
tPSA
(Ų)
|
MWT
Molecular weight
(g/mol)
|
RB
Rotatable bonds
|
DL |
|
Ref
Reference (pH 7)
|
4.42 |
-0.59 |
-5.05 |
1 |
2 |
0 |
33 |
349.518 |
1 |
↓
|
|
|
|
Analogs
-
643143
-
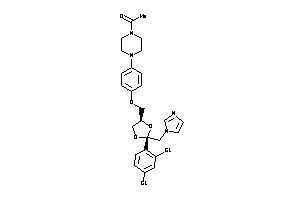
-
643153
-
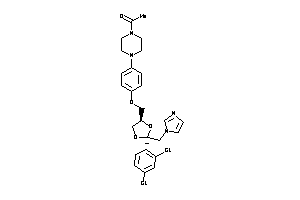
-
3872994
-
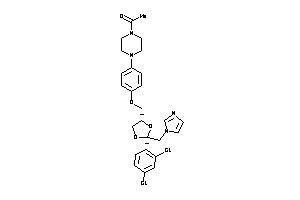
Draw
Identity
99%
90%
80%
70%
Vendors
And 7 More
Clustered Target Annotations
| Code |
Organism Class |
Affinity (nM) |
LE (kcal/mol/atom) |
Type |
|
C11B1-1-E |
Cytochrome P450 11B1 (cluster #1 Of 2), Eukaryotic |
Eukaryotes |
224 |
0.26 |
Binding ≤ 10μM
|
|
C11B2-2-E |
Cytochrome P450 11B2 (cluster #2 Of 2), Eukaryotic |
Eukaryotes |
81 |
0.28 |
Binding ≤ 10μM
|
|
CP11A-2-E |
Cytochrome P450 11A1 (cluster #2 Of 2), Eukaryotic |
Eukaryotes |
5400 |
0.20 |
Binding ≤ 10μM
|
|
CP17A-1-E |
Cytochrome P450 17A1 (cluster #1 Of 2), Eukaryotic |
Eukaryotes |
6000 |
0.20 |
Binding ≤ 10μM
|
|
CP19A-1-E |
Cytochrome P450 19A1 (cluster #1 Of 3), Eukaryotic |
Eukaryotes |
900 |
0.24 |
Binding ≤ 10μM
|
|
CP21A-1-E |
Cytochrome P450 21 (cluster #1 Of 1), Eukaryotic |
Eukaryotes |
9010 |
0.20 |
Binding ≤ 10μM
|
|
CP24A-1-E |
Cytochrome P450 24A1 (cluster #1 Of 1), Eukaryotic |
Eukaryotes |
520 |
0.24 |
Binding ≤ 10μM
|
|
CP3A4-1-E |
Cytochrome P450 3A4 (cluster #1 Of 1), Eukaryotic |
Eukaryotes |
57 |
0.28 |
Binding ≤ 10μM
|
|
CP51A-1-E |
Cytochrome P450 51 (cluster #1 Of 2), Eukaryotic |
Eukaryotes |
65 |
0.28 |
Binding ≤ 10μM
|
|
CP7A1-1-E |
Cytochrome P450 7A1 (cluster #1 Of 1), Eukaryotic |
Eukaryotes |
2400 |
0.22 |
Binding ≤ 10μM
|
|
GNRHR-1-E |
Gonadotropin-releasing Hormone Receptor (cluster #1 Of 1), Eukaryotic |
Eukaryotes |
811 |
0.24 |
Binding ≤ 10μM
|
|
KCNH2-1-E |
HERG (cluster #1 Of 5), Eukaryotic |
Eukaryotes |
5720 |
0.20 |
Binding ≤ 10μM
|
|
MDR1-2-E |
P-glycoprotein 1 (cluster #2 Of 3), Eukaryotic |
Eukaryotes |
1200 |
0.23 |
Binding ≤ 10μM
|
|
CP17A-1-E |
Cytochrome P450 17A1 (cluster #1 Of 1), Eukaryotic |
Eukaryotes |
2780 |
0.22 |
Functional ≤ 10μM
|
|
MDR1-1-E |
P-glycoprotein 1 (cluster #1 Of 2), Eukaryotic |
Eukaryotes |
4800 |
0.21 |
Functional ≤ 10μM
|
|
MDR3-1-E |
P-glycoprotein 3 (cluster #1 Of 2), Eukaryotic |
Eukaryotes |
3800 |
0.21 |
Functional ≤ 10μM
|
|
CP24A-1-E |
Cytochrome P450 24A1 (cluster #1 Of 2), Eukaryotic |
Eukaryotes |
520 |
0.24 |
ADME/T ≤ 10μM |
|
CP2A2-1-E |
Cytochrome P450 2A2 (cluster #1 Of 1), Eukaryotic |
Eukaryotes |
543 |
0.24 |
ADME/T ≤ 10μM
|
|
CP3A4-2-E |
Cytochrome P450 3A4 (cluster #2 Of 4), Eukaryotic |
Eukaryotes |
786 |
0.24 |
ADME/T ≤ 10μM
|
|
Z102121-2-O |
Trichophyton Mentagrophytes (cluster #2 Of 3), Other |
Other |
200 |
0.26 |
Functional ≤ 10μM
|
|
Z50274-1-O |
Aspergillus Flavus (cluster #1 Of 2), Other |
Other |
2800 |
0.22 |
Functional ≤ 10μM
|
|
Z50275-1-O |
Aspergillus Niger (cluster #1 Of 2), Other |
Other |
6000 |
0.20 |
Functional ≤ 10μM
|
|
Z50408-1-O |
Issatchenkia Orientalis (cluster #1 Of 2), Other |
Other |
400 |
0.25 |
Functional ≤ 10μM
|
|
Z50416-1-O |
Aspergillus Fumigatus (cluster #1 Of 3), Other |
Other |
3200 |
0.21 |
Functional ≤ 10μM
|
|
Z50425-3-O |
Plasmodium Falciparum (cluster #3 Of 22), Other |
Other |
7943 |
0.20 |
Functional ≤ 10μM
|
|
Z50436-1-O |
Filobasidiella Neoformans (cluster #1 Of 3), Other |
Other |
20 |
0.30 |
Functional ≤ 10μM
|
|
Z50442-1-O |
Candida Albicans (cluster #1 Of 4), Other |
Other |
300 |
0.25 |
Functional ≤ 10μM
|
|
Z50443-1-O |
Candida Glabrata (cluster #1 Of 1), Other |
Other |
700 |
0.24 |
Functional ≤ 10μM
|
|
Z50444-1-O |
Candida Parapsilosis (cluster #1 Of 2), Other |
Other |
40 |
0.29 |
Functional ≤ 10μM
|
|
Z50446-1-O |
Candida Tropicalis (cluster #1 Of 2), Other |
Other |
40 |
0.29 |
Functional ≤ 10μM
|
|
Z50452-1-O |
Trichophyton Rubrum (cluster #1 Of 2), Other |
Other |
20 |
0.30 |
Functional ≤ 10μM
|
|
Z50459-1-O |
Leishmania Donovani (cluster #1 Of 8), Other |
Other |
2000 |
0.22 |
Functional ≤ 10μM
|
|
Z50466-4-O |
Trypanosoma Cruzi (cluster #4 Of 8), Other |
Other |
9800 |
0.19 |
Functional ≤ 10μM
|
|
Z50587-1-O |
Homo Sapiens (cluster #1 Of 9), Other |
Other |
37 |
0.29 |
Functional ≤ 10μM
|
Physical Representations
|
Type
pH range
|
xlogP
|
Des A‑Pol
Apolar desolvation
(kcal/mol)
|
Des Pol
Polar desolvation
(kcal/mol)
|
H Don
H-bond donors
|
H Acc
H-bond acceptors
|
Chg
Net charge
|
tPSA
(Ų)
|
MWT
Molecular weight
(g/mol)
|
RB
Rotatable bonds
|
DL |
|
Ref
Reference (pH 7)
|
3.77 |
12.55 |
-49.34 |
1 |
8 |
1 |
70 |
532.448 |
7 |
↓
|
|
|
|
Analogs
Draw
Identity
99%
90%
80%
70%
Vendors
And 34 More
Clustered Target Annotations
| Code |
Organism Class |
Affinity (nM) |
LE (kcal/mol/atom) |
Type |
|
CP3A4-1-E |
Cytochrome P450 3A4 (cluster #1 Of 4), Eukaryotic |
Eukaryotes |
450 |
0.89 |
ADME/T ≤ 10μM
|
Physical Representations
|
Type
pH range
|
xlogP
|
Des A‑Pol
Apolar desolvation
(kcal/mol)
|
Des Pol
Polar desolvation
(kcal/mol)
|
H Don
H-bond donors
|
H Acc
H-bond acceptors
|
Chg
Net charge
|
tPSA
(Ų)
|
MWT
Molecular weight
(g/mol)
|
RB
Rotatable bonds
|
DL |
|
Ref
Reference (pH 7)
|
0.74 |
1.25 |
-26.03 |
3 |
4 |
1 |
58 |
135.15 |
0 |
↓
|
|
Mid
Mid (pH 6-8)
|
0.74 |
1.1 |
-8.26 |
2 |
4 |
0 |
57 |
134.142 |
0 |
↓
|
|
|
|
Analogs
-
5932901
-
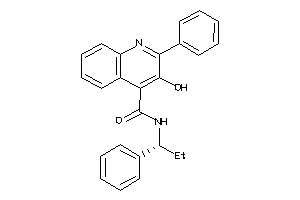
Draw
Identity
99%
90%
80%
70%
Vendors
Clustered Target Annotations
| Code |
Organism Class |
Affinity (nM) |
LE (kcal/mol/atom) |
Type |
|
NK2R-1-E |
Neurokinin 2 Receptor (cluster #1 Of 1), Eukaryotic |
Eukaryotes |
3700 |
0.26 |
Binding ≤ 10μM
|
|
NK3R-1-E |
Neurokinin 3 Receptor (cluster #1 Of 1), Eukaryotic |
Eukaryotes |
3 |
0.41 |
Binding ≤ 10μM
|
|
NK3R-1-E |
Neurokinin 3 Receptor (cluster #1 Of 1), Eukaryotic |
Eukaryotes |
5 |
0.40 |
Binding ≤ 10μM
|
|
OPRM-1-E |
Mu-type Opioid Receptor (cluster #1 Of 4), Eukaryotic |
Eukaryotes |
1860 |
0.28 |
Binding ≤ 10μM
|
|
NK3R-1-E |
Neurokinin 3 Receptor (cluster #1 Of 1), Eukaryotic |
Eukaryotes |
6 |
0.40 |
Functional ≤ 10μM
|
|
CP1A2-1-E |
Cytochrome P450 1A2 (cluster #1 Of 3), Eukaryotic |
Eukaryotes |
5000 |
0.26 |
ADME/T ≤ 10μM
|
|
CP2C9-1-E |
Cytochrome P450 2C9 (cluster #1 Of 3), Eukaryotic |
Eukaryotes |
2000 |
0.28 |
ADME/T ≤ 10μM
|
|
CP2CJ-1-E |
Cytochrome P450 2C19 (cluster #1 Of 3), Eukaryotic |
Eukaryotes |
9000 |
0.24 |
ADME/T ≤ 10μM
|
|
CP3A4-2-E |
Cytochrome P450 3A4 (cluster #2 Of 4), Eukaryotic |
Eukaryotes |
4000 |
0.26 |
ADME/T ≤ 10μM
|
|
Z50593-1-O |
Gerbillinae (cluster #1 Of 1), Other |
Other |
20 |
0.37 |
Functional ≤ 10μM
|
Physical Representations
|
Type
pH range
|
xlogP
|
Des A‑Pol
Apolar desolvation
(kcal/mol)
|
Des Pol
Polar desolvation
(kcal/mol)
|
H Don
H-bond donors
|
H Acc
H-bond acceptors
|
Chg
Net charge
|
tPSA
(Ų)
|
MWT
Molecular weight
(g/mol)
|
RB
Rotatable bonds
|
DL |
|
Ref
Reference (pH 7)
|
4.53 |
-2.05 |
-11.14 |
2 |
4 |
0 |
62 |
382.463 |
5 |
↓
|
|
|
|
Analogs
Draw
Identity
99%
90%
80%
70%
Vendors
And 27 More
Clustered Target Annotations
| Code |
Organism Class |
Affinity (nM) |
LE (kcal/mol/atom) |
Type |
|
AMPC-1-B |
Beta-lactamase (cluster #1 Of 6), Bacterial |
Bacteria |
6 |
0.46 |
Binding ≤ 10μM
|
|
CP51-1-B |
Sterol 14-alpha Demethylase (cluster #1 Of 2), Bacterial |
Bacteria |
200 |
0.38 |
Binding ≤ 10μM
|
|
CP17A-1-E |
Cytochrome P450 17A1 (cluster #1 Of 2), Eukaryotic |
Eukaryotes |
82 |
0.40 |
Binding ≤ 10μM
|
|
CP19A-3-E |
Cytochrome P450 19A1 (cluster #3 Of 3), Eukaryotic |
Eukaryotes |
2 |
0.49 |
Binding ≤ 10μM
|
|
CP51A-1-E |
Cytochrome P450 51 (cluster #1 Of 2), Eukaryotic |
Eukaryotes |
130 |
0.39 |
Binding ≤ 10μM
|
|
KCNA3-1-E |
Voltage-gated Potassium Channel Subunit Kv1.3 (cluster #1 Of 3), Eukaryotic |
Eukaryotes |
6000 |
0.29 |
Binding ≤ 10μM
|
|
KCNH2-5-E |
HERG (cluster #5 Of 5), Eukaryotic |
Eukaryotes |
3020 |
0.31 |
Binding ≤ 10μM
|
|
KCNN4-1-E |
Intermediate Conductance Calcium-activated Potassium Channel Protein 4 (cluster #1 Of 2), Eukaryotic |
Eukaryotes |
70 |
0.40 |
Binding ≤ 10μM
|
|
MDHM-1-E |
Malate Dehydrogenase, Mitochondrial (cluster #1 Of 2), Eukaryotic |
Eukaryotes |
2 |
0.49 |
Binding ≤ 10μM
|
|
MDR1-1-E |
P-glycoprotein 1 (cluster #1 Of 2), Eukaryotic |
Eukaryotes |
6700 |
0.29 |
Functional ≤ 10μM
|
|
MDR3-1-E |
P-glycoprotein 3 (cluster #1 Of 2), Eukaryotic |
Eukaryotes |
4800 |
0.30 |
Functional ≤ 10μM
|
|
CP3A4-2-E |
Cytochrome P450 3A4 (cluster #2 Of 4), Eukaryotic |
Eukaryotes |
50 |
0.41 |
ADME/T ≤ 10μM
|
|
Q96W81-1-F |
14-alpha Sterol Demethylase (cluster #1 Of 1), Fungal |
Fungi |
103 |
0.39 |
Binding ≤ 10μM
|
|
Q4WNT5-1-O |
14-alpha Sterol Demethylase Cyp51A (cluster #1 Of 1), Other |
Other |
4790 |
0.30 |
Binding ≤ 10μM
|
|
Z50380-1-O |
Mycobacterium Smegmatis (cluster #1 Of 4), Other |
Other |
6540 |
0.29 |
Functional ≤ 10μM
|
|
Z50425-9-O |
Plasmodium Falciparum (cluster #9 Of 22), Other |
Other |
60 |
0.40 |
Functional ≤ 10μM
|
|
Z50426-1-O |
Plasmodium Falciparum (isolate K1 / Thailand) (cluster #1 Of 9), Other |
Other |
250 |
0.37 |
Functional ≤ 10μM
|
|
Z80682-8-O |
A549 (Lung Carcinoma Cells) (cluster #8 Of 11), Other |
Other |
5100 |
0.30 |
Functional ≤ 10μM
|
|
Z80951-2-O |
NIH3T3 (Fibroblasts) (cluster #2 Of 4), Other |
Other |
630 |
0.35 |
Functional ≤ 10μM
|
|
Z80936-1-O |
HEK293 (Embryonic Kidney Fibroblasts) (cluster #1 Of 4), Other |
Other |
3000 |
0.31 |
ADME/T ≤ 10μM
|
Physical Representations
|
Type
pH range
|
xlogP
|
Des A‑Pol
Apolar desolvation
(kcal/mol)
|
Des Pol
Polar desolvation
(kcal/mol)
|
H Don
H-bond donors
|
H Acc
H-bond acceptors
|
Chg
Net charge
|
tPSA
(Ų)
|
MWT
Molecular weight
(g/mol)
|
RB
Rotatable bonds
|
DL |
|
Ref
Reference (pH 7)
|
5.47 |
13.43 |
-5.78 |
0 |
2 |
0 |
18 |
344.845 |
4 |
↓
|
|
Mid
Mid (pH 6-8)
|
5.47 |
13.99 |
-28.18 |
1 |
2 |
1 |
19 |
345.853 |
4 |
↓
|
|
|
|
Analogs
Draw
Identity
99%
90%
80%
70%
Vendors
And 34 More
Clustered Target Annotations
| Code |
Organism Class |
Affinity (nM) |
LE (kcal/mol/atom) |
Type |
|
ABCC9-1-E |
Sulfonylurea Receptor 2 (cluster #1 Of 2), Eukaryotic |
Eukaryotes |
8 |
0.37 |
Binding ≤ 10μM
|
|
IRK11-1-E |
Potassium Channel, Inwardly Rectifying, Subfamily J, Member 11 (cluster #1 Of 2), Eukaryotic |
Eukaryotes |
8 |
0.37 |
Binding ≤ 10μM
|
|
IRK8-1-E |
Potassium Channel, Inwardly Rectifying, Subfamily J, Member 8 (cluster #1 Of 1), Eukaryotic |
Eukaryotes |
8 |
0.37 |
Binding ≤ 10μM
|
|
KCND3-1-E |
Voltage-gated Potassium Channel Subunit Kv4.3 (cluster #1 Of 1), Eukaryotic |
Eukaryotes |
8 |
0.37 |
Binding ≤ 10μM
|
|
CP3A4-2-E |
Cytochrome P450 3A4 (cluster #2 Of 4), Eukaryotic |
Eukaryotes |
7447 |
0.23 |
ADME/T ≤ 10μM
|
Physical Representations
|
Type
pH range
|
xlogP
|
Des A‑Pol
Apolar desolvation
(kcal/mol)
|
Des Pol
Polar desolvation
(kcal/mol)
|
H Don
H-bond donors
|
H Acc
H-bond acceptors
|
Chg
Net charge
|
tPSA
(Ų)
|
MWT
Molecular weight
(g/mol)
|
RB
Rotatable bonds
|
DL |
|
Ref
Reference (pH 7)
|
1.94 |
1.45 |
-65.23 |
2 |
9 |
-1 |
136 |
444.537 |
8 |
↓
|
|
Ref
Reference (pH 7)
|
1.94 |
0.9 |
-22.02 |
3 |
9 |
0 |
134 |
445.545 |
8 |
↓
|
|
Lo
Low (pH 4.5-6)
|
2.31 |
3.39 |
-20.04 |
3 |
9 |
0 |
130 |
445.545 |
7 |
↓
|
|
|
|
Analogs
Draw
Identity
99%
90%
80%
70%
Vendors
Clustered Target Annotations
| Code |
Organism Class |
Affinity (nM) |
LE (kcal/mol/atom) |
Type |
|
CP2CJ-1-E |
Cytochrome P450 2C19 (cluster #1 Of 3), Eukaryotic |
Eukaryotes |
1800 |
0.38 |
ADME/T ≤ 10μM
|
|
CP2D6-1-E |
Cytochrome P450 2D6 (cluster #1 Of 3), Eukaryotic |
Eukaryotes |
100 |
0.47 |
ADME/T ≤ 10μM
|
|
CP3A4-2-E |
Cytochrome P450 3A4 (cluster #2 Of 4), Eukaryotic |
Eukaryotes |
9600 |
0.33 |
ADME/T ≤ 10μM
|
Physical Representations
|
Type
pH range
|
xlogP
|
Des A‑Pol
Apolar desolvation
(kcal/mol)
|
Des Pol
Polar desolvation
(kcal/mol)
|
H Don
H-bond donors
|
H Acc
H-bond acceptors
|
Chg
Net charge
|
tPSA
(Ų)
|
MWT
Molecular weight
(g/mol)
|
RB
Rotatable bonds
|
DL |
|
Ref
Reference (pH 7)
|
3.84 |
9.12 |
-28.34 |
3 |
3 |
1 |
42 |
280.395 |
3 |
↓
|
|
Hi
High (pH 8-9.5)
|
3.84 |
8.76 |
-6.72 |
2 |
3 |
0 |
41 |
279.387 |
3 |
↓
|
|
|
|
Analogs
Draw
Identity
99%
90%
80%
70%
Vendors
Clustered Target Annotations
| Code |
Organism Class |
Affinity (nM) |
LE (kcal/mol/atom) |
Type |
|
CP2B1-1-E |
Cytochrome P450 2B1 (cluster #1 Of 2), Eukaryotic |
Eukaryotes |
2400 |
0.31 |
ADME/T ≤ 10μM
|
|
CP2B4-1-E |
Cytochrome P450 2B4 (cluster #1 Of 1), Eukaryotic |
Eukaryotes |
2800 |
0.31 |
ADME/T ≤ 10μM
|
|
CP2B6-1-E |
Cytochrome P450 2B6 (cluster #1 Of 4), Eukaryotic |
Eukaryotes |
5200 |
0.30 |
ADME/T ≤ 10μM
|
|
CP3A4-2-E |
Cytochrome P450 3A4 (cluster #2 Of 4), Eukaryotic |
Eukaryotes |
7700 |
0.29 |
ADME/T ≤ 10μM
|
Physical Representations
|
Type
pH range
|
xlogP
|
Des A‑Pol
Apolar desolvation
(kcal/mol)
|
Des Pol
Polar desolvation
(kcal/mol)
|
H Don
H-bond donors
|
H Acc
H-bond acceptors
|
Chg
Net charge
|
tPSA
(Ų)
|
MWT
Molecular weight
(g/mol)
|
RB
Rotatable bonds
|
DL |
|
Ref
Reference (pH 7)
|
5.80 |
12.27 |
-9.52 |
0 |
4 |
0 |
53 |
338.403 |
6 |
↓
|
|
|
|
Analogs
Draw
Identity
99%
90%
80%
70%
Vendors
And 1 More
Clustered Target Annotations
| Code |
Organism Class |
Affinity (nM) |
LE (kcal/mol/atom) |
Type |
|
CP3A4-2-E |
Cytochrome P450 3A4 (cluster #2 Of 4), Eukaryotic |
Eukaryotes |
1580 |
0.30 |
ADME/T ≤ 10μM
|
|
CP3A4-2-E |
Cytochrome P450 3A4 (cluster #2 Of 4), Eukaryotic |
Eukaryotes |
5560 |
0.27 |
ADME/T ≤ 10μM
|
Physical Representations
|
Type
pH range
|
xlogP
|
Des A‑Pol
Apolar desolvation
(kcal/mol)
|
Des Pol
Polar desolvation
(kcal/mol)
|
H Don
H-bond donors
|
H Acc
H-bond acceptors
|
Chg
Net charge
|
tPSA
(Ų)
|
MWT
Molecular weight
(g/mol)
|
RB
Rotatable bonds
|
DL |
|
Ref
Reference (pH 7)
|
3.42 |
6.04 |
-11.73 |
2 |
6 |
0 |
93 |
372.417 |
7 |
↓
|
|
|
|
|
|
|
Analogs
Draw
Identity
99%
90%
80%
70%
Vendors
Clustered Target Annotations
| Code |
Organism Class |
Affinity (nM) |
LE (kcal/mol/atom) |
Type |
|
CP3A4-2-E |
Cytochrome P450 3A4 (cluster #2 Of 4), Eukaryotic |
Eukaryotes |
1200 |
0.31 |
ADME/T ≤ 10μM
|
Physical Representations
|
Type
pH range
|
xlogP
|
Des A‑Pol
Apolar desolvation
(kcal/mol)
|
Des Pol
Polar desolvation
(kcal/mol)
|
H Don
H-bond donors
|
H Acc
H-bond acceptors
|
Chg
Net charge
|
tPSA
(Ų)
|
MWT
Molecular weight
(g/mol)
|
RB
Rotatable bonds
|
DL |
|
Ref
Reference (pH 7)
|
3.45 |
7.08 |
-12.03 |
0 |
4 |
0 |
60 |
412.841 |
2 |
↓
|
|
|
|
Analogs
Draw
Identity
99%
90%
80%
70%
Popular Name:
(6aR,8S,10aS)-10a-((4-Chlorophenyl)sulfonyl)-1,4-difluoro-6a,7,8,9,10,10a-hexahydro-6H-benzo[c]chromen-8-ol
(6aR,8S,10aS)-10a-((4-Chlorophen…
Find On:
PubMed —
Wikipedia —
Google
Vendors
And 2 More
Clustered Target Annotations
| Code |
Organism Class |
Affinity (nM) |
LE (kcal/mol/atom) |
Type |
|
CP3A4-2-E |
Cytochrome P450 3A4 (cluster #2 Of 4), Eukaryotic |
Eukaryotes |
9100 |
0.26 |
ADME/T ≤ 10μM
|
Physical Representations
|
Type
pH range
|
xlogP
|
Des A‑Pol
Apolar desolvation
(kcal/mol)
|
Des Pol
Polar desolvation
(kcal/mol)
|
H Don
H-bond donors
|
H Acc
H-bond acceptors
|
Chg
Net charge
|
tPSA
(Ų)
|
MWT
Molecular weight
(g/mol)
|
RB
Rotatable bonds
|
DL |
|
Ref
Reference (pH 7)
|
3.64 |
4.61 |
-11.73 |
1 |
4 |
0 |
64 |
414.857 |
2 |
↓
|
|
|
|
Analogs
Draw
Identity
99%
90%
80%
70%
Popular Name:
(6aR,8S,10aS)-10a-((4-Chlorophenyl)sulfonyl)-1,4-difluoro-6a,7,8,9,10,10a-hexahydro-6H-benzo[c]chromen-8-ol
(6aR,8S,10aS)-10a-((4-Chlorophen…
Find On:
PubMed —
Wikipedia —
Google
Vendors
Clustered Target Annotations
| Code |
Organism Class |
Affinity (nM) |
LE (kcal/mol/atom) |
Type |
|
CP3A4-2-E |
Cytochrome P450 3A4 (cluster #2 Of 4), Eukaryotic |
Eukaryotes |
9100 |
0.26 |
ADME/T ≤ 10μM
|
Physical Representations
|
Type
pH range
|
xlogP
|
Des A‑Pol
Apolar desolvation
(kcal/mol)
|
Des Pol
Polar desolvation
(kcal/mol)
|
H Don
H-bond donors
|
H Acc
H-bond acceptors
|
Chg
Net charge
|
tPSA
(Ų)
|
MWT
Molecular weight
(g/mol)
|
RB
Rotatable bonds
|
DL |
|
Ref
Reference (pH 7)
|
3.64 |
4.96 |
-12.6 |
1 |
4 |
0 |
64 |
414.857 |
2 |
↓
|
|
|
|
Analogs
Draw
Identity
99%
90%
80%
70%
Popular Name:
(6aR,8S,10aS)-10a-((4-Chlorophenyl)sulfonyl)-1,4-difluoro-6a,7,8,9,10,10a-hexahydro-6H-benzo[c]chromen-8-ol
(6aR,8S,10aS)-10a-((4-Chlorophen…
Find On:
PubMed —
Wikipedia —
Google
Vendors
Clustered Target Annotations
| Code |
Organism Class |
Affinity (nM) |
LE (kcal/mol/atom) |
Type |
|
CP3A4-2-E |
Cytochrome P450 3A4 (cluster #2 Of 4), Eukaryotic |
Eukaryotes |
9100 |
0.26 |
ADME/T ≤ 10μM
|
Physical Representations
|
Type
pH range
|
xlogP
|
Des A‑Pol
Apolar desolvation
(kcal/mol)
|
Des Pol
Polar desolvation
(kcal/mol)
|
H Don
H-bond donors
|
H Acc
H-bond acceptors
|
Chg
Net charge
|
tPSA
(Ų)
|
MWT
Molecular weight
(g/mol)
|
RB
Rotatable bonds
|
DL |
|
Ref
Reference (pH 7)
|
3.64 |
4.76 |
-11.23 |
1 |
4 |
0 |
64 |
414.857 |
2 |
↓
|
|
|
|
Analogs
Draw
Identity
99%
90%
80%
70%
Popular Name:
(6aR,8S,10aS)-10a-((4-Chlorophenyl)sulfonyl)-1,4-difluoro-6a,7,8,9,10,10a-hexahydro-6H-benzo[c]chromen-8-ol
(6aR,8S,10aS)-10a-((4-Chlorophen…
Find On:
PubMed —
Wikipedia —
Google
Vendors
Clustered Target Annotations
| Code |
Organism Class |
Affinity (nM) |
LE (kcal/mol/atom) |
Type |
|
CP3A4-2-E |
Cytochrome P450 3A4 (cluster #2 Of 4), Eukaryotic |
Eukaryotes |
9100 |
0.26 |
ADME/T ≤ 10μM
|
Physical Representations
|
Type
pH range
|
xlogP
|
Des A‑Pol
Apolar desolvation
(kcal/mol)
|
Des Pol
Polar desolvation
(kcal/mol)
|
H Don
H-bond donors
|
H Acc
H-bond acceptors
|
Chg
Net charge
|
tPSA
(Ų)
|
MWT
Molecular weight
(g/mol)
|
RB
Rotatable bonds
|
DL |
|
Ref
Reference (pH 7)
|
3.64 |
5.1 |
-10.98 |
1 |
4 |
0 |
64 |
414.857 |
2 |
↓
|
|
|
|
Analogs
Draw
Identity
99%
90%
80%
70%
Vendors
Physical Representations
|
Type
pH range
|
xlogP
|
Des A‑Pol
Apolar desolvation
(kcal/mol)
|
Des Pol
Polar desolvation
(kcal/mol)
|
H Don
H-bond donors
|
H Acc
H-bond acceptors
|
Chg
Net charge
|
tPSA
(Ų)
|
MWT
Molecular weight
(g/mol)
|
RB
Rotatable bonds
|
DL |
|
Ref
Reference (pH 7)
|
6.28 |
10.22 |
-11.61 |
2 |
6 |
0 |
80 |
541.866 |
4 |
↓
|
|
|
|
Analogs
Draw
Identity
99%
90%
80%
70%
Vendors
And 21 More
Physical Representations
|
Type
pH range
|
xlogP
|
Des A‑Pol
Apolar desolvation
(kcal/mol)
|
Des Pol
Polar desolvation
(kcal/mol)
|
H Don
H-bond donors
|
H Acc
H-bond acceptors
|
Chg
Net charge
|
tPSA
(Ų)
|
MWT
Molecular weight
(g/mol)
|
RB
Rotatable bonds
|
DL |
|
Ref
Reference (pH 7)
|
1.25 |
8.94 |
-44.5 |
2 |
5 |
1 |
55 |
295.366 |
2 |
↓
|
|
Ref
Reference (pH 7)
|
1.25 |
8.94 |
-43.84 |
2 |
5 |
1 |
55 |
295.366 |
2 |
↓
|
|
Mid
Mid (pH 6-8)
|
1.25 |
8.47 |
-18.57 |
1 |
5 |
0 |
54 |
294.358 |
2 |
↓
|
|
|
|
Analogs
Draw
Identity
99%
90%
80%
70%
Vendors
Physical Representations
|
Type
pH range
|
xlogP
|
Des A‑Pol
Apolar desolvation
(kcal/mol)
|
Des Pol
Polar desolvation
(kcal/mol)
|
H Don
H-bond donors
|
H Acc
H-bond acceptors
|
Chg
Net charge
|
tPSA
(Ų)
|
MWT
Molecular weight
(g/mol)
|
RB
Rotatable bonds
|
DL |
|
Ref
Reference (pH 7)
|
2.91 |
11.58 |
-40.63 |
1 |
4 |
1 |
31 |
288.415 |
9 |
↓
|
|
|
|
Analogs
Draw
Identity
99%
90%
80%
70%
Vendors
Clustered Target Annotations
| Code |
Organism Class |
Affinity (nM) |
LE (kcal/mol/atom) |
Type |
|
MDR1-2-E |
P-glycoprotein 1 (cluster #2 Of 2), Eukaryotic |
Eukaryotes |
1600 |
0.17 |
Functional ≤ 10μM
|
|
CP3A4-2-E |
Cytochrome P450 3A4 (cluster #2 Of 4), Eukaryotic |
Eukaryotes |
170 |
0.19 |
ADME/T ≤ 10μM
|
|
Z50658-1-O |
Human Immunodeficiency Virus 2 (cluster #1 Of 1), Other |
Other |
1 |
0.26 |
Binding ≤ 10μM
|
|
Z102015-1-O |
Plasmodium Vivax (cluster #1 Of 1), Other |
Other |
4230 |
0.15 |
Functional ≤ 10μM
|
|
Z50038-1-O |
Plasmodium Yoelii Yoelii (cluster #1 Of 2), Other |
Other |
35 |
0.21 |
Functional ≤ 10μM
|
|
Z50425-3-O |
Plasmodium Falciparum (cluster #3 Of 22), Other |
Other |
960 |
0.17 |
Functional ≤ 10μM
|
|
Z50607-1-O |
Human Immunodeficiency Virus 1 (cluster #1 Of 10), Other |
Other |
97 |
0.20 |
Functional ≤ 10μM
|
|
Z50614-1-O |
Human T-lymphotropic Virus 1 (cluster #1 Of 1), Other |
Other |
18 |
0.22 |
Functional ≤ 10μM
|
|
Z50658-3-O |
Human Immunodeficiency Virus 2 (cluster #3 Of 4), Other |
Other |
90 |
0.20 |
Functional ≤ 10μM
|
|
Z50677-1-O |
Human Immunodeficiency Virus (cluster #1 Of 3), Other |
Other |
2 |
0.25 |
Functional ≤ 10μM |
|
Z80052-1-O |
C8166 (Leukemic T-cells) (cluster #1 Of 3), Other |
Other |
2 |
0.25 |
Functional ≤ 10μM
|
|
Z80076-3-O |
CEM-SS (T-cell Leukemia) (cluster #3 Of 5), Other |
Other |
7 |
0.23 |
Functional ≤ 10μM |
|
Z80294-1-O |
MT2 (Lymphocytes) (cluster #1 Of 1), Other |
Other |
5 |
0.24 |
Functional ≤ 10μM |
|
Z80295-1-O |
MT4 (Lymphocytes) (cluster #1 Of 8), Other |
Other |
80 |
0.20 |
Functional ≤ 10μM
|
|
Z80516-1-O |
SUP-T1 (cluster #1 Of 1), Other |
Other |
20 |
0.22 |
Functional ≤ 10μM |
|
Z80874-1-O |
CEM (T-cell Leukemia) (cluster #1 Of 7), Other |
Other |
2 |
0.25 |
Functional ≤ 10μM |
|
Z80897-1-O |
H9 (T-lymphoid Cells) (cluster #1 Of 2), Other |
Other |
20 |
0.22 |
Functional ≤ 10μM |
|
P88142-1-V |
Human Immunodeficiency Virus Type 2 Pol Protein (cluster #1 Of 1), Viral |
Viruses |
1 |
0.26 |
Binding ≤ 10μM
|
|
Q4U254-2-V |
Human Rhinovirus A Protease (cluster #2 Of 3), Viral |
Viruses |
1 |
0.26 |
Binding ≤ 10μM
|
|
Q72874-1-V |
Human Immunodeficiency Virus Type 1 Protease (cluster #1 Of 3), Viral |
Viruses |
1 |
0.26 |
Binding ≤ 10μM |
Physical Representations
|
Type
pH range
|
xlogP
|
Des A‑Pol
Apolar desolvation
(kcal/mol)
|
Des Pol
Polar desolvation
(kcal/mol)
|
H Don
H-bond donors
|
H Acc
H-bond acceptors
|
Chg
Net charge
|
tPSA
(Ų)
|
MWT
Molecular weight
(g/mol)
|
RB
Rotatable bonds
|
DL |
|
Ref
Reference (pH 7)
|
4.26 |
-7.47 |
-55.36 |
7 |
11 |
1 |
167 |
671.863 |
13 |
↓
|
|
|
|
Analogs
Draw
Identity
99%
90%
80%
70%
Vendors
And 2 More
Clustered Target Annotations
| Code |
Organism Class |
Affinity (nM) |
LE (kcal/mol/atom) |
Type |
|
CP3A4-2-E |
Cytochrome P450 3A4 (cluster #2 Of 4), Eukaryotic |
Eukaryotes |
480 |
0.20 |
ADME/T ≤ 10μM
|
|
Z100081-2-O |
PBMC (Peripheral Blood Mononuclear Cells) (cluster #2 Of 4), Other |
Other |
3000 |
0.17 |
Functional ≤ 10μM
|
|
Z101839-1-O |
HIV-1 M:B_Lai (cluster #1 Of 1), Other |
Other |
9 |
0.25 |
Functional ≤ 10μM
|
|
Z50038-1-O |
Plasmodium Yoelii Yoelii (cluster #1 Of 2), Other |
Other |
5000 |
0.16 |
Functional ≤ 10μM
|
|
Z50607-1-O |
Human Immunodeficiency Virus 1 (cluster #1 Of 10), Other |
Other |
9 |
0.25 |
Functional ≤ 10μM
|
|
Z50614-1-O |
Human T-lymphotropic Virus 1 (cluster #1 Of 1), Other |
Other |
22 |
0.24 |
Functional ≤ 10μM
|
|
Z50658-3-O |
Human Immunodeficiency Virus 2 (cluster #3 Of 4), Other |
Other |
825 |
0.19 |
Functional ≤ 10μM
|
|
Z50677-1-O |
Human Immunodeficiency Virus (cluster #1 Of 3), Other |
Other |
50 |
0.23 |
Functional ≤ 10μM
|
|
Z80295-1-O |
MT4 (Lymphocytes) (cluster #1 Of 8), Other |
Other |
50 |
0.23 |
Functional ≤ 10μM
|
|
Q4U254-2-V |
Human Rhinovirus A Protease (cluster #2 Of 3), Viral |
Viruses |
3 |
0.27 |
Binding ≤ 10μM
|
|
Q72874-1-V |
Human Immunodeficiency Virus Type 1 Protease (cluster #1 Of 3), Viral |
Viruses |
0 |
0.00 |
Binding ≤ 10μM
|
Physical Representations
|
Type
pH range
|
xlogP
|
Des A‑Pol
Apolar desolvation
(kcal/mol)
|
Des Pol
Polar desolvation
(kcal/mol)
|
H Don
H-bond donors
|
H Acc
H-bond acceptors
|
Chg
Net charge
|
tPSA
(Ų)
|
MWT
Molecular weight
(g/mol)
|
RB
Rotatable bonds
|
DL |
|
Ref
Reference (pH 7)
|
2.51 |
6.19 |
-23.76 |
4 |
9 |
0 |
118 |
613.803 |
12 |
↓
|
|
Mid
Mid (pH 6-8)
|
2.51 |
8.52 |
-69.54 |
5 |
9 |
1 |
119 |
614.811 |
12 |
↓
|
|
|
|
Analogs
-
44135764
-
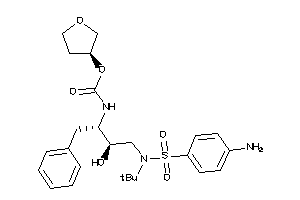
Draw
Identity
99%
90%
80%
70%
Vendors
And 13 More
Physical Representations
|
Type
pH range
|
xlogP
|
Des A‑Pol
Apolar desolvation
(kcal/mol)
|
Des Pol
Polar desolvation
(kcal/mol)
|
H Don
H-bond donors
|
H Acc
H-bond acceptors
|
Chg
Net charge
|
tPSA
(Ų)
|
MWT
Molecular weight
(g/mol)
|
RB
Rotatable bonds
|
DL |
|
Ref
Reference (pH 7)
|
4.13 |
4.23 |
-14.86 |
4 |
9 |
0 |
131 |
505.637 |
12 |
↓
|
|
|
|
Analogs
Draw
Identity
99%
90%
80%
70%
Vendors
And 1 More
Clustered Target Annotations
| Code |
Organism Class |
Affinity (nM) |
LE (kcal/mol/atom) |
Type |
|
CP3A4-2-E |
Cytochrome P450 3A4 (cluster #2 Of 4), Eukaryotic |
Eukaryotes |
10000 |
0.29 |
ADME/T ≤ 10μM
|
Physical Representations
|
Type
pH range
|
xlogP
|
Des A‑Pol
Apolar desolvation
(kcal/mol)
|
Des Pol
Polar desolvation
(kcal/mol)
|
H Don
H-bond donors
|
H Acc
H-bond acceptors
|
Chg
Net charge
|
tPSA
(Ų)
|
MWT
Molecular weight
(g/mol)
|
RB
Rotatable bonds
|
DL |
|
Ref
Reference (pH 7)
|
2.43 |
-3.12 |
-12.07 |
1 |
4 |
0 |
50 |
341.773 |
2 |
↓
|
|
|
|
Analogs
-
3814382
-
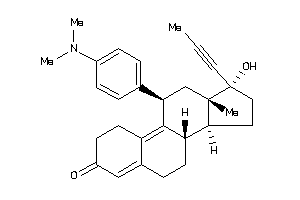
Draw
Identity
99%
90%
80%
70%
Vendors
Clustered Target Annotations
| Code |
Organism Class |
Affinity (nM) |
LE (kcal/mol/atom) |
Type |
|
ANDR-2-E |
Androgen Receptor (cluster #2 Of 4), Eukaryotic |
Eukaryotes |
89 |
0.31 |
Binding ≤ 10μM
|
|
ESR1-2-E |
Estrogen Receptor Alpha (cluster #2 Of 5), Eukaryotic |
Eukaryotes |
5000 |
0.23 |
Binding ≤ 10μM
|
|
ESR2-2-E |
Estrogen Receptor Beta (cluster #2 Of 4), Eukaryotic |
Eukaryotes |
2876 |
0.24 |
Binding ≤ 10μM
|
|
GCR-2-E |
Glucocorticoid Receptor (cluster #2 Of 2), Eukaryotic |
Eukaryotes |
410 |
0.28 |
Binding ≤ 10μM
|
|
MCR-1-E |
Mineralocorticoid Receptor (cluster #1 Of 2), Eukaryotic |
Eukaryotes |
640 |
0.27 |
Binding ≤ 10μM
|
|
PRGR-1-E |
Progesterone Receptor (cluster #1 Of 3), Eukaryotic |
Eukaryotes |
4 |
0.37 |
Binding ≤ 10μM |
|
ANDR-2-E |
Androgen Receptor (cluster #2 Of 3), Eukaryotic |
Eukaryotes |
8 |
0.35 |
Functional ≤ 10μM
|
|
ESR1-2-E |
Estrogen Receptor Alpha (cluster #2 Of 3), Eukaryotic |
Eukaryotes |
2244 |
0.25 |
Functional ≤ 10μM
|
|
ESR2-1-E |
Estrogen Receptor Beta (cluster #1 Of 2), Eukaryotic |
Eukaryotes |
812 |
0.27 |
Functional ≤ 10μM
|
|
GCR-2-E |
Glucocorticoid Receptor (cluster #2 Of 2), Eukaryotic |
Eukaryotes |
2 |
0.38 |
Functional ≤ 10μM
|
|
MCR-2-E |
Mineralocorticoid Receptor (cluster #2 Of 2), Eukaryotic |
Eukaryotes |
1155 |
0.26 |
Functional ≤ 10μM
|
|
PRGR-2-E |
Progesterone Receptor (cluster #2 Of 2), Eukaryotic |
Eukaryotes |
3 |
0.37 |
Functional ≤ 10μM
|
|
CP3A4-2-E |
Cytochrome P450 3A4 (cluster #2 Of 4), Eukaryotic |
Eukaryotes |
4700 |
0.23 |
ADME/T ≤ 10μM
|
|
Z50425-4-O |
Plasmodium Falciparum (cluster #4 Of 22), Other |
Other |
6310 |
0.23 |
Functional ≤ 10μM
|
|
Z80110-2-O |
CV-1 (Kidney Cells) (cluster #2 Of 2), Other |
Other |
10 |
0.35 |
Functional ≤ 10μM
|
|
Z80491-2-O |
SK-N-MC (Neuroepithelioma Cells) (cluster #2 Of 4), Other |
Other |
0 |
0.00 |
Functional ≤ 10μM
|
|
Z80951-1-O |
NIH3T3 (Fibroblasts) (cluster #1 Of 4), Other |
Other |
2 |
0.38 |
Functional ≤ 10μM
|
|
VP16-1-V |
Alpha Trans-inducing Protein (VP16) (cluster #1 Of 1), Viral |
Viruses |
1 |
0.39 |
Functional ≤ 10μM
|
Physical Representations
|
Type
pH range
|
xlogP
|
Des A‑Pol
Apolar desolvation
(kcal/mol)
|
Des Pol
Polar desolvation
(kcal/mol)
|
H Don
H-bond donors
|
H Acc
H-bond acceptors
|
Chg
Net charge
|
tPSA
(Ų)
|
MWT
Molecular weight
(g/mol)
|
RB
Rotatable bonds
|
DL |
|
Ref
Reference (pH 7)
|
5.60 |
1.26 |
-10.46 |
1 |
3 |
0 |
40 |
429.604 |
2 |
↓
|
|
|
|
Analogs
Draw
Identity
99%
90%
80%
70%
Vendors
And 6 More
Physical Representations
|
Type
pH range
|
xlogP
|
Des A‑Pol
Apolar desolvation
(kcal/mol)
|
Des Pol
Polar desolvation
(kcal/mol)
|
H Don
H-bond donors
|
H Acc
H-bond acceptors
|
Chg
Net charge
|
tPSA
(Ų)
|
MWT
Molecular weight
(g/mol)
|
RB
Rotatable bonds
|
DL |
|
Mid
Mid (pH 6-8)
|
7.90 |
18.51 |
-6.65 |
0 |
4 |
0 |
68 |
536.797 |
11 |
↓
|
|
|
|
Analogs
-
4860424
-
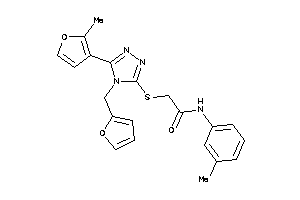
Draw
Identity
99%
90%
80%
70%
Vendors
Clustered Target Annotations
| Code |
Organism Class |
Affinity (nM) |
LE (kcal/mol/atom) |
Type |
|
OX1R-1-E |
Orexin Receptor 1 (cluster #1 Of 1), Eukaryotic |
Eukaryotes |
794 |
0.28 |
Functional ≤ 10μM
|
|
OX2R-1-E |
Orexin Receptor 2 (cluster #1 Of 1), Eukaryotic |
Eukaryotes |
2 |
0.41 |
Functional ≤ 10μM
|
|
CP3A4-2-E |
Cytochrome P450 3A4 (cluster #2 Of 4), Eukaryotic |
Eukaryotes |
2000 |
0.27 |
ADME/T ≤ 10μM
|
Physical Representations
|
Type
pH range
|
xlogP
|
Des A‑Pol
Apolar desolvation
(kcal/mol)
|
Des Pol
Polar desolvation
(kcal/mol)
|
H Don
H-bond donors
|
H Acc
H-bond acceptors
|
Chg
Net charge
|
tPSA
(Ų)
|
MWT
Molecular weight
(g/mol)
|
RB
Rotatable bonds
|
DL |
|
Ref
Reference (pH 7)
|
4.14 |
11.69 |
-15.25 |
1 |
7 |
0 |
86 |
422.51 |
7 |
↓
|
|
|
|
Analogs
-
1552220
-
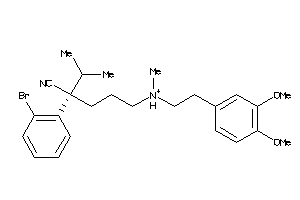
Draw
Identity
99%
90%
80%
70%
Vendors
And 4 More
Clustered Target Annotations
| Code |
Organism Class |
Affinity (nM) |
LE (kcal/mol/atom) |
Type |
|
MDR1-1-E |
P-glycoprotein 1 (cluster #1 Of 3), Eukaryotic |
Eukaryotes |
4240 |
0.24 |
Binding ≤ 10μM
|
|
CP3A4-2-E |
Cytochrome P450 3A4 (cluster #2 Of 4), Eukaryotic |
Eukaryotes |
5890 |
0.23 |
ADME/T ≤ 10μM
|
|
CP3A5-1-E |
Cytochrome P450 3A5 (cluster #1 Of 1), Eukaryotic |
Eukaryotes |
4530 |
0.23 |
ADME/T ≤ 10μM
|
Physical Representations
|
Type
pH range
|
xlogP
|
Des A‑Pol
Apolar desolvation
(kcal/mol)
|
Des Pol
Polar desolvation
(kcal/mol)
|
H Don
H-bond donors
|
H Acc
H-bond acceptors
|
Chg
Net charge
|
tPSA
(Ų)
|
MWT
Molecular weight
(g/mol)
|
RB
Rotatable bonds
|
DL |
|
Ref
Reference (pH 7)
|
3.96 |
10.65 |
-62.79 |
2 |
6 |
1 |
77 |
441.592 |
13 |
↓
|
|
|
|
Analogs
-
1552220
-

Draw
Identity
99%
90%
80%
70%
Vendors
And 3 More
Clustered Target Annotations
| Code |
Organism Class |
Affinity (nM) |
LE (kcal/mol/atom) |
Type |
|
MDR1-1-E |
P-glycoprotein 1 (cluster #1 Of 3), Eukaryotic |
Eukaryotes |
4240 |
0.24 |
Binding ≤ 10μM
|
|
CP3A4-2-E |
Cytochrome P450 3A4 (cluster #2 Of 4), Eukaryotic |
Eukaryotes |
5890 |
0.23 |
ADME/T ≤ 10μM
|
|
CP3A5-1-E |
Cytochrome P450 3A5 (cluster #1 Of 1), Eukaryotic |
Eukaryotes |
4530 |
0.23 |
ADME/T ≤ 10μM
|
Physical Representations
|
Type
pH range
|
xlogP
|
Des A‑Pol
Apolar desolvation
(kcal/mol)
|
Des Pol
Polar desolvation
(kcal/mol)
|
H Don
H-bond donors
|
H Acc
H-bond acceptors
|
Chg
Net charge
|
tPSA
(Ų)
|
MWT
Molecular weight
(g/mol)
|
RB
Rotatable bonds
|
DL |
|
Ref
Reference (pH 7)
|
3.96 |
10.64 |
-62.86 |
2 |
6 |
1 |
77 |
441.592 |
13 |
↓
|
|
|
|
Analogs
Draw
Identity
99%
90%
80%
70%
Vendors
Physical Representations
|
Type
pH range
|
xlogP
|
Des A‑Pol
Apolar desolvation
(kcal/mol)
|
Des Pol
Polar desolvation
(kcal/mol)
|
H Don
H-bond donors
|
H Acc
H-bond acceptors
|
Chg
Net charge
|
tPSA
(Ų)
|
MWT
Molecular weight
(g/mol)
|
RB
Rotatable bonds
|
DL |
|
Ref
Reference (pH 7)
|
4.33 |
-1.18 |
-20.69 |
1 |
12 |
0 |
115 |
700.791 |
12 |
↓
|
|
|
|
Analogs
Draw
Identity
99%
90%
80%
70%
Vendors
And 7 More
Clustered Target Annotations
| Code |
Organism Class |
Affinity (nM) |
LE (kcal/mol/atom) |
Type |
|
5HT6R-1-E |
Serotonin 6 (5-HT6) Receptor (cluster #1 Of 2), Eukaryotic |
Eukaryotes |
71 |
0.29 |
Binding ≤ 10μM
|
|
5HT7R-1-E |
Serotonin 7 (5-HT7) Receptor (cluster #1 Of 3), Eukaryotic |
Eukaryotes |
1 |
0.37 |
Binding ≤ 10μM
|
|
CAC1G-1-E |
Voltage-gated T-type Calcium Channel Alpha-1G Subunit (cluster #1 Of 2), Eukaryotic |
Eukaryotes |
40 |
0.30 |
Binding ≤ 10μM
|
|
DRD1-1-E |
Dopamine D1 Receptor (cluster #1 Of 4), Eukaryotic |
Eukaryotes |
0 |
0.00 |
Binding ≤ 10μM
|
|
DRD3-1-E |
Dopamine D3 Receptor (cluster #1 Of 2), Eukaryotic |
Eukaryotes |
0 |
0.00 |
Binding ≤ 10μM
|
|
DRD4-3-E |
Dopamine D4 Receptor (cluster #3 Of 4), Eukaryotic |
Eukaryotes |
0 |
0.00 |
Binding ≤ 10μM
|
|
DRD5-1-E |
Dopamine D5 Receptor (cluster #1 Of 1), Eukaryotic |
Eukaryotes |
0 |
0.00 |
Binding ≤ 10μM
|
|
KCNH2-5-E |
HERG (cluster #5 Of 5), Eukaryotic |
Eukaryotes |
7300 |
0.21 |
Binding ≤ 10μM
|
|
OPRD-1-E |
Delta Opioid Receptor (cluster #1 Of 3), Eukaryotic |
Eukaryotes |
3760 |
0.22 |
Binding ≤ 10μM
|
|
OPRK-1-E |
Kappa Opioid Receptor (cluster #1 Of 6), Eukaryotic |
Eukaryotes |
990 |
0.25 |
Binding ≤ 10μM
|
|
OPRM-1-E |
Mu-type Opioid Receptor (cluster #1 Of 4), Eukaryotic |
Eukaryotes |
372 |
0.26 |
Binding ≤ 10μM
|
|
SCN2A-2-E |
Sodium Channel Protein Type II Alpha Subunit (cluster #2 Of 2), Eukaryotic |
Eukaryotes |
340 |
0.27 |
Binding ≤ 10μM
|
|
KCNH2-1-E |
HERG (cluster #1 Of 2), Eukaryotic |
Eukaryotes |
18 |
0.32 |
Functional ≤ 10μM
|
|
MDR1-1-E |
P-glycoprotein 1 (cluster #1 Of 2), Eukaryotic |
Eukaryotes |
800 |
0.25 |
Functional ≤ 10μM
|
|
MDR3-1-E |
P-glycoprotein 3 (cluster #1 Of 2), Eukaryotic |
Eukaryotes |
4900 |
0.22 |
Functional ≤ 10μM
|
|
CP3A4-2-E |
Cytochrome P450 3A4 (cluster #2 Of 4), Eukaryotic |
Eukaryotes |
9700 |
0.21 |
ADME/T ≤ 10μM
|
|
DRD2-7-E |
Dopamine D2 Receptor (cluster #7 Of 24), Eukaryotic |
Eukaryotes |
0 |
0.00 |
Binding ≤ 10μM
|
|
Z50425-3-O |
Plasmodium Falciparum (cluster #3 Of 22), Other |
Other |
6310 |
0.21 |
Functional ≤ 10μM
|
Physical Representations
|
Type
pH range
|
xlogP
|
Des A‑Pol
Apolar desolvation
(kcal/mol)
|
Des Pol
Polar desolvation
(kcal/mol)
|
H Don
H-bond donors
|
H Acc
H-bond acceptors
|
Chg
Net charge
|
tPSA
(Ų)
|
MWT
Molecular weight
(g/mol)
|
RB
Rotatable bonds
|
DL |
|
Ref
Reference (pH 7)
|
5.62 |
15.68 |
-51.49 |
2 |
4 |
1 |
42 |
462.564 |
7 |
↓
|
|
|
|
Analogs
Draw
Identity
99%
90%
80%
70%
Vendors
And 1 More
Clustered Target Annotations
| Code |
Organism Class |
Affinity (nM) |
LE (kcal/mol/atom) |
Type |
|
CP3A4-2-E |
Cytochrome P450 3A4 (cluster #2 Of 4), Eukaryotic |
Eukaryotes |
9000 |
0.23 |
ADME/T ≤ 10μM
|
|
Z50425-3-O |
Plasmodium Falciparum (cluster #3 Of 22), Other |
Other |
2512 |
0.25 |
Functional ≤ 10μM
|
Physical Representations
|
Type
pH range
|
xlogP
|
Des A‑Pol
Apolar desolvation
(kcal/mol)
|
Des Pol
Polar desolvation
(kcal/mol)
|
H Don
H-bond donors
|
H Acc
H-bond acceptors
|
Chg
Net charge
|
tPSA
(Ų)
|
MWT
Molecular weight
(g/mol)
|
RB
Rotatable bonds
|
DL |
|
Ref
Reference (pH 7)
|
5.05 |
10.19 |
-18.86 |
1 |
5 |
0 |
54 |
431.389 |
4 |
↓
|
|
|
|
Analogs
-
52245742
-
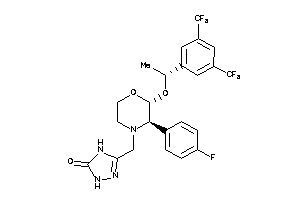
Draw
Identity
99%
90%
80%
70%
Vendors
And 1 More
Clustered Target Annotations
| Code |
Organism Class |
Affinity (nM) |
LE (kcal/mol/atom) |
Type |
|
NK1R-1-E |
Neurokinin 1 Receptor (cluster #1 Of 2), Eukaryotic |
Eukaryotes |
0 |
0.00 |
Binding ≤ 10μM
|
|
NK1R-1-E |
Neurokinin 1 Receptor (cluster #1 Of 2), Eukaryotic |
Eukaryotes |
0 |
0.00 |
Binding ≤ 10μM
|
|
CP3A4-2-E |
Cytochrome P450 3A4 (cluster #2 Of 4), Eukaryotic |
Eukaryotes |
46 |
0.28 |
ADME/T ≤ 10μM
|
Physical Representations
|
Type
pH range
|
xlogP
|
Des A‑Pol
Apolar desolvation
(kcal/mol)
|
Des Pol
Polar desolvation
(kcal/mol)
|
H Don
H-bond donors
|
H Acc
H-bond acceptors
|
Chg
Net charge
|
tPSA
(Ų)
|
MWT
Molecular weight
(g/mol)
|
RB
Rotatable bonds
|
DL |
|
Ref
Reference (pH 7)
|
4.17 |
9.14 |
-13.06 |
2 |
7 |
0 |
83 |
534.432 |
8 |
↓
|
|
Mid
Mid (pH 6-8)
|
4.63 |
6.85 |
-32.24 |
2 |
7 |
0 |
88 |
534.432 |
8 |
↓
|
|
|
|
Analogs
-
19796087
-
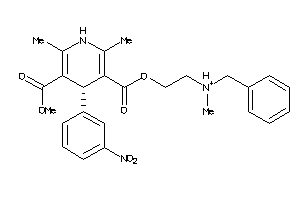
Draw
Identity
99%
90%
80%
70%
Vendors
And 19 More
Clustered Target Annotations
| Code |
Organism Class |
Affinity (nM) |
LE (kcal/mol/atom) |
Type |
|
AA3R-1-E |
Adenosine Receptor A3 (cluster #1 Of 6), Eukaryotic |
Eukaryotes |
3250 |
0.22 |
Binding ≤ 10μM
|
|
ADA2A-1-E |
Alpha-2a Adrenergic Receptor (cluster #1 Of 4), Eukaryotic |
Eukaryotes |
1400 |
0.23 |
Binding ≤ 10μM
|
|
ADA2B-1-E |
Alpha-2b Adrenergic Receptor (cluster #1 Of 4), Eukaryotic |
Eukaryotes |
1400 |
0.23 |
Binding ≤ 10μM
|
|
ADA2C-1-E |
Alpha-2c Adrenergic Receptor (cluster #1 Of 4), Eukaryotic |
Eukaryotes |
1400 |
0.23 |
Binding ≤ 10μM
|
|
CAC1C-1-E |
Voltage-gated L-type Calcium Channel Alpha-1C Subunit (cluster #1 Of 1), Eukaryotic |
Eukaryotes |
7 |
0.33 |
Binding ≤ 10μM
|
|
CAC1D-1-E |
Voltage-gated L-type Calcium Channel Alpha-1D Subunit (cluster #1 Of 2), Eukaryotic |
Eukaryotes |
7 |
0.33 |
Binding ≤ 10μM
|
|
CTRA-1-E |
Alpha-chymotrypsin (cluster #1 Of 4), Eukaryotic |
Eukaryotes |
3 |
0.34 |
Binding ≤ 10μM
|
|
MDHM-1-E |
Malate Dehydrogenase, Mitochondrial (cluster #1 Of 2), Eukaryotic |
Eukaryotes |
49 |
0.29 |
Binding ≤ 10μM
|
|
S29A1-1-E |
Equilibrative Nucleoside Transporter 1 (cluster #1 Of 1), Eukaryotic |
Eukaryotes |
5360 |
0.21 |
Binding ≤ 10μM
|
|
CAC1C-1-E |
Voltage-gated L-type Calcium Channel Alpha-1C Subunit (cluster #1 Of 1), Eukaryotic |
Eukaryotes |
3 |
0.34 |
Functional ≤ 10μM
|
|
CAC1D-1-E |
Voltage-gated L-type Calcium Channel Alpha-1D Subunit (cluster #1 Of 1), Eukaryotic |
Eukaryotes |
3 |
0.34 |
Functional ≤ 10μM
|
|
MDR1-1-E |
P-glycoprotein 1 (cluster #1 Of 2), Eukaryotic |
Eukaryotes |
950 |
0.24 |
Functional ≤ 10μM
|
|
MDR3-1-E |
P-glycoprotein 3 (cluster #1 Of 2), Eukaryotic |
Eukaryotes |
2500 |
0.22 |
Functional ≤ 10μM
|
|
TRPA1-4-E |
Transient Receptor Potential Cation Channel Subfamily A Member 1 (cluster #4 Of 6), Eukaryotic |
Eukaryotes |
500 |
0.25 |
Functional ≤ 10μM |
|
CP2C9-1-E |
Cytochrome P450 2C9 (cluster #1 Of 3), Eukaryotic |
Eukaryotes |
280 |
0.26 |
ADME/T ≤ 10μM
|
|
CP3A4-2-E |
Cytochrome P450 3A4 (cluster #2 Of 4), Eukaryotic |
Eukaryotes |
420 |
0.26 |
ADME/T ≤ 10μM
|
|
Z104304-1-O |
Adrenergic Receptor Alpha-1 (cluster #1 Of 3), Other |
Other |
3600 |
0.22 |
Binding ≤ 10μM
|
|
Z50597-1-O |
Rattus Norvegicus (cluster #1 Of 5), Other |
Other |
0 |
0.00 |
Binding ≤ 10μM
|
|
Z50425-3-O |
Plasmodium Falciparum (cluster #3 Of 22), Other |
Other |
1995 |
0.23 |
Functional ≤ 10μM
|
|
Z50590-1-O |
Sus Scrofa (cluster #1 Of 1), Other |
Other |
0 |
0.00 |
Functional ≤ 10μM
|
|
Z50597-1-O |
Rattus Norvegicus (cluster #1 Of 12), Other |
Other |
1400 |
0.23 |
Functional ≤ 10μM
|
Physical Representations
|
Type
pH range
|
xlogP
|
Des A‑Pol
Apolar desolvation
(kcal/mol)
|
Des Pol
Polar desolvation
(kcal/mol)
|
H Don
H-bond donors
|
H Acc
H-bond acceptors
|
Chg
Net charge
|
tPSA
(Ų)
|
MWT
Molecular weight
(g/mol)
|
RB
Rotatable bonds
|
DL |
|
Ref
Reference (pH 7)
|
4.25 |
14.38 |
-38.25 |
1 |
9 |
0 |
121 |
479.533 |
10 |
↓
|
|
Hi
High (pH 8-9.5)
|
5.00 |
13.02 |
-15.82 |
1 |
9 |
0 |
114 |
479.533 |
11 |
↓
|
|
Mid
Mid (pH 6-8)
|
4.25 |
11.97 |
-39.15 |
0 |
9 |
-1 |
120 |
478.525 |
10 |
↓
|
|
|
|
Analogs
-
601265
-
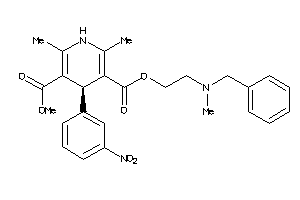
Draw
Identity
99%
90%
80%
70%
Vendors
And 26 More
Clustered Target Annotations
| Code |
Organism Class |
Affinity (nM) |
LE (kcal/mol/atom) |
Type |
|
AA3R-1-E |
Adenosine Receptor A3 (cluster #1 Of 6), Eukaryotic |
Eukaryotes |
3250 |
0.22 |
Binding ≤ 10μM
|
|
ADA2A-1-E |
Alpha-2a Adrenergic Receptor (cluster #1 Of 4), Eukaryotic |
Eukaryotes |
1400 |
0.23 |
Binding ≤ 10μM
|
|
ADA2B-1-E |
Alpha-2b Adrenergic Receptor (cluster #1 Of 4), Eukaryotic |
Eukaryotes |
1400 |
0.23 |
Binding ≤ 10μM
|
|
ADA2C-1-E |
Alpha-2c Adrenergic Receptor (cluster #1 Of 4), Eukaryotic |
Eukaryotes |
1400 |
0.23 |
Binding ≤ 10μM
|
|
CAC1C-1-E |
Voltage-gated L-type Calcium Channel Alpha-1C Subunit (cluster #1 Of 1), Eukaryotic |
Eukaryotes |
7 |
0.33 |
Binding ≤ 10μM
|
|
CAC1D-1-E |
Voltage-gated L-type Calcium Channel Alpha-1D Subunit (cluster #1 Of 2), Eukaryotic |
Eukaryotes |
7 |
0.33 |
Binding ≤ 10μM
|
|
CTRA-1-E |
Alpha-chymotrypsin (cluster #1 Of 4), Eukaryotic |
Eukaryotes |
3 |
0.34 |
Binding ≤ 10μM
|
|
MDHM-1-E |
Malate Dehydrogenase, Mitochondrial (cluster #1 Of 2), Eukaryotic |
Eukaryotes |
49 |
0.29 |
Binding ≤ 10μM
|
|
S29A1-1-E |
Equilibrative Nucleoside Transporter 1 (cluster #1 Of 1), Eukaryotic |
Eukaryotes |
5360 |
0.21 |
Binding ≤ 10μM
|
|
CAC1C-1-E |
Voltage-gated L-type Calcium Channel Alpha-1C Subunit (cluster #1 Of 1), Eukaryotic |
Eukaryotes |
3 |
0.34 |
Functional ≤ 10μM
|
|
CAC1D-1-E |
Voltage-gated L-type Calcium Channel Alpha-1D Subunit (cluster #1 Of 1), Eukaryotic |
Eukaryotes |
3 |
0.34 |
Functional ≤ 10μM
|
|
MDR1-1-E |
P-glycoprotein 1 (cluster #1 Of 2), Eukaryotic |
Eukaryotes |
950 |
0.24 |
Functional ≤ 10μM
|
|
MDR3-1-E |
P-glycoprotein 3 (cluster #1 Of 2), Eukaryotic |
Eukaryotes |
2500 |
0.22 |
Functional ≤ 10μM
|
|
TRPA1-4-E |
Transient Receptor Potential Cation Channel Subfamily A Member 1 (cluster #4 Of 6), Eukaryotic |
Eukaryotes |
500 |
0.25 |
Functional ≤ 10μM |
|
CP2C9-1-E |
Cytochrome P450 2C9 (cluster #1 Of 3), Eukaryotic |
Eukaryotes |
280 |
0.26 |
ADME/T ≤ 10μM
|
|
CP3A4-2-E |
Cytochrome P450 3A4 (cluster #2 Of 4), Eukaryotic |
Eukaryotes |
420 |
0.26 |
ADME/T ≤ 10μM
|
|
Z104304-1-O |
Adrenergic Receptor Alpha-1 (cluster #1 Of 3), Other |
Other |
3600 |
0.22 |
Binding ≤ 10μM
|
|
Z50597-1-O |
Rattus Norvegicus (cluster #1 Of 5), Other |
Other |
0 |
0.00 |
Binding ≤ 10μM
|
|
Z50425-3-O |
Plasmodium Falciparum (cluster #3 Of 22), Other |
Other |
1995 |
0.23 |
Functional ≤ 10μM
|
|
Z50590-1-O |
Sus Scrofa (cluster #1 Of 1), Other |
Other |
0 |
0.00 |
Functional ≤ 10μM
|
|
Z50597-1-O |
Rattus Norvegicus (cluster #1 Of 12), Other |
Other |
1400 |
0.23 |
Functional ≤ 10μM
|
Physical Representations
|
Type
pH range
|
xlogP
|
Des A‑Pol
Apolar desolvation
(kcal/mol)
|
Des Pol
Polar desolvation
(kcal/mol)
|
H Don
H-bond donors
|
H Acc
H-bond acceptors
|
Chg
Net charge
|
tPSA
(Ų)
|
MWT
Molecular weight
(g/mol)
|
RB
Rotatable bonds
|
DL |
|
Ref
Reference (pH 7)
|
5.00 |
15.39 |
-55.91 |
2 |
9 |
1 |
115 |
480.541 |
11 |
↓
|
|
Hi
High (pH 8-9.5)
|
5.00 |
13.13 |
-16.47 |
1 |
9 |
0 |
114 |
479.533 |
11 |
↓
|
|
Mid
Mid (pH 6-8)
|
4.25 |
11.42 |
-38.29 |
0 |
9 |
-1 |
120 |
478.525 |
10 |
↓
|
|
|
|
Analogs
Draw
Identity
99%
90%
80%
70%
Vendors
And 4 More
Clustered Target Annotations
| Code |
Organism Class |
Affinity (nM) |
LE (kcal/mol/atom) |
Type |
|
MDR1-2-E |
P-glycoprotein 1 (cluster #2 Of 2), Eukaryotic |
Eukaryotes |
1500 |
0.16 |
Functional ≤ 10μM
|
|
CP2B6-3-E |
Cytochrome P450 2B6 (cluster #3 Of 4), Eukaryotic |
Eukaryotes |
2000 |
0.16 |
ADME/T ≤ 10μM
|
|
CP3A4-2-E |
Cytochrome P450 3A4 (cluster #2 Of 4), Eukaryotic |
Eukaryotes |
50 |
0.20 |
ADME/T ≤ 10μM
|
|
CP3A5-1-E |
Cytochrome P450 3A5 (cluster #1 Of 1), Eukaryotic |
Eukaryotes |
120 |
0.19 |
ADME/T ≤ 10μM
|
|
Z102015-1-O |
Plasmodium Vivax (cluster #1 Of 1), Other |
Other |
2233 |
0.16 |
Functional ≤ 10μM
|
|
Z50038-1-O |
Plasmodium Yoelii Yoelii (cluster #1 Of 2), Other |
Other |
34 |
0.21 |
Functional ≤ 10μM
|
|
Z50425-3-O |
Plasmodium Falciparum (cluster #3 Of 22), Other |
Other |
9664 |
0.14 |
Functional ≤ 10μM
|
|
Z50607-1-O |
Human Immunodeficiency Virus 1 (cluster #1 Of 10), Other |
Other |
25 |
0.21 |
Functional ≤ 10μM
|
|
Z50607-1-O |
Human Immunodeficiency Virus 1 (cluster #1 Of 10), Other |
Other |
90 |
0.20 |
Functional ≤ 10μM
|
|
Z50658-3-O |
Human Immunodeficiency Virus 2 (cluster #3 Of 4), Other |
Other |
84 |
0.20 |
Functional ≤ 10μM
|
|
Z50677-1-O |
Human Immunodeficiency Virus (cluster #1 Of 3), Other |
Other |
38 |
0.21 |
Functional ≤ 10μM
|
|
Z80294-1-O |
MT2 (Lymphocytes) (cluster #1 Of 1), Other |
Other |
10 |
0.22 |
Functional ≤ 10μM
|
|
Z80295-2-O |
MT4 (Lymphocytes) (cluster #2 Of 8), Other |
Other |
90 |
0.20 |
Functional ≤ 10μM |
|
Z102164-1-O |
Liver Microsomes (cluster #1 Of 1), Other |
Other |
40 |
0.21 |
ADME/T ≤ 10μM
|
|
Q72874-1-V |
Human Immunodeficiency Virus Type 1 Protease (cluster #1 Of 3), Viral |
Viruses |
60 |
0.20 |
Binding ≤ 10μM
|
Physical Representations
|
Type
pH range
|
xlogP
|
Des A‑Pol
Apolar desolvation
(kcal/mol)
|
Des Pol
Polar desolvation
(kcal/mol)
|
H Don
H-bond donors
|
H Acc
H-bond acceptors
|
Chg
Net charge
|
tPSA
(Ų)
|
MWT
Molecular weight
(g/mol)
|
RB
Rotatable bonds
|
DL |
|
Ref
Reference (pH 7)
|
7.51 |
12.91 |
-25.34 |
4 |
11 |
0 |
146 |
720.962 |
18 |
↓
|
|
|
|
Analogs
Draw
Identity
99%
90%
80%
70%
Vendors
Physical Representations
|
Type
pH range
|
xlogP
|
Des A‑Pol
Apolar desolvation
(kcal/mol)
|
Des Pol
Polar desolvation
(kcal/mol)
|
H Don
H-bond donors
|
H Acc
H-bond acceptors
|
Chg
Net charge
|
tPSA
(Ų)
|
MWT
Molecular weight
(g/mol)
|
RB
Rotatable bonds
|
DL |
|
Ref
Reference (pH 7)
|
1.08 |
-2.03 |
-62.97 |
3 |
5 |
1 |
66 |
304.395 |
2 |
↓
|
|
|
|
Analogs
Draw
Identity
99%
90%
80%
70%
Vendors
Physical Representations
|
Type
pH range
|
xlogP
|
Des A‑Pol
Apolar desolvation
(kcal/mol)
|
Des Pol
Polar desolvation
(kcal/mol)
|
H Don
H-bond donors
|
H Acc
H-bond acceptors
|
Chg
Net charge
|
tPSA
(Ų)
|
MWT
Molecular weight
(g/mol)
|
RB
Rotatable bonds
|
DL |
|
Ref
Reference (pH 7)
|
4.03 |
-1.62 |
-54.43 |
4 |
11 |
1 |
124 |
531.572 |
8 |
↓
|
|
|
|
Analogs
Draw
Identity
99%
90%
80%
70%
Vendors
Clustered Target Annotations
| Code |
Organism Class |
Affinity (nM) |
LE (kcal/mol/atom) |
Type |
|
AL5AP-1-E |
5-lipoxygenase Activating Protein (cluster #1 Of 1), Eukaryotic |
Eukaryotes |
2 |
0.30 |
Binding ≤ 10μM |
|
LOX5-1-E |
Arachidonate 5-lipoxygenase (cluster #1 Of 6), Eukaryotic |
Eukaryotes |
5000 |
0.18 |
Binding ≤ 10μM
|
|
AL5AP-1-E |
5-lipoxygenase Activating Protein (cluster #1 Of 1), Eukaryotic |
Eukaryotes |
8000 |
0.17 |
Functional ≤ 10μM |
|
LOX5-1-E |
Arachidonate 5-lipoxygenase (cluster #1 Of 7), Eukaryotic |
Eukaryotes |
8 |
0.28 |
Functional ≤ 10μM
|
|
LOX5-1-E |
Arachidonate 5-lipoxygenase (cluster #1 Of 7), Eukaryotic |
Eukaryotes |
8000 |
0.17 |
Functional ≤ 10μM |
|
CP2C9-1-E |
Cytochrome P450 2C9 (cluster #1 Of 3), Eukaryotic |
Eukaryotes |
500 |
0.22 |
ADME/T ≤ 10μM
|
|
CP2D6-1-E |
Cytochrome P450 2D6 (cluster #1 Of 3), Eukaryotic |
Eukaryotes |
11 |
0.27 |
ADME/T ≤ 10μM
|
|
CP3A4-2-E |
Cytochrome P450 3A4 (cluster #2 Of 4), Eukaryotic |
Eukaryotes |
5200 |
0.18 |
ADME/T ≤ 10μM
|
|
Z102213-1-O |
Blood (cluster #1 Of 2), Other |
Other |
510 |
0.21 |
Functional ≤ 10μM
|
|
Z50587-1-O |
Homo Sapiens (cluster #1 Of 9), Other |
Other |
500 |
0.22 |
Functional ≤ 10μM
|
|
Z50587-1-O |
Homo Sapiens (cluster #1 Of 9), Other |
Other |
510 |
0.21 |
Functional ≤ 10μM
|
|
Z50597-1-O |
Rattus Norvegicus (cluster #1 Of 12), Other |
Other |
2 |
0.30 |
Functional ≤ 10μM
|
|
Z80419-1-O |
RBL-1 (Basophilic Leukemia Cells) (cluster #1 Of 2), Other |
Other |
6 |
0.28 |
Functional ≤ 10μM
|
Physical Representations
|
Type
pH range
|
xlogP
|
Des A‑Pol
Apolar desolvation
(kcal/mol)
|
Des Pol
Polar desolvation
(kcal/mol)
|
H Don
H-bond donors
|
H Acc
H-bond acceptors
|
Chg
Net charge
|
tPSA
(Ų)
|
MWT
Molecular weight
(g/mol)
|
RB
Rotatable bonds
|
DL |
|
Ref
Reference (pH 7)
|
8.57 |
1.77 |
-52.69 |
0 |
5 |
-1 |
67 |
586.177 |
10 |
↓
|
|
|
|
Analogs
Draw
Identity
99%
90%
80%
70%
Vendors
And 8 More
Clustered Target Annotations
| Code |
Organism Class |
Affinity (nM) |
LE (kcal/mol/atom) |
Type |
|
AA2AR-2-E |
Adenosine A2a Receptor (cluster #2 Of 4), Eukaryotic |
Eukaryotes |
220 |
0.39 |
Binding ≤ 10μM |
|
CP3A4-2-E |
Cytochrome P450 3A4 (cluster #2 Of 4), Eukaryotic |
Eukaryotes |
1400 |
0.34 |
ADME/T ≤ 10μM |
Physical Representations
|
Type
pH range
|
xlogP
|
Des A‑Pol
Apolar desolvation
(kcal/mol)
|
Des Pol
Polar desolvation
(kcal/mol)
|
H Don
H-bond donors
|
H Acc
H-bond acceptors
|
Chg
Net charge
|
tPSA
(Ų)
|
MWT
Molecular weight
(g/mol)
|
RB
Rotatable bonds
|
DL |
|
Ref
Reference (pH 7)
|
3.17 |
-1.14 |
-16 |
2 |
5 |
0 |
71 |
337.404 |
4 |
↓
|
|
|
|
Analogs
-
3929426
-
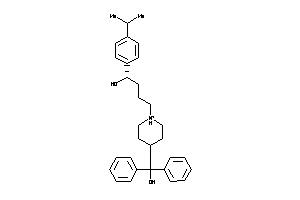
Draw
Identity
99%
90%
80%
70%
Vendors
And 17 More
Clustered Target Annotations
| Code |
Organism Class |
Affinity (nM) |
LE (kcal/mol/atom) |
Type |
|
ACM1-3-E |
Muscarinic Acetylcholine Receptor M1 (cluster #3 Of 5), Eukaryotic |
Eukaryotes |
2900 |
0.22 |
Binding ≤ 10μM
|
|
ADA1A-3-E |
Alpha-1a Adrenergic Receptor (cluster #3 Of 3), Eukaryotic |
Eukaryotes |
2340 |
0.23 |
Binding ≤ 10μM
|
|
ADA1B-1-E |
Alpha-1b Adrenergic Receptor (cluster #1 Of 4), Eukaryotic |
Eukaryotes |
2340 |
0.23 |
Binding ≤ 10μM
|
|
ADA1D-1-E |
Alpha-1d Adrenergic Receptor (cluster #1 Of 3), Eukaryotic |
Eukaryotes |
2340 |
0.23 |
Binding ≤ 10μM
|
|
CP2J2-1-E |
Cytochrome P450 2J2 (cluster #1 Of 1), Eukaryotic |
Eukaryotes |
8100 |
0.20 |
Binding ≤ 10μM
|
|
HRH1-2-E |
Histamine H1 Receptor (cluster #2 Of 2), Eukaryotic |
Eukaryotes |
94 |
0.28 |
Binding ≤ 10μM
|
|
KCNH2-5-E |
HERG (cluster #5 Of 5), Eukaryotic |
Eukaryotes |
6700 |
0.21 |
Binding ≤ 10μM
|
|
HRH1-1-E |
Histamine H1 Receptor (cluster #1 Of 2), Eukaryotic |
Eukaryotes |
563 |
0.25 |
Functional ≤ 10μM |
|
KCNH2-2-E |
HERG (cluster #2 Of 2), Eukaryotic |
Eukaryotes |
204 |
0.27 |
Functional ≤ 10μM
|
|
MDR1-1-E |
P-glycoprotein 1 (cluster #1 Of 2), Eukaryotic |
Eukaryotes |
1400 |
0.23 |
Functional ≤ 10μM
|
|
CP3A4-2-E |
Cytochrome P450 3A4 (cluster #2 Of 4), Eukaryotic |
Eukaryotes |
320 |
0.26 |
ADME/T ≤ 10μM
|
|
Z50425-3-O |
Plasmodium Falciparum (cluster #3 Of 22), Other |
Other |
5012 |
0.21 |
Functional ≤ 10μM
|
|
Z50594-1-O |
Mus Musculus (cluster #1 Of 9), Other |
Other |
4950 |
0.21 |
Functional ≤ 10μM
|
Physical Representations
|
Type
pH range
|
xlogP
|
Des A‑Pol
Apolar desolvation
(kcal/mol)
|
Des Pol
Polar desolvation
(kcal/mol)
|
H Don
H-bond donors
|
H Acc
H-bond acceptors
|
Chg
Net charge
|
tPSA
(Ų)
|
MWT
Molecular weight
(g/mol)
|
RB
Rotatable bonds
|
DL |
|
Ref
Reference (pH 7)
|
6.17 |
14.49 |
-42.25 |
3 |
3 |
1 |
45 |
472.693 |
9 |
↓
|
|
|
|
Analogs
-
3929426
-

-
2383100
-
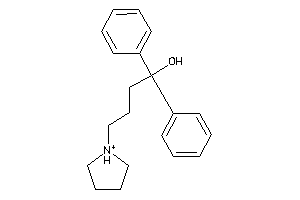
Draw
Identity
99%
90%
80%
70%
Vendors
And 17 More
Clustered Target Annotations
| Code |
Organism Class |
Affinity (nM) |
LE (kcal/mol/atom) |
Type |
|
ACM1-3-E |
Muscarinic Acetylcholine Receptor M1 (cluster #3 Of 5), Eukaryotic |
Eukaryotes |
2900 |
0.22 |
Binding ≤ 10μM
|
|
ADA1A-3-E |
Alpha-1a Adrenergic Receptor (cluster #3 Of 3), Eukaryotic |
Eukaryotes |
2340 |
0.23 |
Binding ≤ 10μM
|
|
ADA1B-1-E |
Alpha-1b Adrenergic Receptor (cluster #1 Of 4), Eukaryotic |
Eukaryotes |
2340 |
0.23 |
Binding ≤ 10μM
|
|
ADA1D-1-E |
Alpha-1d Adrenergic Receptor (cluster #1 Of 3), Eukaryotic |
Eukaryotes |
2340 |
0.23 |
Binding ≤ 10μM
|
|
CP2J2-1-E |
Cytochrome P450 2J2 (cluster #1 Of 1), Eukaryotic |
Eukaryotes |
8100 |
0.20 |
Binding ≤ 10μM
|
|
HRH1-2-E |
Histamine H1 Receptor (cluster #2 Of 2), Eukaryotic |
Eukaryotes |
94 |
0.28 |
Binding ≤ 10μM
|
|
KCNH2-5-E |
HERG (cluster #5 Of 5), Eukaryotic |
Eukaryotes |
6700 |
0.21 |
Binding ≤ 10μM
|
|
HRH1-1-E |
Histamine H1 Receptor (cluster #1 Of 2), Eukaryotic |
Eukaryotes |
563 |
0.25 |
Functional ≤ 10μM |
|
KCNH2-2-E |
HERG (cluster #2 Of 2), Eukaryotic |
Eukaryotes |
204 |
0.27 |
Functional ≤ 10μM
|
|
MDR1-1-E |
P-glycoprotein 1 (cluster #1 Of 2), Eukaryotic |
Eukaryotes |
1400 |
0.23 |
Functional ≤ 10μM
|
|
CP3A4-2-E |
Cytochrome P450 3A4 (cluster #2 Of 4), Eukaryotic |
Eukaryotes |
320 |
0.26 |
ADME/T ≤ 10μM
|
|
Z50425-3-O |
Plasmodium Falciparum (cluster #3 Of 22), Other |
Other |
5012 |
0.21 |
Functional ≤ 10μM
|
|
Z50594-1-O |
Mus Musculus (cluster #1 Of 9), Other |
Other |
4950 |
0.21 |
Functional ≤ 10μM
|
Physical Representations
|
Type
pH range
|
xlogP
|
Des A‑Pol
Apolar desolvation
(kcal/mol)
|
Des Pol
Polar desolvation
(kcal/mol)
|
H Don
H-bond donors
|
H Acc
H-bond acceptors
|
Chg
Net charge
|
tPSA
(Ų)
|
MWT
Molecular weight
(g/mol)
|
RB
Rotatable bonds
|
DL |
|
Ref
Reference (pH 7)
|
6.17 |
14.46 |
-42.32 |
3 |
3 |
1 |
45 |
472.693 |
9 |
↓
|
|
|
|
Analogs
-
14880002
-
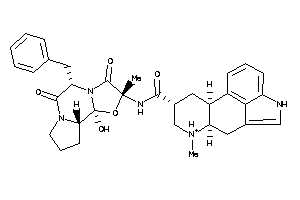
Draw
Identity
99%
90%
80%
70%
Vendors
And 3 More
Physical Representations
|
Type
pH range
|
xlogP
|
Des A‑Pol
Apolar desolvation
(kcal/mol)
|
Des Pol
Polar desolvation
(kcal/mol)
|
H Don
H-bond donors
|
H Acc
H-bond acceptors
|
Chg
Net charge
|
tPSA
(Ų)
|
MWT
Molecular weight
(g/mol)
|
RB
Rotatable bonds
|
DL |
|
Ref
Reference (pH 7)
|
2.09 |
-6.7 |
-65.06 |
4 |
10 |
1 |
119 |
584.697 |
4 |
↓
|
|
|
|
Analogs
-
5761473
-
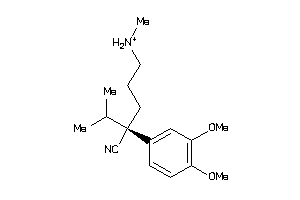
Draw
Identity
99%
90%
80%
70%
Vendors
Clustered Target Annotations
| Code |
Organism Class |
Affinity (nM) |
LE (kcal/mol/atom) |
Type |
|
CP3A4-2-E |
Cytochrome P450 3A4 (cluster #2 Of 4), Eukaryotic |
Eukaryotes |
7930 |
0.34 |
ADME/T ≤ 10μM
|
Physical Representations
|
Type
pH range
|
xlogP
|
Des A‑Pol
Apolar desolvation
(kcal/mol)
|
Des Pol
Polar desolvation
(kcal/mol)
|
H Don
H-bond donors
|
H Acc
H-bond acceptors
|
Chg
Net charge
|
tPSA
(Ų)
|
MWT
Molecular weight
(g/mol)
|
RB
Rotatable bonds
|
DL |
|
Ref
Reference (pH 7)
|
2.86 |
2.71 |
-49.39 |
2 |
4 |
1 |
58 |
291.415 |
8 |
↓
|
|
|
|
Analogs
-
5761248
-
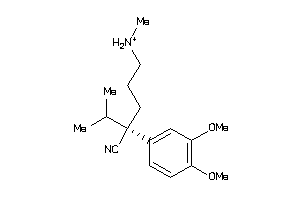
Draw
Identity
99%
90%
80%
70%
Vendors
Clustered Target Annotations
| Code |
Organism Class |
Affinity (nM) |
LE (kcal/mol/atom) |
Type |
|
CP3A4-2-E |
Cytochrome P450 3A4 (cluster #2 Of 4), Eukaryotic |
Eukaryotes |
7930 |
0.34 |
ADME/T ≤ 10μM
|
Physical Representations
|
Type
pH range
|
xlogP
|
Des A‑Pol
Apolar desolvation
(kcal/mol)
|
Des Pol
Polar desolvation
(kcal/mol)
|
H Don
H-bond donors
|
H Acc
H-bond acceptors
|
Chg
Net charge
|
tPSA
(Ų)
|
MWT
Molecular weight
(g/mol)
|
RB
Rotatable bonds
|
DL |
|
Ref
Reference (pH 7)
|
2.86 |
2.66 |
-48.97 |
2 |
4 |
1 |
58 |
291.415 |
8 |
↓
|
|
|
|
Analogs
-
44699444
-
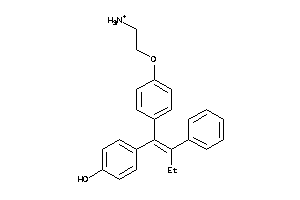
-
77291475
-
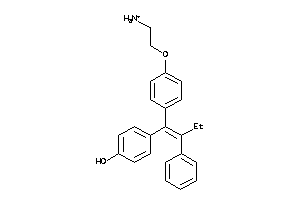
Draw
Identity
99%
90%
80%
70%
Vendors
Clustered Target Annotations
| Code |
Organism Class |
Affinity (nM) |
LE (kcal/mol/atom) |
Type |
|
CP3A4-2-E |
Cytochrome P450 3A4 (cluster #2 Of 4), Eukaryotic |
Eukaryotes |
2600 |
0.30 |
ADME/T ≤ 10μM
|
Physical Representations
|
Type
pH range
|
xlogP
|
Des A‑Pol
Apolar desolvation
(kcal/mol)
|
Des Pol
Polar desolvation
(kcal/mol)
|
H Don
H-bond donors
|
H Acc
H-bond acceptors
|
Chg
Net charge
|
tPSA
(Ų)
|
MWT
Molecular weight
(g/mol)
|
RB
Rotatable bonds
|
DL |
|
Ref
Reference (pH 7)
|
4.84 |
11.83 |
-44.83 |
3 |
2 |
1 |
37 |
344.478 |
7 |
↓
|
|
|
|
Analogs
Draw
Identity
99%
90%
80%
70%
Vendors
And 2 More
Physical Representations
|
Type
pH range
|
xlogP
|
Des A‑Pol
Apolar desolvation
(kcal/mol)
|
Des Pol
Polar desolvation
(kcal/mol)
|
H Don
H-bond donors
|
H Acc
H-bond acceptors
|
Chg
Net charge
|
tPSA
(Ų)
|
MWT
Molecular weight
(g/mol)
|
RB
Rotatable bonds
|
DL |
|
Ref
Reference (pH 7)
|
3.94 |
9.22 |
-9.92 |
1 |
6 |
0 |
61 |
396.878 |
4 |
↓
|
|
Ref
Reference (pH 7)
|
3.94 |
9.38 |
-10.69 |
1 |
6 |
0 |
61 |
396.878 |
4 |
↓
|
|
|
|
Analogs
Draw
Identity
99%
90%
80%
70%
Vendors
Physical Representations
|
Type
pH range
|
xlogP
|
Des A‑Pol
Apolar desolvation
(kcal/mol)
|
Des Pol
Polar desolvation
(kcal/mol)
|
H Don
H-bond donors
|
H Acc
H-bond acceptors
|
Chg
Net charge
|
tPSA
(Ų)
|
MWT
Molecular weight
(g/mol)
|
RB
Rotatable bonds
|
DL |
|
Ref
Reference (pH 7)
|
3.74 |
9.18 |
-13.62 |
3 |
9 |
0 |
111 |
509.92 |
7 |
↓
|
|
|
|
Analogs
Draw
Identity
99%
90%
80%
70%
Vendors
Clustered Target Annotations
| Code |
Organism Class |
Affinity (nM) |
LE (kcal/mol/atom) |
Type |
|
GNRHR-1-E |
Gonadotropin-releasing Hormone Receptor (cluster #1 Of 1), Eukaryotic |
Eukaryotes |
6 |
0.32 |
Binding ≤ 10μM
|
|
GNRHR-1-E |
Gonadotropin-releasing Hormone Receptor (cluster #1 Of 1), Eukaryotic |
Eukaryotes |
3 |
0.33 |
Functional ≤ 10μM
|
|
CP3A4-2-E |
Cytochrome P450 3A4 (cluster #2 Of 4), Eukaryotic |
Eukaryotes |
700 |
0.24 |
ADME/T ≤ 10μM
|
Physical Representations
|
Type
pH range
|
xlogP
|
Des A‑Pol
Apolar desolvation
(kcal/mol)
|
Des Pol
Polar desolvation
(kcal/mol)
|
H Don
H-bond donors
|
H Acc
H-bond acceptors
|
Chg
Net charge
|
tPSA
(Ų)
|
MWT
Molecular weight
(g/mol)
|
RB
Rotatable bonds
|
DL |
|
Ref
Reference (pH 7)
|
2.47 |
1.98 |
-40.61 |
3 |
6 |
1 |
80 |
496.509 |
7 |
↓
|
|
|
|
Analogs
Draw
Identity
99%
90%
80%
70%
Vendors
And 1 More
Clustered Target Annotations
| Code |
Organism Class |
Affinity (nM) |
LE (kcal/mol/atom) |
Type |
|
ABL1-1-E |
Tyrosine-protein Kinase ABL (cluster #1 Of 1), Eukaryotic |
Eukaryotes |
7800 |
0.20 |
Binding ≤ 10μM |
|
AURKA-2-E |
Serine/threonine-protein Kinase Aurora-A (cluster #2 Of 3), Eukaryotic |
Eukaryotes |
290 |
0.26 |
Binding ≤ 10μM |
|
FGFR1-1-E |
Fibroblast Growth Factor Receptor 1 (cluster #1 Of 1), Eukaryotic |
Eukaryotes |
65 |
0.29 |
Binding ≤ 10μM |
|
FGFR2-1-E |
Fibroblast Growth Factor Receptor 2 (cluster #1 Of 1), Eukaryotic |
Eukaryotes |
39 |
0.30 |
Binding ≤ 10μM |
|
FGFR3-1-E |
Fibroblast Growth Factor Receptor 3 (cluster #1 Of 1), Eukaryotic |
Eukaryotes |
50 |
0.29 |
Binding ≤ 10μM |
|
FLT3-1-E |
Tyrosine-protein Kinase Receptor FLT3 (cluster #1 Of 1), Eukaryotic |
Eukaryotes |
22 |
0.31 |
Binding ≤ 10μM |
|
JAK2-1-E |
Tyrosine-protein Kinase JAK2 (cluster #1 Of 1), Eukaryotic |
Eukaryotes |
230 |
0.27 |
Binding ≤ 10μM |
|
MERTK-1-E |
Proto-oncogene Tyrosine-protein Kinase MER (cluster #1 Of 1), Eukaryotic |
Eukaryotes |
24 |
0.30 |
Binding ≤ 10μM |
|
MET-1-E |
Hepatocyte Growth Factor Receptor (cluster #1 Of 1), Eukaryotic |
Eukaryotes |
2 |
0.35 |
Binding ≤ 10μM |
|
NTRK1-1-E |
Nerve Growth Factor Receptor Trk-A (cluster #1 Of 1), Eukaryotic |
Eukaryotes |
46 |
0.29 |
Binding ≤ 10μM |
|
NTRK2-1-E |
Neurotrophic Tyrosine Kinase Receptor Type 2 (cluster #1 Of 1), Eukaryotic |
Eukaryotes |
61 |
0.29 |
Binding ≤ 10μM |
|
PGFRA-1-E |
Platelet-derived Growth Factor Receptor Alpha (cluster #1 Of 2), Eukaryotic |
Eukaryotes |
100 |
0.28 |
Binding ≤ 10μM |
|
RET-1-E |
Tyrosine-protein Kinase Receptor RET (cluster #1 Of 1), Eukaryotic |
Eukaryotes |
640 |
0.25 |
Binding ≤ 10μM |
|
RON-1-E |
Macrophage-stimulating Protein Receptor (cluster #1 Of 1), Eukaryotic |
Eukaryotes |
7 |
0.33 |
Binding ≤ 10μM |
|
VGFR1-1-E |
Vascular Endothelial Growth Factor Receptor 1 (cluster #1 Of 1), Eukaryotic |
Eukaryotes |
10 |
0.32 |
Binding ≤ 10μM |
|
VGFR2-1-E |
Vascular Endothelial Growth Factor Receptor 2 (cluster #1 Of 2), Eukaryotic |
Eukaryotes |
44 |
0.29 |
Binding ≤ 10μM |
|
VGFR3-1-E |
Vascular Endothelial Growth Factor Receptor 3 (cluster #1 Of 2), Eukaryotic |
Eukaryotes |
78 |
0.28 |
Binding ≤ 10μM |
|
CP2C9-1-E |
Cytochrome P450 2C9 (cluster #1 Of 3), Eukaryotic |
Eukaryotes |
1200 |
0.24 |
ADME/T ≤ 10μM |
|
CP3A4-2-E |
Cytochrome P450 3A4 (cluster #2 Of 4), Eukaryotic |
Eukaryotes |
7100 |
0.21 |
ADME/T ≤ 10μM |
|
Z50594-1-O |
Mus Musculus (cluster #1 Of 9), Other |
Other |
1000 |
0.24 |
Functional ≤ 10μM |
Physical Representations
|
Type
pH range
|
xlogP
|
Des A‑Pol
Apolar desolvation
(kcal/mol)
|
Des Pol
Polar desolvation
(kcal/mol)
|
H Don
H-bond donors
|
H Acc
H-bond acceptors
|
Chg
Net charge
|
tPSA
(Ų)
|
MWT
Molecular weight
(g/mol)
|
RB
Rotatable bonds
|
DL |
|
Ref
Reference (pH 7)
|
1.72 |
5.04 |
-16.82 |
1 |
10 |
0 |
116 |
495.561 |
6 |
↓
|
|
Mid
Mid (pH 6-8)
|
1.72 |
5.56 |
-53.48 |
0 |
10 |
-1 |
118 |
494.553 |
6 |
↓
|
|
|
|
Analogs
Draw
Identity
99%
90%
80%
70%
Vendors
And 2 More
Clustered Target Annotations
| Code |
Organism Class |
Affinity (nM) |
LE (kcal/mol/atom) |
Type |
|
HDA10-1-E |
Histone Deacetylase 10 (cluster #1 Of 3), Eukaryotic |
Eukaryotes |
23 |
0.41 |
Binding ≤ 10μM |
|
HDA11-1-E |
Histone Deacetylase 11 (cluster #1 Of 3), Eukaryotic |
Eukaryotes |
24 |
0.41 |
Binding ≤ 10μM |
|
HDAC1-2-E |
Histone Deacetylase 1 (cluster #2 Of 4), Eukaryotic |
Eukaryotes |
77 |
0.38 |
Binding ≤ 10μM |
|
HDAC2-1-E |
Histone Deacetylase 2 (cluster #1 Of 4), Eukaryotic |
Eukaryotes |
27 |
0.41 |
Binding ≤ 10μM |
|
HDAC3-1-E |
Histone Deacetylase 3 (cluster #1 Of 3), Eukaryotic |
Eukaryotes |
19 |
0.42 |
Binding ≤ 10μM |
|
HDAC4-1-E |
Histone Deacetylase 4 (cluster #1 Of 3), Eukaryotic |
Eukaryotes |
16 |
0.42 |
Binding ≤ 10μM |
|
HDAC5-1-E |
Histone Deacetylase 5 (cluster #1 Of 3), Eukaryotic |
Eukaryotes |
21 |
0.41 |
Binding ≤ 10μM |
|
HDAC6-1-E |
Histone Deacetylase 6 (cluster #1 Of 3), Eukaryotic |
Eukaryotes |
247 |
0.36 |
Binding ≤ 10μM |
|
HDAC7-1-E |
Histone Deacetylase 7 (cluster #1 Of 3), Eukaryotic |
Eukaryotes |
104 |
0.38 |
Binding ≤ 10μM |
|
HDAC8-1-E |
Histone Deacetylase 8 (cluster #1 Of 4), Eukaryotic |
Eukaryotes |
48 |
0.39 |
Binding ≤ 10μM |
|
HDAC9-1-E |
Histone Deacetylase 9 (cluster #1 Of 3), Eukaryotic |
Eukaryotes |
24 |
0.41 |
Binding ≤ 10μM |
|
CP2CJ-1-E |
Cytochrome P450 2C19 (cluster #1 Of 3), Eukaryotic |
Eukaryotes |
5780 |
0.28 |
ADME/T ≤ 10μM |
|
CP3A4-2-E |
Cytochrome P450 3A4 (cluster #2 Of 4), Eukaryotic |
Eukaryotes |
2730 |
0.30 |
ADME/T ≤ 10μM |
|
Z100405-1-O |
MV4-11 (Myeloid Leukemia Cells) (cluster #1 Of 1), Other |
Other |
100 |
0.38 |
Functional ≤ 10μM |
|
Z80390-1-O |
PC-3 (Prostate Carcinoma Cells) (cluster #1 Of 10), Other |
Other |
340 |
0.35 |
Functional ≤ 10μM |
|
Z80415-1-O |
Ramos (Burkitts Lymhoma B-cells) (cluster #1 Of 1), Other |
Other |
140 |
0.37 |
Functional ≤ 10μM |
|
Z80928-3-O |
HCT-116 (Colon Carcinoma Cells) (cluster #3 Of 9), Other |
Other |
480 |
0.34 |
Functional ≤ 10μM |
|
Z81034-6-O |
A2780 (Ovarian Carcinoma Cells) (cluster #6 Of 10), Other |
Other |
480 |
0.34 |
Functional ≤ 10μM |
Physical Representations
|
Type
pH range
|
xlogP
|
Des A‑Pol
Apolar desolvation
(kcal/mol)
|
Des Pol
Polar desolvation
(kcal/mol)
|
H Don
H-bond donors
|
H Acc
H-bond acceptors
|
Chg
Net charge
|
tPSA
(Ų)
|
MWT
Molecular weight
(g/mol)
|
RB
Rotatable bonds
|
DL |
|
Ref
Reference (pH 7)
|
3.49 |
9.6 |
-62.75 |
3 |
6 |
1 |
72 |
359.494 |
10 |
↓
|
|
Hi
High (pH 8-9.5)
|
3.49 |
7.49 |
-18.21 |
2 |
6 |
0 |
70 |
358.486 |
10 |
↓
|
|
Lo
Low (pH 4.5-6)
|
3.49 |
9.9 |
-112.62 |
4 |
6 |
2 |
73 |
360.502 |
10 |
↓
|
|