|
|
Analogs
Draw
Identity
99%
90%
80%
70%
Vendors
Clustered Target Annotations
| Code |
Organism Class |
Affinity (nM) |
LE (kcal/mol/atom) |
Type |
|
MIF-1-E |
Macrophage Migration Inhibitory Factor (cluster #1 Of 3), Eukaryotic |
Eukaryotes |
2600 |
0.60 |
Binding ≤ 10μM
|
Physical Representations
|
Type
pH range
|
xlogP
|
Des A‑Pol
Apolar desolvation
(kcal/mol)
|
Des Pol
Polar desolvation
(kcal/mol)
|
H Don
H-bond donors
|
H Acc
H-bond acceptors
|
Chg
Net charge
|
tPSA
(Ų)
|
MWT
Molecular weight
(g/mol)
|
RB
Rotatable bonds
|
DL |
|
Ref
Reference (pH 7)
|
1.34 |
2.54 |
-55.25 |
1 |
3 |
-1 |
60 |
181.142 |
2 |
↓
|
|
|
|
Analogs
Draw
Identity
99%
90%
80%
70%
Vendors
And 5 More
Clustered Target Annotations
| Code |
Organism Class |
Affinity (nM) |
LE (kcal/mol/atom) |
Type |
|
MIF-2-E |
Macrophage Migration Inhibitory Factor (cluster #2 Of 3), Eukaryotic |
Eukaryotes |
1040 |
0.49 |
Binding ≤ 10μM |
Physical Representations
|
Type
pH range
|
xlogP
|
Des A‑Pol
Apolar desolvation
(kcal/mol)
|
Des Pol
Polar desolvation
(kcal/mol)
|
H Don
H-bond donors
|
H Acc
H-bond acceptors
|
Chg
Net charge
|
tPSA
(Ų)
|
MWT
Molecular weight
(g/mol)
|
RB
Rotatable bonds
|
DL |
|
Ref
Reference (pH 7)
|
2.78 |
8.48 |
-11.91 |
2 |
3 |
0 |
37 |
263.753 |
4 |
↓
|
|
|
|
Analogs
Draw
Identity
99%
90%
80%
70%
Vendors
And 1 More
Clustered Target Annotations
| Code |
Organism Class |
Affinity (nM) |
LE (kcal/mol/atom) |
Type |
|
MIF-3-E |
Macrophage Migration Inhibitory Factor (cluster #3 Of 3), Eukaryotic |
Eukaryotes |
50 |
0.51 |
Binding ≤ 10μM |
Physical Representations
|
Type
pH range
|
xlogP
|
Des A‑Pol
Apolar desolvation
(kcal/mol)
|
Des Pol
Polar desolvation
(kcal/mol)
|
H Don
H-bond donors
|
H Acc
H-bond acceptors
|
Chg
Net charge
|
tPSA
(Ų)
|
MWT
Molecular weight
(g/mol)
|
RB
Rotatable bonds
|
DL |
|
Ref
Reference (pH 7)
|
3.85 |
1.09 |
-16.23 |
0 |
4 |
0 |
52 |
282.324 |
4 |
↓
|
|
|
|
Analogs
Draw
Identity
99%
90%
80%
70%
Vendors
And 4 More
Clustered Target Annotations
| Code |
Organism Class |
Affinity (nM) |
LE (kcal/mol/atom) |
Type |
|
MIF-2-E |
Macrophage Migration Inhibitory Factor (cluster #2 Of 3), Eukaryotic |
Eukaryotes |
420 |
0.60 |
Binding ≤ 10μM |
Physical Representations
|
Type
pH range
|
xlogP
|
Des A‑Pol
Apolar desolvation
(kcal/mol)
|
Des Pol
Polar desolvation
(kcal/mol)
|
H Don
H-bond donors
|
H Acc
H-bond acceptors
|
Chg
Net charge
|
tPSA
(Ų)
|
MWT
Molecular weight
(g/mol)
|
RB
Rotatable bonds
|
DL |
|
Ref
Reference (pH 7)
|
1.76 |
5.78 |
-17.53 |
2 |
4 |
0 |
50 |
236.325 |
4 |
↓
|
|
|
|
Analogs
Draw
Identity
99%
90%
80%
70%
Vendors
Clustered Target Annotations
| Code |
Organism Class |
Affinity (nM) |
LE (kcal/mol/atom) |
Type |
|
MIF-1-E |
Macrophage Migration Inhibitory Factor (cluster #1 Of 3), Eukaryotic |
Eukaryotes |
80 |
0.58 |
Binding ≤ 10μM |
Physical Representations
|
Type
pH range
|
xlogP
|
Des A‑Pol
Apolar desolvation
(kcal/mol)
|
Des Pol
Polar desolvation
(kcal/mol)
|
H Don
H-bond donors
|
H Acc
H-bond acceptors
|
Chg
Net charge
|
tPSA
(Ų)
|
MWT
Molecular weight
(g/mol)
|
RB
Rotatable bonds
|
DL |
|
Ref
Reference (pH 7)
|
3.74 |
5.59 |
-10.07 |
0 |
4 |
0 |
52 |
251.307 |
6 |
↓
|
|
|
|
Analogs
Draw
Identity
99%
90%
80%
70%
Vendors
And 3 More
Clustered Target Annotations
| Code |
Organism Class |
Affinity (nM) |
LE (kcal/mol/atom) |
Type |
|
MIF-1-E |
Macrophage Migration Inhibitory Factor (cluster #1 Of 3), Eukaryotic |
Eukaryotes |
4200 |
0.38 |
Binding ≤ 10μM |
Physical Representations
|
Type
pH range
|
xlogP
|
Des A‑Pol
Apolar desolvation
(kcal/mol)
|
Des Pol
Polar desolvation
(kcal/mol)
|
H Don
H-bond donors
|
H Acc
H-bond acceptors
|
Chg
Net charge
|
tPSA
(Ų)
|
MWT
Molecular weight
(g/mol)
|
RB
Rotatable bonds
|
DL |
|
Ref
Reference (pH 7)
|
4.00 |
2.08 |
-9.12 |
1 |
4 |
0 |
55 |
354.587 |
4 |
↓
|
|
|
|
Analogs
Draw
Identity
99%
90%
80%
70%
Notice: Undefined index: field_name in /domains/zinc12/htdocs/lib/zinc/reporter/ZincAuxiliaryInfoReports.php on line 244
Notice: Undefined index: synonym in /domains/zinc12/htdocs/lib/zinc/reporter/ZincAuxiliaryInfoReports.php on line 245
Vendors
And 13 More
Clustered Target Annotations
| Code |
Organism Class |
Affinity (nM) |
LE (kcal/mol/atom) |
Type |
|
MIF-1-E |
Macrophage Migration Inhibitory Factor (cluster #1 Of 3), Eukaryotic |
Eukaryotes |
6900 |
0.38 |
Binding ≤ 10μM |
Physical Representations
|
Type
pH range
|
xlogP
|
Des A‑Pol
Apolar desolvation
(kcal/mol)
|
Des Pol
Polar desolvation
(kcal/mol)
|
H Don
H-bond donors
|
H Acc
H-bond acceptors
|
Chg
Net charge
|
tPSA
(Ų)
|
MWT
Molecular weight
(g/mol)
|
RB
Rotatable bonds
|
DL |
|
Ref
Reference (pH 7)
|
2.84 |
2.11 |
-12.78 |
0 |
5 |
0 |
57 |
253.261 |
2 |
↓
|
|
|
|
Analogs
Draw
Identity
99%
90%
80%
70%
Vendors
And 1 More
Clustered Target Annotations
| Code |
Organism Class |
Affinity (nM) |
LE (kcal/mol/atom) |
Type |
|
MIF-3-E |
Macrophage Migration Inhibitory Factor (cluster #3 Of 3), Eukaryotic |
Eukaryotes |
9500 |
0.31 |
Binding ≤ 10μM |
Physical Representations
|
Type
pH range
|
xlogP
|
Des A‑Pol
Apolar desolvation
(kcal/mol)
|
Des Pol
Polar desolvation
(kcal/mol)
|
H Don
H-bond donors
|
H Acc
H-bond acceptors
|
Chg
Net charge
|
tPSA
(Ų)
|
MWT
Molecular weight
(g/mol)
|
RB
Rotatable bonds
|
DL |
|
Ref
Reference (pH 7)
|
5.61 |
3.34 |
-48.14 |
0 |
7 |
-1 |
106 |
402.402 |
5 |
↓
|
|
|
|
Analogs
-
37011532
-
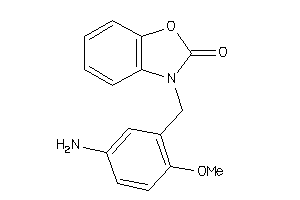
Draw
Identity
99%
90%
80%
70%
Vendors
And 5 More
Clustered Target Annotations
| Code |
Organism Class |
Affinity (nM) |
LE (kcal/mol/atom) |
Type |
|
HG2A-1-E |
HLA-DR Antigens-associated Invariant Chain (cluster #1 Of 1), Eukaryotic |
Eukaryotes |
90 |
0.49 |
Binding ≤ 10μM
|
|
MIF-1-E |
Macrophage Migration Inhibitory Factor (cluster #1 Of 3), Eukaryotic |
Eukaryotes |
90 |
0.49 |
Binding ≤ 10μM
|
Physical Representations
|
Type
pH range
|
xlogP
|
Des A‑Pol
Apolar desolvation
(kcal/mol)
|
Des Pol
Polar desolvation
(kcal/mol)
|
H Don
H-bond donors
|
H Acc
H-bond acceptors
|
Chg
Net charge
|
tPSA
(Ų)
|
MWT
Molecular weight
(g/mol)
|
RB
Rotatable bonds
|
DL |
|
Ref
Reference (pH 7)
|
3.27 |
9.18 |
-12.06 |
0 |
4 |
0 |
44 |
269.3 |
3 |
↓
|
|
|
|
Analogs
Draw
Identity
99%
90%
80%
70%
Vendors
And 3 More
Clustered Target Annotations
| Code |
Organism Class |
Affinity (nM) |
LE (kcal/mol/atom) |
Type |
|
MIF-1-E |
Macrophage Migration Inhibitory Factor (cluster #1 Of 3), Eukaryotic |
Eukaryotes |
38 |
0.52 |
Binding ≤ 10μM
|
|
TYRO-1-E |
Tyrosinase (cluster #1 Of 2), Eukaryotic |
Eukaryotes |
5230 |
0.37 |
Binding ≤ 10μM
|
|
Z50420-1-O |
Trypanosoma Brucei Brucei (cluster #1 Of 7), Other |
Other |
7100 |
0.36 |
Functional ≤ 10μM
|
Physical Representations
|
Type
pH range
|
xlogP
|
Des A‑Pol
Apolar desolvation
(kcal/mol)
|
Des Pol
Polar desolvation
(kcal/mol)
|
H Don
H-bond donors
|
H Acc
H-bond acceptors
|
Chg
Net charge
|
tPSA
(Ų)
|
MWT
Molecular weight
(g/mol)
|
RB
Rotatable bonds
|
DL |
|
Ref
Reference (pH 7)
|
2.07 |
-3.11 |
-13.08 |
3 |
5 |
0 |
90 |
270.24 |
1 |
↓
|
|
|
|
|
|
|
Analogs
Draw
Identity
99%
90%
80%
70%
Vendors
And 19 More
Clustered Target Annotations
| Code |
Organism Class |
Affinity (nM) |
LE (kcal/mol/atom) |
Type |
|
MIF-1-E |
Macrophage Migration Inhibitory Factor (cluster #1 Of 3), Eukaryotic |
Eukaryotes |
2900 |
0.55 |
Binding ≤ 10μM
|
Physical Representations
|
Type
pH range
|
xlogP
|
Des A‑Pol
Apolar desolvation
(kcal/mol)
|
Des Pol
Polar desolvation
(kcal/mol)
|
H Don
H-bond donors
|
H Acc
H-bond acceptors
|
Chg
Net charge
|
tPSA
(Ų)
|
MWT
Molecular weight
(g/mol)
|
RB
Rotatable bonds
|
DL |
|
Ref
Reference (pH 7)
|
1.19 |
3.53 |
-16.09 |
1 |
4 |
0 |
74 |
187.154 |
0 |
↓
|
|
|
|
Analogs
Draw
Identity
99%
90%
80%
70%
Vendors
And 1 More
Clustered Target Annotations
| Code |
Organism Class |
Affinity (nM) |
LE (kcal/mol/atom) |
Type |
|
MIF-3-E |
Macrophage Migration Inhibitory Factor (cluster #3 Of 3), Eukaryotic |
Eukaryotes |
6200 |
0.33 |
Binding ≤ 10μM
|
Physical Representations
|
Type
pH range
|
xlogP
|
Des A‑Pol
Apolar desolvation
(kcal/mol)
|
Des Pol
Polar desolvation
(kcal/mol)
|
H Don
H-bond donors
|
H Acc
H-bond acceptors
|
Chg
Net charge
|
tPSA
(Ų)
|
MWT
Molecular weight
(g/mol)
|
RB
Rotatable bonds
|
DL |
|
Ref
Reference (pH 7)
|
2.89 |
9.53 |
-11.08 |
0 |
4 |
0 |
51 |
293.322 |
2 |
↓
|
|
|
|
Analogs
-
195518
-
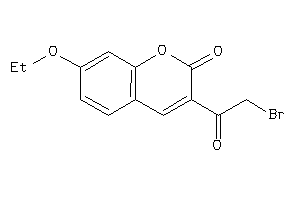
-
5825203
-
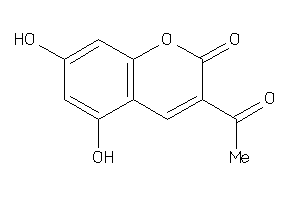
Draw
Identity
99%
90%
80%
70%
Vendors
And 26 More
Clustered Target Annotations
| Code |
Organism Class |
Affinity (nM) |
LE (kcal/mol/atom) |
Type |
|
MIF-1-E |
Macrophage Migration Inhibitory Factor (cluster #1 Of 3), Eukaryotic |
Eukaryotes |
4300 |
0.50 |
Binding ≤ 10μM
|
Physical Representations
|
Type
pH range
|
xlogP
|
Des A‑Pol
Apolar desolvation
(kcal/mol)
|
Des Pol
Polar desolvation
(kcal/mol)
|
H Don
H-bond donors
|
H Acc
H-bond acceptors
|
Chg
Net charge
|
tPSA
(Ų)
|
MWT
Molecular weight
(g/mol)
|
RB
Rotatable bonds
|
DL |
|
Ref
Reference (pH 7)
|
1.34 |
3.46 |
-10.14 |
1 |
4 |
0 |
68 |
204.181 |
1 |
↓
|
|
Hi
High (pH 8-9.5)
|
1.34 |
4.2 |
-36.62 |
0 |
4 |
-1 |
70 |
203.173 |
1 |
↓
|
|
|
|
Analogs
-
25756810
-
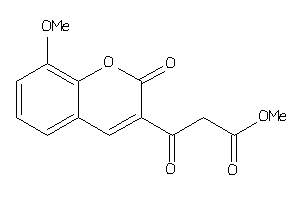
Draw
Identity
99%
90%
80%
70%
Vendors
Clustered Target Annotations
| Code |
Organism Class |
Affinity (nM) |
LE (kcal/mol/atom) |
Type |
|
MIF-1-E |
Macrophage Migration Inhibitory Factor (cluster #1 Of 3), Eukaryotic |
Eukaryotes |
5800 |
0.37 |
Binding ≤ 10μM
|
Physical Representations
|
Type
pH range
|
xlogP
|
Des A‑Pol
Apolar desolvation
(kcal/mol)
|
Des Pol
Polar desolvation
(kcal/mol)
|
H Don
H-bond donors
|
H Acc
H-bond acceptors
|
Chg
Net charge
|
tPSA
(Ų)
|
MWT
Molecular weight
(g/mol)
|
RB
Rotatable bonds
|
DL |
|
Ref
Reference (pH 7)
|
1.16 |
6.68 |
-34.39 |
1 |
6 |
0 |
94 |
276.244 |
5 |
↓
|
|
Mid
Mid (pH 6-8)
|
1.16 |
7.48 |
-59.82 |
0 |
6 |
-1 |
97 |
275.236 |
5 |
↓
|
|
|
|
Analogs
-
38418848
-
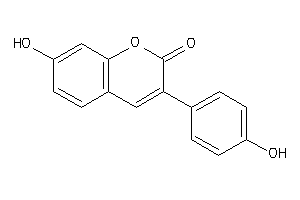
Draw
Identity
99%
90%
80%
70%
Vendors
And 18 More
Clustered Target Annotations
| Code |
Organism Class |
Affinity (nM) |
LE (kcal/mol/atom) |
Type |
|
MIF-1-E |
Macrophage Migration Inhibitory Factor (cluster #1 Of 3), Eukaryotic |
Eukaryotes |
470 |
0.49 |
Binding ≤ 10μM
|
Physical Representations
|
Type
pH range
|
xlogP
|
Des A‑Pol
Apolar desolvation
(kcal/mol)
|
Des Pol
Polar desolvation
(kcal/mol)
|
H Don
H-bond donors
|
H Acc
H-bond acceptors
|
Chg
Net charge
|
tPSA
(Ų)
|
MWT
Molecular weight
(g/mol)
|
RB
Rotatable bonds
|
DL |
|
Ref
Reference (pH 7)
|
3.23 |
6.68 |
-12.44 |
1 |
3 |
0 |
50 |
238.242 |
1 |
↓
|
|
|
|
|
|
|
|
|
|
Analogs
-
4959624
-
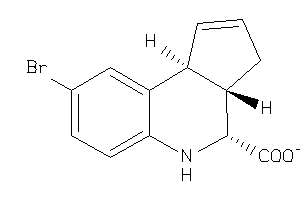
-
4959625
-
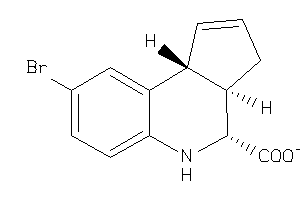
-
196523
-
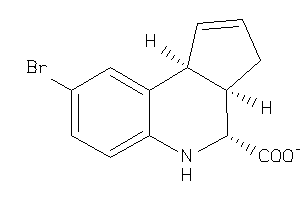
Draw
Identity
99%
90%
80%
70%
Vendors
And 4 More
Clustered Target Annotations
| Code |
Organism Class |
Affinity (nM) |
LE (kcal/mol/atom) |
Type |
|
MIF-3-E |
Macrophage Migration Inhibitory Factor (cluster #3 Of 3), Eukaryotic |
Eukaryotes |
3400 |
0.45 |
Binding ≤ 10μM
|
Physical Representations
|
Type
pH range
|
xlogP
|
Des A‑Pol
Apolar desolvation
(kcal/mol)
|
Des Pol
Polar desolvation
(kcal/mol)
|
H Don
H-bond donors
|
H Acc
H-bond acceptors
|
Chg
Net charge
|
tPSA
(Ų)
|
MWT
Molecular weight
(g/mol)
|
RB
Rotatable bonds
|
DL |
|
Ref
Reference (pH 7)
|
1.83 |
7.34 |
-42.74 |
1 |
3 |
-1 |
52 |
293.14 |
1 |
↓
|
|
|
|
Analogs
-
4959625
-

-
196523
-

Draw
Identity
99%
90%
80%
70%
Vendors
And 4 More
Clustered Target Annotations
| Code |
Organism Class |
Affinity (nM) |
LE (kcal/mol/atom) |
Type |
|
MIF-3-E |
Macrophage Migration Inhibitory Factor (cluster #3 Of 3), Eukaryotic |
Eukaryotes |
3400 |
0.45 |
Binding ≤ 10μM
|
Physical Representations
|
Type
pH range
|
xlogP
|
Des A‑Pol
Apolar desolvation
(kcal/mol)
|
Des Pol
Polar desolvation
(kcal/mol)
|
H Don
H-bond donors
|
H Acc
H-bond acceptors
|
Chg
Net charge
|
tPSA
(Ų)
|
MWT
Molecular weight
(g/mol)
|
RB
Rotatable bonds
|
DL |
|
Ref
Reference (pH 7)
|
1.83 |
7.11 |
-44.13 |
1 |
3 |
-1 |
52 |
293.14 |
1 |
↓
|
|
|
|
Analogs
-
196523
-

Draw
Identity
99%
90%
80%
70%
Vendors
And 4 More
Clustered Target Annotations
| Code |
Organism Class |
Affinity (nM) |
LE (kcal/mol/atom) |
Type |
|
MIF-3-E |
Macrophage Migration Inhibitory Factor (cluster #3 Of 3), Eukaryotic |
Eukaryotes |
3400 |
0.45 |
Binding ≤ 10μM
|
Physical Representations
|
Type
pH range
|
xlogP
|
Des A‑Pol
Apolar desolvation
(kcal/mol)
|
Des Pol
Polar desolvation
(kcal/mol)
|
H Don
H-bond donors
|
H Acc
H-bond acceptors
|
Chg
Net charge
|
tPSA
(Ų)
|
MWT
Molecular weight
(g/mol)
|
RB
Rotatable bonds
|
DL |
|
Ref
Reference (pH 7)
|
1.83 |
7.3 |
-41.84 |
1 |
3 |
-1 |
52 |
293.14 |
1 |
↓
|
|
|
|
Analogs
-
11628959
-
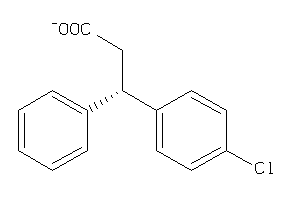
-
11628960
-
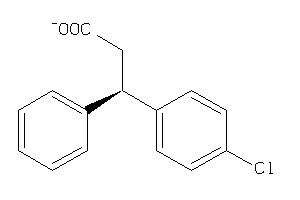
Draw
Identity
99%
90%
80%
70%
Vendors
And 11 More
Clustered Target Annotations
| Code |
Organism Class |
Affinity (nM) |
LE (kcal/mol/atom) |
Type |
|
MIF-2-E |
Macrophage Migration Inhibitory Factor (cluster #2 Of 3), Eukaryotic |
Eukaryotes |
8100 |
0.27 |
Binding ≤ 10μM
|
Physical Representations
|
Type
pH range
|
xlogP
|
Des A‑Pol
Apolar desolvation
(kcal/mol)
|
Des Pol
Polar desolvation
(kcal/mol)
|
H Don
H-bond donors
|
H Acc
H-bond acceptors
|
Chg
Net charge
|
tPSA
(Ų)
|
MWT
Molecular weight
(g/mol)
|
RB
Rotatable bonds
|
DL |
|
Ref
Reference (pH 7)
|
6.72 |
12.93 |
-42.14 |
0 |
2 |
-1 |
40 |
404.7 |
5 |
↓
|
|
|
|
Analogs
-
8205362
-
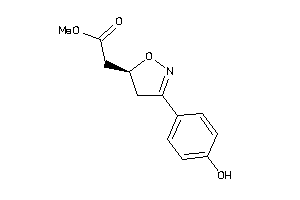
Draw
Identity
99%
90%
80%
70%
Vendors
Clustered Target Annotations
| Code |
Organism Class |
Affinity (nM) |
LE (kcal/mol/atom) |
Type |
|
MIF-1-E |
Macrophage Migration Inhibitory Factor (cluster #1 Of 3), Eukaryotic |
Eukaryotes |
7000 |
0.42 |
Binding ≤ 10μM
|
Physical Representations
|
Type
pH range
|
xlogP
|
Des A‑Pol
Apolar desolvation
(kcal/mol)
|
Des Pol
Polar desolvation
(kcal/mol)
|
H Don
H-bond donors
|
H Acc
H-bond acceptors
|
Chg
Net charge
|
tPSA
(Ų)
|
MWT
Molecular weight
(g/mol)
|
RB
Rotatable bonds
|
DL |
|
Ref
Reference (pH 7)
|
1.27 |
3.73 |
-15.8 |
1 |
5 |
0 |
68 |
235.239 |
4 |
↓
|
|
|
|
Analogs
Draw
Identity
99%
90%
80%
70%
Vendors
Clustered Target Annotations
| Code |
Organism Class |
Affinity (nM) |
LE (kcal/mol/atom) |
Type |
|
MIF-1-E |
Macrophage Migration Inhibitory Factor (cluster #1 Of 3), Eukaryotic |
Eukaryotes |
8000 |
0.32 |
Binding ≤ 10μM
|
Physical Representations
|
Type
pH range
|
xlogP
|
Des A‑Pol
Apolar desolvation
(kcal/mol)
|
Des Pol
Polar desolvation
(kcal/mol)
|
H Don
H-bond donors
|
H Acc
H-bond acceptors
|
Chg
Net charge
|
tPSA
(Ų)
|
MWT
Molecular weight
(g/mol)
|
RB
Rotatable bonds
|
DL |
|
Ref
Reference (pH 7)
|
3.09 |
3.63 |
-15.66 |
2 |
6 |
0 |
80 |
300.314 |
6 |
↓
|
|
|
|
Analogs
-
33678067
-
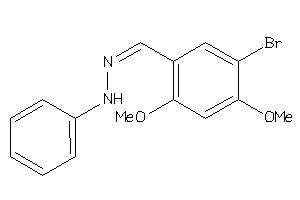
Draw
Identity
99%
90%
80%
70%
Vendors
Clustered Target Annotations
| Code |
Organism Class |
Affinity (nM) |
LE (kcal/mol/atom) |
Type |
|
MIF-1-E |
Macrophage Migration Inhibitory Factor (cluster #1 Of 3), Eukaryotic |
Eukaryotes |
330 |
0.48 |
Binding ≤ 10μM
|
Physical Representations
|
Type
pH range
|
xlogP
|
Des A‑Pol
Apolar desolvation
(kcal/mol)
|
Des Pol
Polar desolvation
(kcal/mol)
|
H Don
H-bond donors
|
H Acc
H-bond acceptors
|
Chg
Net charge
|
tPSA
(Ų)
|
MWT
Molecular weight
(g/mol)
|
RB
Rotatable bonds
|
DL |
|
Ref
Reference (pH 7)
|
5.34 |
5.01 |
-8.01 |
2 |
4 |
0 |
54 |
321.174 |
4 |
↓
|
|
Mid
Mid (pH 6-8)
|
5.34 |
5.64 |
-42.24 |
1 |
4 |
-1 |
57 |
320.166 |
4 |
↓
|
|
|
|
Analogs
Draw
Identity
99%
90%
80%
70%
Vendors
Clustered Target Annotations
| Code |
Organism Class |
Affinity (nM) |
LE (kcal/mol/atom) |
Type |
|
MIF-2-E |
Macrophage Migration Inhibitory Factor (cluster #2 Of 3), Eukaryotic |
Eukaryotes |
220 |
0.49 |
Binding ≤ 10μM
|
Physical Representations
|
Type
pH range
|
xlogP
|
Des A‑Pol
Apolar desolvation
(kcal/mol)
|
Des Pol
Polar desolvation
(kcal/mol)
|
H Don
H-bond donors
|
H Acc
H-bond acceptors
|
Chg
Net charge
|
tPSA
(Ų)
|
MWT
Molecular weight
(g/mol)
|
RB
Rotatable bonds
|
DL |
|
Ref
Reference (pH 7)
|
5.21 |
4.89 |
-8.3 |
2 |
4 |
0 |
54 |
276.723 |
4 |
↓
|
|
Hi
High (pH 8-9.5)
|
5.21 |
5.53 |
-43.21 |
1 |
4 |
-1 |
57 |
275.715 |
4 |
↓
|
|
|
|
Analogs
Draw
Identity
99%
90%
80%
70%
Vendors
And 1 More
Clustered Target Annotations
| Code |
Organism Class |
Affinity (nM) |
LE (kcal/mol/atom) |
Type |
|
MIF-1-E |
Macrophage Migration Inhibitory Factor (cluster #1 Of 3), Eukaryotic |
Eukaryotes |
2600 |
0.49 |
Binding ≤ 10μM
|
Physical Representations
|
Type
pH range
|
xlogP
|
Des A‑Pol
Apolar desolvation
(kcal/mol)
|
Des Pol
Polar desolvation
(kcal/mol)
|
H Don
H-bond donors
|
H Acc
H-bond acceptors
|
Chg
Net charge
|
tPSA
(Ų)
|
MWT
Molecular weight
(g/mol)
|
RB
Rotatable bonds
|
DL |
|
Ref
Reference (pH 7)
|
4.28 |
4.91 |
-7.07 |
2 |
3 |
0 |
45 |
212.252 |
3 |
↓
|
|
|
|
Analogs
Draw
Identity
99%
90%
80%
70%
Vendors
Clustered Target Annotations
| Code |
Organism Class |
Affinity (nM) |
LE (kcal/mol/atom) |
Type |
|
MIF-1-E |
Macrophage Migration Inhibitory Factor (cluster #1 Of 3), Eukaryotic |
Eukaryotes |
480 |
0.49 |
Binding ≤ 10μM
|
Physical Representations
|
Type
pH range
|
xlogP
|
Des A‑Pol
Apolar desolvation
(kcal/mol)
|
Des Pol
Polar desolvation
(kcal/mol)
|
H Don
H-bond donors
|
H Acc
H-bond acceptors
|
Chg
Net charge
|
tPSA
(Ų)
|
MWT
Molecular weight
(g/mol)
|
RB
Rotatable bonds
|
DL |
|
Ref
Reference (pH 7)
|
4.34 |
4.19 |
-10.61 |
2 |
4 |
0 |
54 |
242.278 |
4 |
↓
|
|
|
|
Analogs
Draw
Identity
99%
90%
80%
70%
Vendors
And 1 More
Clustered Target Annotations
| Code |
Organism Class |
Affinity (nM) |
LE (kcal/mol/atom) |
Type |
|
MIF-1-E |
Macrophage Migration Inhibitory Factor (cluster #1 Of 3), Eukaryotic |
Eukaryotes |
2100 |
0.44 |
Binding ≤ 10μM
|
Physical Representations
|
Type
pH range
|
xlogP
|
Des A‑Pol
Apolar desolvation
(kcal/mol)
|
Des Pol
Polar desolvation
(kcal/mol)
|
H Don
H-bond donors
|
H Acc
H-bond acceptors
|
Chg
Net charge
|
tPSA
(Ų)
|
MWT
Molecular weight
(g/mol)
|
RB
Rotatable bonds
|
DL |
|
Ref
Reference (pH 7)
|
1.76 |
-0.67 |
-11.6 |
1 |
4 |
0 |
63 |
259.286 |
1 |
↓
|
|
|
|
Analogs
Draw
Identity
99%
90%
80%
70%
Vendors
Clustered Target Annotations
| Code |
Organism Class |
Affinity (nM) |
LE (kcal/mol/atom) |
Type |
|
MIF-1-E |
Macrophage Migration Inhibitory Factor (cluster #1 Of 3), Eukaryotic |
Eukaryotes |
3100 |
0.43 |
Binding ≤ 10μM
|
Physical Representations
|
Type
pH range
|
xlogP
|
Des A‑Pol
Apolar desolvation
(kcal/mol)
|
Des Pol
Polar desolvation
(kcal/mol)
|
H Don
H-bond donors
|
H Acc
H-bond acceptors
|
Chg
Net charge
|
tPSA
(Ų)
|
MWT
Molecular weight
(g/mol)
|
RB
Rotatable bonds
|
DL |
|
Ref
Reference (pH 7)
|
2.51 |
-0.55 |
-17.69 |
1 |
4 |
0 |
63 |
259.286 |
1 |
↓
|
|
|
|
Analogs
Draw
Identity
99%
90%
80%
70%
Vendors
And 7 More
Clustered Target Annotations
| Code |
Organism Class |
Affinity (nM) |
LE (kcal/mol/atom) |
Type |
|
MIF-1-E |
Macrophage Migration Inhibitory Factor (cluster #1 Of 3), Eukaryotic |
Eukaryotes |
550 |
0.58 |
Binding ≤ 10μM
|
Physical Representations
|
Type
pH range
|
xlogP
|
Des A‑Pol
Apolar desolvation
(kcal/mol)
|
Des Pol
Polar desolvation
(kcal/mol)
|
H Don
H-bond donors
|
H Acc
H-bond acceptors
|
Chg
Net charge
|
tPSA
(Ų)
|
MWT
Molecular weight
(g/mol)
|
RB
Rotatable bonds
|
DL |
|
Ref
Reference (pH 7)
|
1.24 |
2.36 |
-12.13 |
3 |
4 |
0 |
76 |
221.237 |
1 |
↓
|
|
Hi
High (pH 8-9.5)
|
1.24 |
3.13 |
-35.66 |
2 |
4 |
-1 |
79 |
220.229 |
1 |
↓
|
|
|
|
Analogs
-
10449375
-
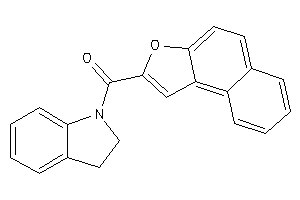
Draw
Identity
99%
90%
80%
70%
Vendors
And 1 More
Clustered Target Annotations
| Code |
Organism Class |
Affinity (nM) |
LE (kcal/mol/atom) |
Type |
|
MIF-1-E |
Macrophage Migration Inhibitory Factor (cluster #1 Of 3), Eukaryotic |
Eukaryotes |
4000 |
0.38 |
Binding ≤ 10μM
|
Physical Representations
|
Type
pH range
|
xlogP
|
Des A‑Pol
Apolar desolvation
(kcal/mol)
|
Des Pol
Polar desolvation
(kcal/mol)
|
H Don
H-bond donors
|
H Acc
H-bond acceptors
|
Chg
Net charge
|
tPSA
(Ų)
|
MWT
Molecular weight
(g/mol)
|
RB
Rotatable bonds
|
DL |
|
Ref
Reference (pH 7)
|
3.63 |
1.32 |
-10.19 |
0 |
3 |
0 |
33 |
263.296 |
1 |
↓
|
|
|
|
Analogs
Draw
Identity
99%
90%
80%
70%
Vendors
And 4 More
Clustered Target Annotations
| Code |
Organism Class |
Affinity (nM) |
LE (kcal/mol/atom) |
Type |
|
MIF-1-E |
Macrophage Migration Inhibitory Factor (cluster #1 Of 3), Eukaryotic |
Eukaryotes |
8000 |
0.36 |
Binding ≤ 10μM
|
Physical Representations
|
Type
pH range
|
xlogP
|
Des A‑Pol
Apolar desolvation
(kcal/mol)
|
Des Pol
Polar desolvation
(kcal/mol)
|
H Don
H-bond donors
|
H Acc
H-bond acceptors
|
Chg
Net charge
|
tPSA
(Ų)
|
MWT
Molecular weight
(g/mol)
|
RB
Rotatable bonds
|
DL |
|
Ref
Reference (pH 7)
|
3.65 |
4.34 |
-11.5 |
2 |
3 |
0 |
53 |
263.296 |
2 |
↓
|
|
|
|
Analogs
Draw
Identity
99%
90%
80%
70%
Vendors
Clustered Target Annotations
| Code |
Organism Class |
Affinity (nM) |
LE (kcal/mol/atom) |
Type |
|
MIF-2-E |
Macrophage Migration Inhibitory Factor (cluster #2 Of 3), Eukaryotic |
Eukaryotes |
4500 |
0.58 |
Binding ≤ 10μM
|
Physical Representations
|
Type
pH range
|
xlogP
|
Des A‑Pol
Apolar desolvation
(kcal/mol)
|
Des Pol
Polar desolvation
(kcal/mol)
|
H Don
H-bond donors
|
H Acc
H-bond acceptors
|
Chg
Net charge
|
tPSA
(Ų)
|
MWT
Molecular weight
(g/mol)
|
RB
Rotatable bonds
|
DL |
|
Ref
Reference (pH 7)
|
3.11 |
-0.53 |
-4.79 |
0 |
2 |
0 |
25 |
282.084 |
1 |
↓
|
|
|
|
Analogs
Draw
Identity
99%
90%
80%
70%
Vendors
Clustered Target Annotations
| Code |
Organism Class |
Affinity (nM) |
LE (kcal/mol/atom) |
Type |
|
MIF-1-E |
Macrophage Migration Inhibitory Factor (cluster #1 Of 3), Eukaryotic |
Eukaryotes |
2500 |
0.30 |
Binding ≤ 10μM
|
Physical Representations
|
Type
pH range
|
xlogP
|
Des A‑Pol
Apolar desolvation
(kcal/mol)
|
Des Pol
Polar desolvation
(kcal/mol)
|
H Don
H-bond donors
|
H Acc
H-bond acceptors
|
Chg
Net charge
|
tPSA
(Ų)
|
MWT
Molecular weight
(g/mol)
|
RB
Rotatable bonds
|
DL |
|
Ref
Reference (pH 7)
|
3.63 |
-2.09 |
-11.29 |
2 |
4 |
0 |
58 |
345.377 |
4 |
↓
|
|
|
|
Analogs
Draw
Identity
99%
90%
80%
70%
Vendors
Clustered Target Annotations
| Code |
Organism Class |
Affinity (nM) |
LE (kcal/mol/atom) |
Type |
|
MIF-1-E |
Macrophage Migration Inhibitory Factor (cluster #1 Of 3), Eukaryotic |
Eukaryotes |
2500 |
0.30 |
Binding ≤ 10μM
|
Physical Representations
|
Type
pH range
|
xlogP
|
Des A‑Pol
Apolar desolvation
(kcal/mol)
|
Des Pol
Polar desolvation
(kcal/mol)
|
H Don
H-bond donors
|
H Acc
H-bond acceptors
|
Chg
Net charge
|
tPSA
(Ų)
|
MWT
Molecular weight
(g/mol)
|
RB
Rotatable bonds
|
DL |
|
Ref
Reference (pH 7)
|
3.63 |
-1.63 |
-13.9 |
2 |
4 |
0 |
58 |
345.377 |
4 |
↓
|
|
|
|
Analogs
Draw
Identity
99%
90%
80%
70%
Vendors
Clustered Target Annotations
| Code |
Organism Class |
Affinity (nM) |
LE (kcal/mol/atom) |
Type |
|
MIF-1-E |
Macrophage Migration Inhibitory Factor (cluster #1 Of 3), Eukaryotic |
Eukaryotes |
2500 |
0.33 |
Binding ≤ 10μM
|
Physical Representations
|
Type
pH range
|
xlogP
|
Des A‑Pol
Apolar desolvation
(kcal/mol)
|
Des Pol
Polar desolvation
(kcal/mol)
|
H Don
H-bond donors
|
H Acc
H-bond acceptors
|
Chg
Net charge
|
tPSA
(Ų)
|
MWT
Molecular weight
(g/mol)
|
RB
Rotatable bonds
|
DL |
|
Ref
Reference (pH 7)
|
3.18 |
2.23 |
-12.22 |
0 |
6 |
0 |
82 |
321.288 |
3 |
↓
|
|
|
|
Analogs
Draw
Identity
99%
90%
80%
70%
Vendors
And 2 More
Clustered Target Annotations
| Code |
Organism Class |
Affinity (nM) |
LE (kcal/mol/atom) |
Type |
|
HG2A-1-E |
HLA-DR Antigens-associated Invariant Chain (cluster #1 Of 1), Eukaryotic |
Eukaryotes |
1500 |
0.45 |
Binding ≤ 10μM
|
|
MIF-1-E |
Macrophage Migration Inhibitory Factor (cluster #1 Of 3), Eukaryotic |
Eukaryotes |
500 |
0.49 |
Binding ≤ 10μM
|
Physical Representations
|
Type
pH range
|
xlogP
|
Des A‑Pol
Apolar desolvation
(kcal/mol)
|
Des Pol
Polar desolvation
(kcal/mol)
|
H Don
H-bond donors
|
H Acc
H-bond acceptors
|
Chg
Net charge
|
tPSA
(Ų)
|
MWT
Molecular weight
(g/mol)
|
RB
Rotatable bonds
|
DL |
|
Ref
Reference (pH 7)
|
3.26 |
9.14 |
-10.58 |
0 |
3 |
0 |
35 |
239.274 |
2 |
↓
|
|
|
|
Analogs
Draw
Identity
99%
90%
80%
70%
Vendors
Clustered Target Annotations
| Code |
Organism Class |
Affinity (nM) |
LE (kcal/mol/atom) |
Type |
|
MIF-3-E |
Macrophage Migration Inhibitory Factor (cluster #3 Of 3), Eukaryotic |
Eukaryotes |
4200 |
0.42 |
Binding ≤ 10μM |
Physical Representations
|
Type
pH range
|
xlogP
|
Des A‑Pol
Apolar desolvation
(kcal/mol)
|
Des Pol
Polar desolvation
(kcal/mol)
|
H Don
H-bond donors
|
H Acc
H-bond acceptors
|
Chg
Net charge
|
tPSA
(Ų)
|
MWT
Molecular weight
(g/mol)
|
RB
Rotatable bonds
|
DL |
|
Ref
Reference (pH 7)
|
3.98 |
0.9 |
-7.01 |
0 |
2 |
0 |
22 |
279.723 |
1 |
↓
|
|