|
|
Analogs
-
15889372
-
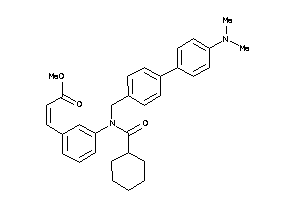
Draw
Identity
99%
90%
80%
70%
Vendors
Clustered Target Annotations
| Code |
Organism Class |
Affinity (nM) |
LE (kcal/mol/atom) |
Type |
|
NR1H4-1-E |
Bile Acid Receptor FXR (cluster #1 Of 2), Eukaryotic |
Eukaryotes |
25 |
0.29 |
Binding ≤ 10μM
|
|
NR1H4-1-E |
Bile Acid Receptor FXR (cluster #1 Of 2), Eukaryotic |
Eukaryotes |
25 |
0.29 |
Functional ≤ 10μM
|
Physical Representations
|
Type
pH range
|
xlogP
|
Des A‑Pol
Apolar desolvation
(kcal/mol)
|
Des Pol
Polar desolvation
(kcal/mol)
|
H Don
H-bond donors
|
H Acc
H-bond acceptors
|
Chg
Net charge
|
tPSA
(Ų)
|
MWT
Molecular weight
(g/mol)
|
RB
Rotatable bonds
|
DL |
|
Ref
Reference (pH 7)
|
7.51 |
17.09 |
-13.12 |
0 |
5 |
0 |
50 |
496.651 |
9 |
↓
|
|
|
|
|
|
|
Analogs
Draw
Identity
99%
90%
80%
70%
Vendors
Clustered Target Annotations
| Code |
Organism Class |
Affinity (nM) |
LE (kcal/mol/atom) |
Type |
|
NR1H4-1-E |
Bile Acid Receptor FXR (cluster #1 Of 2), Eukaryotic |
Eukaryotes |
70 |
0.28 |
Binding ≤ 10μM
|
|
NR1H4-1-E |
Bile Acid Receptor FXR (cluster #1 Of 2), Eukaryotic |
Eukaryotes |
910 |
0.23 |
Functional ≤ 10μM
|
Physical Representations
|
Type
pH range
|
xlogP
|
Des A‑Pol
Apolar desolvation
(kcal/mol)
|
Des Pol
Polar desolvation
(kcal/mol)
|
H Don
H-bond donors
|
H Acc
H-bond acceptors
|
Chg
Net charge
|
tPSA
(Ų)
|
MWT
Molecular weight
(g/mol)
|
RB
Rotatable bonds
|
DL |
|
Ref
Reference (pH 7)
|
9.08 |
3.13 |
-56.58 |
0 |
5 |
-1 |
75 |
541.838 |
8 |
↓
|
|
|
|
Analogs
Draw
Identity
99%
90%
80%
70%
Vendors
Physical Representations
|
Type
pH range
|
xlogP
|
Des A‑Pol
Apolar desolvation
(kcal/mol)
|
Des Pol
Polar desolvation
(kcal/mol)
|
H Don
H-bond donors
|
H Acc
H-bond acceptors
|
Chg
Net charge
|
tPSA
(Ų)
|
MWT
Molecular weight
(g/mol)
|
RB
Rotatable bonds
|
DL |
|
Ref
Reference (pH 7)
|
5.23 |
8.02 |
-48.98 |
2 |
4 |
-1 |
81 |
419.626 |
5 |
↓
|
|
|
|
Analogs
Draw
Identity
99%
90%
80%
70%
Vendors
And 6 More
Physical Representations
|
Type
pH range
|
xlogP
|
Des A‑Pol
Apolar desolvation
(kcal/mol)
|
Des Pol
Polar desolvation
(kcal/mol)
|
H Don
H-bond donors
|
H Acc
H-bond acceptors
|
Chg
Net charge
|
tPSA
(Ų)
|
MWT
Molecular weight
(g/mol)
|
RB
Rotatable bonds
|
DL |
|
Ref
Reference (pH 7)
|
4.68 |
12.79 |
-10.7 |
1 |
5 |
0 |
62 |
438.474 |
4 |
↓
|
|
|
|
Analogs
Draw
Identity
99%
90%
80%
70%
Vendors
Clustered Target Annotations
| Code |
Organism Class |
Affinity (nM) |
LE (kcal/mol/atom) |
Type |
|
NR1H4-1-E |
Bile Acid Receptor FXR (cluster #1 Of 2), Eukaryotic |
Eukaryotes |
21 |
0.35 |
Binding ≤ 10μM
|
|
NR1H4-1-E |
Bile Acid Receptor FXR (cluster #1 Of 2), Eukaryotic |
Eukaryotes |
85 |
0.32 |
Functional ≤ 10μM
|
Physical Representations
|
Type
pH range
|
xlogP
|
Des A‑Pol
Apolar desolvation
(kcal/mol)
|
Des Pol
Polar desolvation
(kcal/mol)
|
H Don
H-bond donors
|
H Acc
H-bond acceptors
|
Chg
Net charge
|
tPSA
(Ų)
|
MWT
Molecular weight
(g/mol)
|
RB
Rotatable bonds
|
DL |
|
Ref
Reference (pH 7)
|
4.31 |
3.83 |
-10.84 |
1 |
5 |
0 |
62 |
424.447 |
4 |
↓
|
|
|
|
Analogs
Draw
Identity
99%
90%
80%
70%
Vendors
Clustered Target Annotations
| Code |
Organism Class |
Affinity (nM) |
LE (kcal/mol/atom) |
Type |
|
NR1H4-2-E |
Bile Acid Receptor FXR (cluster #2 Of 2), Eukaryotic |
Eukaryotes |
3000 |
0.24 |
Binding ≤ 10μM
|
Physical Representations
|
Type
pH range
|
xlogP
|
Des A‑Pol
Apolar desolvation
(kcal/mol)
|
Des Pol
Polar desolvation
(kcal/mol)
|
H Don
H-bond donors
|
H Acc
H-bond acceptors
|
Chg
Net charge
|
tPSA
(Ų)
|
MWT
Molecular weight
(g/mol)
|
RB
Rotatable bonds
|
DL |
|
Ref
Reference (pH 7)
|
2.44 |
5.14 |
-50.7 |
3 |
6 |
-1 |
110 |
448.624 |
6 |
↓
|
|
|
|
Analogs
Draw
Identity
99%
90%
80%
70%
Vendors
Clustered Target Annotations
| Code |
Organism Class |
Affinity (nM) |
LE (kcal/mol/atom) |
Type |
|
NR1H4-2-E |
Bile Acid Receptor FXR (cluster #2 Of 2), Eukaryotic |
Eukaryotes |
3000 |
0.24 |
Binding ≤ 10μM
|
Physical Representations
|
Type
pH range
|
xlogP
|
Des A‑Pol
Apolar desolvation
(kcal/mol)
|
Des Pol
Polar desolvation
(kcal/mol)
|
H Don
H-bond donors
|
H Acc
H-bond acceptors
|
Chg
Net charge
|
tPSA
(Ų)
|
MWT
Molecular weight
(g/mol)
|
RB
Rotatable bonds
|
DL |
|
Ref
Reference (pH 7)
|
2.44 |
4.95 |
-50.4 |
3 |
6 |
-1 |
110 |
448.624 |
6 |
↓
|
|
|
|
Analogs
Draw
Identity
99%
90%
80%
70%
Vendors
Clustered Target Annotations
| Code |
Organism Class |
Affinity (nM) |
LE (kcal/mol/atom) |
Type |
|
NR1H4-2-E |
Bile Acid Receptor FXR (cluster #2 Of 2), Eukaryotic |
Eukaryotes |
3000 |
0.23 |
Binding ≤ 10μM
|
Physical Representations
|
Type
pH range
|
xlogP
|
Des A‑Pol
Apolar desolvation
(kcal/mol)
|
Des Pol
Polar desolvation
(kcal/mol)
|
H Don
H-bond donors
|
H Acc
H-bond acceptors
|
Chg
Net charge
|
tPSA
(Ų)
|
MWT
Molecular weight
(g/mol)
|
RB
Rotatable bonds
|
DL |
|
Ref
Reference (pH 7)
|
1.19 |
2.2 |
-55.38 |
3 |
7 |
-1 |
127 |
498.706 |
7 |
↓
|
|
|
|
Analogs
Draw
Identity
99%
90%
80%
70%
Vendors
Clustered Target Annotations
| Code |
Organism Class |
Affinity (nM) |
LE (kcal/mol/atom) |
Type |
|
NR1H4-2-E |
Bile Acid Receptor FXR (cluster #2 Of 2), Eukaryotic |
Eukaryotes |
3000 |
0.23 |
Binding ≤ 10μM
|
Physical Representations
|
Type
pH range
|
xlogP
|
Des A‑Pol
Apolar desolvation
(kcal/mol)
|
Des Pol
Polar desolvation
(kcal/mol)
|
H Don
H-bond donors
|
H Acc
H-bond acceptors
|
Chg
Net charge
|
tPSA
(Ų)
|
MWT
Molecular weight
(g/mol)
|
RB
Rotatable bonds
|
DL |
|
Ref
Reference (pH 7)
|
1.19 |
2.01 |
-55.42 |
3 |
7 |
-1 |
127 |
498.706 |
7 |
↓
|
|
|
|
|
|
|
Analogs
Draw
Identity
99%
90%
80%
70%
Vendors
And 16 More
Physical Representations
|
Type
pH range
|
xlogP
|
Des A‑Pol
Apolar desolvation
(kcal/mol)
|
Des Pol
Polar desolvation
(kcal/mol)
|
H Don
H-bond donors
|
H Acc
H-bond acceptors
|
Chg
Net charge
|
tPSA
(Ų)
|
MWT
Molecular weight
(g/mol)
|
RB
Rotatable bonds
|
DL |
|
Ref
Reference (pH 7)
|
6.73 |
12.27 |
-52.74 |
1 |
3 |
-1 |
60 |
455.703 |
1 |
↓
|
|
Lo
Low (pH 4.5-6)
|
6.73 |
10.3 |
-5.37 |
2 |
3 |
0 |
58 |
456.711 |
1 |
↓
|
|
|
|
Analogs
-
3978828
-
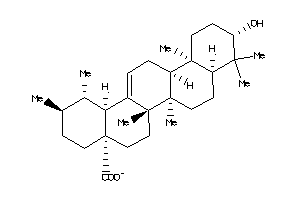
-
3978829
-
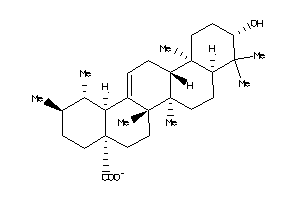
-
4273370
-
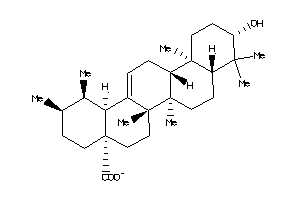
-
4273371
-
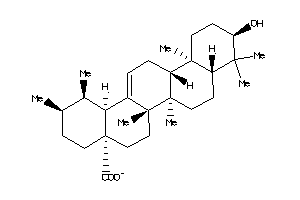
-
4273372
-
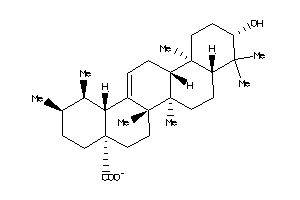
Draw
Identity
99%
90%
80%
70%
Vendors
And 19 More
Clustered Target Annotations
| Code |
Organism Class |
Affinity (nM) |
LE (kcal/mol/atom) |
Type |
|
DHI1-2-E |
11-beta-hydroxysteroid Dehydrogenase 1 (cluster #2 Of 3), Eukaryotic |
Eukaryotes |
1900 |
0.24 |
Binding ≤ 10μM
|
|
DPOLB-2-E |
DNA Polymerase Beta (cluster #2 Of 3), Eukaryotic |
Eukaryotes |
8500 |
0.22 |
Binding ≤ 10μM
|
|
PA21B-3-E |
Phospholipase A2 Group 1B (cluster #3 Of 3), Eukaryotic |
Eukaryotes |
2900 |
0.23 |
Binding ≤ 10μM
|
|
PA2A-1-E |
Phospholipase A2 Isozyme PLA-A (cluster #1 Of 2), Eukaryotic |
Eukaryotes |
2500 |
0.24 |
Binding ≤ 10μM
|
|
PA2GA-3-E |
Phospholipase A2, Membrane Associated (cluster #3 Of 3), Eukaryotic |
Eukaryotes |
3 |
0.36 |
Binding ≤ 10μM
|
|
PA2GD-2-E |
Group IID Secretory Phospholipase A2 (cluster #2 Of 3), Eukaryotic |
Eukaryotes |
2500 |
0.24 |
Binding ≤ 10μM
|
|
PA2GE-2-E |
Group IIE Secretory Phospholipase A2 (cluster #2 Of 2), Eukaryotic |
Eukaryotes |
3 |
0.36 |
Binding ≤ 10μM
|
|
PA2GF-2-E |
Group IIF Secretory Phospholipase A2 (cluster #2 Of 2), Eukaryotic |
Eukaryotes |
3 |
0.36 |
Binding ≤ 10μM
|
|
PTN1-3-E |
Protein-tyrosine Phosphatase 1B (cluster #3 Of 4), Eukaryotic |
Eukaryotes |
3900 |
0.23 |
Binding ≤ 10μM
|
|
PTN2-2-E |
T-cell Protein-tyrosine Phosphatase (cluster #2 Of 3), Eukaryotic |
Eukaryotes |
6700 |
0.22 |
Binding ≤ 10μM |
|
PYGM-1-E |
Muscle Glycogen Phosphorylase (cluster #1 Of 4), Eukaryotic |
Eukaryotes |
9000 |
0.21 |
Binding ≤ 10μM |
|
Q7T3S7-1-E |
Phospholipase A2 (cluster #1 Of 2), Eukaryotic |
Eukaryotes |
2500 |
0.24 |
Binding ≤ 10μM
|
|
GPBAR-2-E |
G-protein Coupled Bile Acid Receptor 1 (cluster #2 Of 2), Eukaryotic |
Eukaryotes |
1430 |
0.25 |
Functional ≤ 10μM
|
|
NR1H4-2-E |
Bile Acid Receptor FXR (cluster #2 Of 2), Eukaryotic |
Eukaryotes |
0 |
0.00 |
Functional ≤ 10μM
|
|
Z50418-4-O |
Trypanosoma Brucei (cluster #4 Of 6), Other |
Other |
4000 |
0.23 |
Functional ≤ 10μM
|
|
Z50420-3-O |
Trypanosoma Brucei Brucei (cluster #3 Of 7), Other |
Other |
2200 |
0.24 |
Functional ≤ 10μM
|
|
Z50466-5-O |
Trypanosoma Cruzi (cluster #5 Of 8), Other |
Other |
4000 |
0.23 |
Functional ≤ 10μM
|
|
Z50472-2-O |
Toxoplasma Gondii (cluster #2 Of 4), Other |
Other |
1000 |
0.25 |
Functional ≤ 10μM
|
|
Z50607-8-O |
Human Immunodeficiency Virus 1 (cluster #8 Of 10), Other |
Other |
1800 |
0.24 |
Functional ≤ 10μM
|
|
Z80897-2-O |
H9 (T-lymphoid Cells) (cluster #2 Of 2), Other |
Other |
4400 |
0.23 |
ADME/T ≤ 10μM
|
Physical Representations
|
Type
pH range
|
xlogP
|
Des A‑Pol
Apolar desolvation
(kcal/mol)
|
Des Pol
Polar desolvation
(kcal/mol)
|
H Don
H-bond donors
|
H Acc
H-bond acceptors
|
Chg
Net charge
|
tPSA
(Ų)
|
MWT
Molecular weight
(g/mol)
|
RB
Rotatable bonds
|
DL |
|
Ref
Reference (pH 7)
|
6.79 |
12.05 |
-49.78 |
1 |
3 |
-1 |
60 |
455.703 |
1 |
↓
|
|
Lo
Low (pH 4.5-6)
|
6.79 |
10.29 |
-5.45 |
2 |
3 |
0 |
58 |
456.711 |
1 |
↓
|
|
|
|
|
|
|
Analogs
-
4716552
-
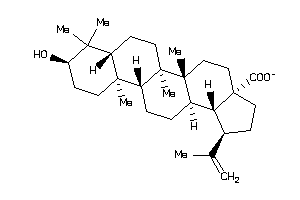
-
4995154
-
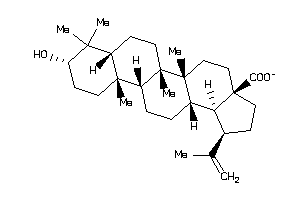
-
4995155
-
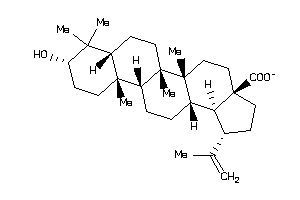
-
4995156
-
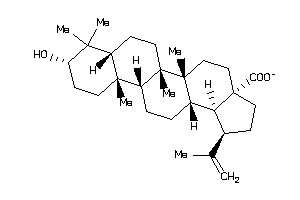
-
8951991
-
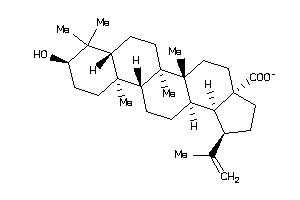
Draw
Identity
99%
90%
80%
70%
Vendors
And 18 More
Clustered Target Annotations
| Code |
Organism Class |
Affinity (nM) |
LE (kcal/mol/atom) |
Type |
|
DPOLB-2-E |
DNA Polymerase Beta (cluster #2 Of 3), Eukaryotic |
Eukaryotes |
6500 |
0.22 |
Binding ≤ 10μM
|
|
GPBAR-2-E |
G-protein Coupled Bile Acid Receptor 1 (cluster #2 Of 2), Eukaryotic |
Eukaryotes |
2170 |
0.24 |
Functional ≤ 10μM
|
|
NR1H4-2-E |
Bile Acid Receptor FXR (cluster #2 Of 2), Eukaryotic |
Eukaryotes |
0 |
0.00 |
Functional ≤ 10μM
|
|
Z103202-1-O |
8505C (cluster #1 Of 2), Other |
Other |
7260 |
0.22 |
Functional ≤ 10μM
|
|
Z50425-4-O |
Plasmodium Falciparum (cluster #4 Of 22), Other |
Other |
5200 |
0.22 |
Functional ≤ 10μM
|
|
Z50459-6-O |
Leishmania Donovani (cluster #6 Of 8), Other |
Other |
4100 |
0.23 |
Functional ≤ 10μM
|
|
Z50602-3-O |
Human Herpesvirus 1 (cluster #3 Of 5), Other |
Other |
8200 |
0.22 |
Functional ≤ 10μM
|
|
Z50607-8-O |
Human Immunodeficiency Virus 1 (cluster #8 Of 10), Other |
Other |
3100 |
0.23 |
Functional ≤ 10μM
|
|
Z50636-1-O |
Sindbis Virus (cluster #1 Of 3), Other |
Other |
500 |
0.27 |
Functional ≤ 10μM
|
|
Z80482-1-O |
SK-MEL-2 (Melanoma Cells) (cluster #1 Of 4), Other |
Other |
7000 |
0.22 |
Functional ≤ 10μM
|
|
Z80526-1-O |
SW480 (Colon Adenocarcinoma Cells) (cluster #1 Of 6), Other |
Other |
6480 |
0.22 |
Functional ≤ 10μM
|
|
Z80682-3-O |
A549 (Lung Carcinoma Cells) (cluster #3 Of 11), Other |
Other |
6650 |
0.22 |
Functional ≤ 10μM
|
|
Z80897-2-O |
H9 (T-lymphoid Cells) (cluster #2 Of 2), Other |
Other |
1400 |
0.25 |
Functional ≤ 10μM
|
|
Z81020-2-O |
HepG2 (Hepatoblastoma Cells) (cluster #2 Of 8), Other |
Other |
36 |
0.32 |
Functional ≤ 10μM
|
|
Z81072-2-O |
Jurkat (Acute Leukemic T-cells) (cluster #2 Of 10), Other |
Other |
27 |
0.32 |
Functional ≤ 10μM
|
|
Z81247-4-O |
HeLa (Cervical Adenocarcinoma Cells) (cluster #4 Of 9), Other |
Other |
26 |
0.32 |
Functional ≤ 10μM
|
|
Z80897-2-O |
H9 (T-lymphoid Cells) (cluster #2 Of 2), Other |
Other |
900 |
0.26 |
ADME/T ≤ 10μM
|
Physical Representations
|
Type
pH range
|
xlogP
|
Des A‑Pol
Apolar desolvation
(kcal/mol)
|
Des Pol
Polar desolvation
(kcal/mol)
|
H Don
H-bond donors
|
H Acc
H-bond acceptors
|
Chg
Net charge
|
tPSA
(Ų)
|
MWT
Molecular weight
(g/mol)
|
RB
Rotatable bonds
|
DL |
|
Ref
Reference (pH 7)
|
7.04 |
12.1 |
-48.88 |
1 |
3 |
-1 |
60 |
455.703 |
2 |
↓
|
|
Lo
Low (pH 4.5-6)
|
7.04 |
10.34 |
-5.48 |
2 |
3 |
0 |
58 |
456.711 |
2 |
↓
|
|
|
|
Analogs
Draw
Identity
99%
90%
80%
70%
Vendors
Clustered Target Annotations
| Code |
Organism Class |
Affinity (nM) |
LE (kcal/mol/atom) |
Type |
|
GPBAR-2-E |
G-protein Coupled Bile Acid Receptor 1 (cluster #2 Of 2), Eukaryotic |
Eukaryotes |
120 |
0.36 |
Functional ≤ 10μM
|
|
NR1H4-2-E |
Bile Acid Receptor FXR (cluster #2 Of 2), Eukaryotic |
Eukaryotes |
6000 |
0.27 |
Functional ≤ 10μM
|
Physical Representations
|
Type
pH range
|
xlogP
|
Des A‑Pol
Apolar desolvation
(kcal/mol)
|
Des Pol
Polar desolvation
(kcal/mol)
|
H Don
H-bond donors
|
H Acc
H-bond acceptors
|
Chg
Net charge
|
tPSA
(Ų)
|
MWT
Molecular weight
(g/mol)
|
RB
Rotatable bonds
|
DL |
|
Ref
Reference (pH 7)
|
4.37 |
4.35 |
-8.21 |
3 |
3 |
0 |
61 |
378.597 |
4 |
↓
|
|
|
|
|
|
|
Analogs
-
8762630
-
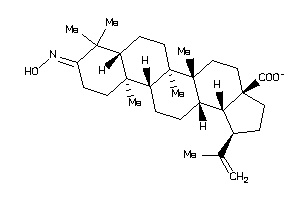
-
8762634
-
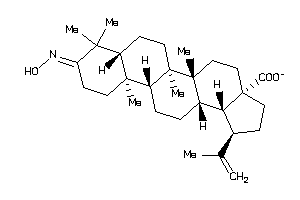
Draw
Identity
99%
90%
80%
70%
Vendors
Physical Representations
|
Type
pH range
|
xlogP
|
Des A‑Pol
Apolar desolvation
(kcal/mol)
|
Des Pol
Polar desolvation
(kcal/mol)
|
H Don
H-bond donors
|
H Acc
H-bond acceptors
|
Chg
Net charge
|
tPSA
(Ų)
|
MWT
Molecular weight
(g/mol)
|
RB
Rotatable bonds
|
DL |
|
Ref
Reference (pH 7)
|
7.31 |
11.6 |
-54 |
1 |
4 |
-1 |
73 |
468.702 |
2 |
↓
|
|
|
|
Analogs
Draw
Identity
99%
90%
80%
70%
Vendors
And 8 More
Physical Representations
|
Type
pH range
|
xlogP
|
Des A‑Pol
Apolar desolvation
(kcal/mol)
|
Des Pol
Polar desolvation
(kcal/mol)
|
H Don
H-bond donors
|
H Acc
H-bond acceptors
|
Chg
Net charge
|
tPSA
(Ų)
|
MWT
Molecular weight
(g/mol)
|
RB
Rotatable bonds
|
DL |
|
Ref
Reference (pH 7)
|
3.62 |
10.37 |
-11.66 |
0 |
2 |
0 |
34 |
312.453 |
0 |
↓
|
|
Ref
Reference (pH 7)
|
3.62 |
10.62 |
-10.79 |
0 |
2 |
0 |
34 |
312.453 |
0 |
↓
|
|
|
|
|
|
|
Analogs
-
8762249
-
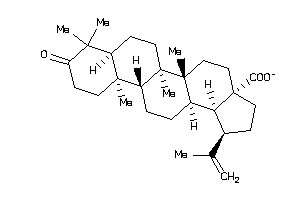
-
8762252
-
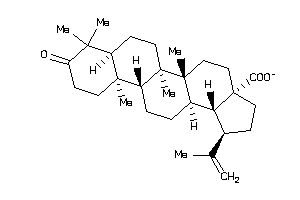
-
8835967
-
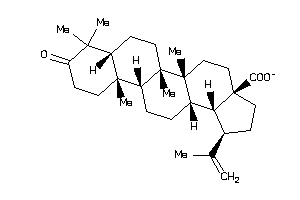
-
8835968
-
-
8952537
-
Draw
Identity
99%
90%
80%
70%
Vendors
And 2 More
Clustered Target Annotations
| Code |
Organism Class |
Affinity (nM) |
LE (kcal/mol/atom) |
Type |
|
GPBAR-2-E |
G-protein Coupled Bile Acid Receptor 1 (cluster #2 Of 2), Eukaryotic |
Eukaryotes |
4710 |
0.23 |
Functional ≤ 10μM
|
|
NR1H4-2-E |
Bile Acid Receptor FXR (cluster #2 Of 2), Eukaryotic |
Eukaryotes |
0 |
0.00 |
Functional ≤ 10μM
|
|
Z100499-2-O |
SARS Coronavirus (cluster #2 Of 2), Other |
Other |
630 |
0.26 |
Functional ≤ 10μM
|
|
Z103205-2-O |
A431 (cluster #2 Of 4), Other |
Other |
3260 |
0.23 |
Functional ≤ 10μM
|
|
Z50602-3-O |
Human Herpesvirus 1 (cluster #3 Of 5), Other |
Other |
2500 |
0.24 |
Functional ≤ 10μM
|
|
Z50652-2-O |
Influenza A Virus (cluster #2 Of 4), Other |
Other |
5700 |
0.22 |
Functional ≤ 10μM
|
|
Z80186-4-O |
K562 (Erythroleukemia Cells) (cluster #4 Of 11), Other |
Other |
6000 |
0.22 |
Functional ≤ 10μM
|
|
Z80928-4-O |
HCT-116 (Colon Carcinoma Cells) (cluster #4 Of 9), Other |
Other |
2610 |
0.24 |
Functional ≤ 10μM
|
|
Z81034-2-O |
A2780 (Ovarian Carcinoma Cells) (cluster #2 Of 10), Other |
Other |
2980 |
0.23 |
Functional ≤ 10μM
|
|
Z81252-4-O |
MDA-MB-231 (Breast Adenocarcinoma Cells) (cluster #4 Of 11), Other |
Other |
9770 |
0.21 |
Functional ≤ 10μM
|
|
Z80186-2-O |
K562 (Erythroleukemia Cells) (cluster #2 Of 3), Other |
Other |
6000 |
0.22 |
ADME/T ≤ 10μM
|
|
Z81115-3-O |
KB (Squamous Cell Carcinoma) (cluster #3 Of 3), Other |
Other |
3800 |
0.23 |
ADME/T ≤ 10μM
|
Physical Representations
|
Type
pH range
|
xlogP
|
Des A‑Pol
Apolar desolvation
(kcal/mol)
|
Des Pol
Polar desolvation
(kcal/mol)
|
H Don
H-bond donors
|
H Acc
H-bond acceptors
|
Chg
Net charge
|
tPSA
(Ų)
|
MWT
Molecular weight
(g/mol)
|
RB
Rotatable bonds
|
DL |
|
Ref
Reference (pH 7)
|
6.86 |
14.43 |
-48.14 |
0 |
3 |
-1 |
57 |
453.687 |
2 |
↓
|
|
Lo
Low (pH 4.5-6)
|
6.86 |
12.66 |
-7.5 |
1 |
3 |
0 |
54 |
454.695 |
2 |
↓
|
|
|
|
Analogs
-
3936686
-
Draw
Identity
99%
90%
80%
70%
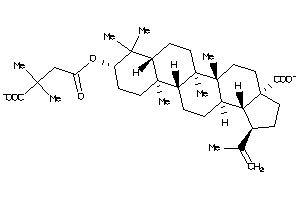
Popular Name:
(1R,3aS,5aR,5bR,7aR,9S,11aR,11bR,13aR,13bR)-9-(4-hydroxy-4-oxo-butanoyl)oxy-1-isopropenyl-5a,5b,8,8,
(1R,3aS,5aR,5bR,7aR,9S,11aR,11bR…
Find On:
PubMed —
Wikipedia —
Google
Vendors
Clustered Target Annotations
| Code |
Organism Class |
Affinity (nM) |
LE (kcal/mol/atom) |
Type |
|
NR1H4-2-E |
Bile Acid Receptor FXR (cluster #2 Of 2), Eukaryotic |
Eukaryotes |
0 |
0.00 |
Functional ≤ 10μM
|
|
Z50607-8-O |
Human Immunodeficiency Virus 1 (cluster #8 Of 10), Other |
Other |
4000 |
0.19 |
Functional ≤ 10μM |
|
Z80897-2-O |
H9 (T-lymphoid Cells) (cluster #2 Of 2), Other |
Other |
4000 |
0.19 |
ADME/T ≤ 10μM
|
Physical Representations
|
Type
pH range
|
xlogP
|
Des A‑Pol
Apolar desolvation
(kcal/mol)
|
Des Pol
Polar desolvation
(kcal/mol)
|
H Don
H-bond donors
|
H Acc
H-bond acceptors
|
Chg
Net charge
|
tPSA
(Ų)
|
MWT
Molecular weight
(g/mol)
|
RB
Rotatable bonds
|
DL |
|
Ref
Reference (pH 7)
|
7.02 |
17.62 |
-93.02 |
0 |
6 |
-2 |
107 |
554.768 |
7 |
↓
|
|
Lo
Low (pH 4.5-6)
|
7.02 |
15.92 |
-45.86 |
1 |
6 |
-1 |
104 |
555.776 |
7 |
↓
|
|
|
|
|
|
|
|
|
|
Analogs
Draw
Identity
99%
90%
80%
70%
Vendors
Clustered Target Annotations
| Code |
Organism Class |
Affinity (nM) |
LE (kcal/mol/atom) |
Type |
|
NR1H4-1-E |
Bile Acid Receptor FXR (cluster #1 Of 2), Eukaryotic |
Eukaryotes |
6170 |
0.28 |
Functional ≤ 10μM
|
Physical Representations
|
Type
pH range
|
xlogP
|
Des A‑Pol
Apolar desolvation
(kcal/mol)
|
Des Pol
Polar desolvation
(kcal/mol)
|
H Don
H-bond donors
|
H Acc
H-bond acceptors
|
Chg
Net charge
|
tPSA
(Ų)
|
MWT
Molecular weight
(g/mol)
|
RB
Rotatable bonds
|
DL |
|
Ref
Reference (pH 7)
|
4.73 |
12.41 |
-9.17 |
0 |
5 |
0 |
62 |
354.402 |
10 |
↓
|
|
|
|
Analogs
-
13897603
-
Draw
Identity
99%
90%
80%
70%
Vendors
And 7 More
Clustered Target Annotations
| Code |
Organism Class |
Affinity (nM) |
LE (kcal/mol/atom) |
Type |
|
NR1H4-1-E |
Bile Acid Receptor FXR (cluster #1 Of 2), Eukaryotic |
Eukaryotes |
5150 |
0.26 |
Functional ≤ 10μM
|
Physical Representations
|
Type
pH range
|
xlogP
|
Des A‑Pol
Apolar desolvation
(kcal/mol)
|
Des Pol
Polar desolvation
(kcal/mol)
|
H Don
H-bond donors
|
H Acc
H-bond acceptors
|
Chg
Net charge
|
tPSA
(Ų)
|
MWT
Molecular weight
(g/mol)
|
RB
Rotatable bonds
|
DL |
|
Ref
Reference (pH 7)
|
4.13 |
-0.02 |
-12.55 |
1 |
5 |
0 |
64 |
384.435 |
5 |
↓
|
|
|
|
|
|
|
|
|
|
Analogs
Draw
Identity
99%
90%
80%
70%
Vendors
Clustered Target Annotations
| Code |
Organism Class |
Affinity (nM) |
LE (kcal/mol/atom) |
Type |
|
NR1H4-2-E |
Bile Acid Receptor FXR (cluster #2 Of 2), Eukaryotic |
Eukaryotes |
0 |
0.00 |
Functional ≤ 10μM
|
Physical Representations
|
Type
pH range
|
xlogP
|
Des A‑Pol
Apolar desolvation
(kcal/mol)
|
Des Pol
Polar desolvation
(kcal/mol)
|
H Don
H-bond donors
|
H Acc
H-bond acceptors
|
Chg
Net charge
|
tPSA
(Ų)
|
MWT
Molecular weight
(g/mol)
|
RB
Rotatable bonds
|
DL |
|
Ref
Reference (pH 7)
|
7.30 |
16.02 |
-54.72 |
0 |
3 |
-1 |
57 |
453.687 |
5 |
↓
|
|
|
|
Analogs
Draw
Identity
99%
90%
80%
70%
Popular Name:
(1R,3aS,5aR,5bR,7aR,9R,11aR,11bR,13aR,13bR)-9-allyl-9-hydroxy-1-isopropenyl-5a,5b,8,8,11a-pentamethy
(1R,3aS,5aR,5bR,7aR,9R,11aR,11bR…
Find On:
PubMed —
Wikipedia —
Google
Vendors
Clustered Target Annotations
| Code |
Organism Class |
Affinity (nM) |
LE (kcal/mol/atom) |
Type |
|
GPBAR-2-E |
G-protein Coupled Bile Acid Receptor 1 (cluster #2 Of 2), Eukaryotic |
Eukaryotes |
120 |
0.27 |
Functional ≤ 10μM
|
|
NR1H4-2-E |
Bile Acid Receptor FXR (cluster #2 Of 2), Eukaryotic |
Eukaryotes |
0 |
0.00 |
Functional ≤ 10μM
|
Physical Representations
|
Type
pH range
|
xlogP
|
Des A‑Pol
Apolar desolvation
(kcal/mol)
|
Des Pol
Polar desolvation
(kcal/mol)
|
H Don
H-bond donors
|
H Acc
H-bond acceptors
|
Chg
Net charge
|
tPSA
(Ų)
|
MWT
Molecular weight
(g/mol)
|
RB
Rotatable bonds
|
DL |
|
Ref
Reference (pH 7)
|
8.03 |
13.9 |
-48.33 |
1 |
3 |
-1 |
60 |
495.768 |
4 |
↓
|
|
Lo
Low (pH 4.5-6)
|
8.03 |
12.16 |
-5.05 |
2 |
3 |
0 |
58 |
496.776 |
4 |
↓
|
|
|
|
|