|
|
Analogs
Draw
Identity
99%
90%
80%
70%
Popular Name:
[(1R,2S,3S,4S,5R,6R)-2,3,6-trihydroxy-4,5-diphosphonooxy-cyclohexyl]
[(1R,2S,3S,4S,5R,6R)-2,3,6-trihy…
Find On:
PubMed —
Wikipedia —
Google
Vendors
Clustered Target Annotations
| Code |
Organism Class |
Affinity (nM) |
LE (kcal/mol/atom) |
Type |
|
IP3KA-1-E |
Inositol-trisphosphate 3-kinase A (cluster #1 Of 1), Eukaryotic |
Eukaryotes |
6300 |
0.30 |
Binding ≤ 10μM
|
|
IP3KB-1-E |
Inositol-trisphosphate 3-kinase B (cluster #1 Of 1), Eukaryotic |
Eukaryotes |
3550 |
0.32 |
Binding ≤ 10μM |
|
IP3KC-1-E |
Inositol 1,4,5-trisphosphate 3 Kinase C (cluster #1 Of 1), Eukaryotic |
Eukaryotes |
3550 |
0.32 |
Binding ≤ 10μM |
|
ITPR1-1-E |
Inositol 1,4,5-trisphosphate Receptor Type 1 (cluster #1 Of 1), Eukaryotic |
Eukaryotes |
2 |
0.51 |
Binding ≤ 10μM
|
|
ITPR1-1-E |
Inositol 1,4,5-trisphosphate Receptor Type 1 (cluster #1 Of 1), Eukaryotic |
Eukaryotes |
6 |
0.48 |
Binding ≤ 10μM |
|
ITPR2-1-E |
Inositol 1,4,5-trisphosphate Receptor Type 2 (cluster #1 Of 1), Eukaryotic |
Eukaryotes |
2 |
0.51 |
Binding ≤ 10μM
|
|
ITPR2-1-E |
Inositol 1,4,5-trisphosphate Receptor Type 2 (cluster #1 Of 1), Eukaryotic |
Eukaryotes |
6 |
0.48 |
Binding ≤ 10μM |
|
ITPR3-1-E |
Inositol 1,4,5-trisphosphate Receptor Type 3 (cluster #1 Of 1), Eukaryotic |
Eukaryotes |
2 |
0.51 |
Binding ≤ 10μM
|
|
ITPR3-1-E |
Inositol 1,4,5-trisphosphate Receptor Type 3 (cluster #1 Of 1), Eukaryotic |
Eukaryotes |
6 |
0.48 |
Binding ≤ 10μM |
|
P79248-1-E |
Type 1 InsP3 Receptor Isoform S2 (cluster #1 Of 1), Eukaryotic |
Eukaryotes |
20 |
0.45 |
Binding ≤ 10μM |
|
PLCL1-1-E |
Inositol 1,4,5-trisphosphate Binding Protein (cluster #1 Of 1), Eukaryotic |
Eukaryotes |
40 |
0.43 |
Binding ≤ 10μM |
|
Z50587-2-O |
Homo Sapiens (cluster #2 Of 9), Other |
Other |
120 |
0.40 |
Functional ≤ 10μM
|
|
Z50592-2-O |
Oryctolagus Cuniculus (cluster #2 Of 8), Other |
Other |
400 |
0.37 |
Functional ≤ 10μM |
|
Z50597-4-O |
Rattus Norvegicus (cluster #4 Of 12), Other |
Other |
90 |
0.41 |
Functional ≤ 10μM |
|
Z80193-3-O |
L1210 (Lymphocytic Leukemia Cells) (cluster #3 Of 12), Other |
Other |
740 |
0.36 |
Functional ≤ 10μM
|
|
Z80419-2-O |
RBL-1 (Basophilic Leukemia Cells) (cluster #2 Of 2), Other |
Other |
4300 |
0.31 |
Functional ≤ 10μM
|
|
Z80471-1-O |
SH-SY5 (Bone Marrow Neuroblastoma Cells) (cluster #1 Of 3), Other |
Other |
52 |
0.42 |
Functional ≤ 10μM
|
|
Z81205-1-O |
Lvec Cell Line (cluster #1 Of 1), Other |
Other |
247 |
0.39 |
Functional ≤ 10μM
|
Physical Representations
|
Type
pH range
|
xlogP
|
Des A‑Pol
Apolar desolvation
(kcal/mol)
|
Des Pol
Polar desolvation
(kcal/mol)
|
H Don
H-bond donors
|
H Acc
H-bond acceptors
|
Chg
Net charge
|
tPSA
(Ų)
|
MWT
Molecular weight
(g/mol)
|
RB
Rotatable bonds
|
DL |
|
Ref
Reference (pH 7)
|
-4.71 |
-7.85 |
-481.15 |
4 |
15 |
-5 |
275 |
415.053 |
6 |
↓
|
|
Mid
Mid (pH 6-8)
|
-4.71 |
-7.85 |
-481.58 |
4 |
15 |
-5 |
275 |
415.053 |
6 |
↓
|
|
Mid
Mid (pH 6-8)
|
-4.71 |
-7.85 |
-450.13 |
4 |
15 |
-5 |
275 |
415.053 |
6 |
↓
|
|
|
|
Analogs
Draw
Identity
99%
90%
80%
70%
Vendors
Clustered Target Annotations
| Code |
Organism Class |
Affinity (nM) |
LE (kcal/mol/atom) |
Type |
|
IP3KA-1-E |
Inositol-trisphosphate 3-kinase A (cluster #1 Of 1), Eukaryotic |
Eukaryotes |
6300 |
0.30 |
Binding ≤ 10μM
|
|
IP3KB-1-E |
Inositol-trisphosphate 3-kinase B (cluster #1 Of 1), Eukaryotic |
Eukaryotes |
3550 |
0.32 |
Binding ≤ 10μM |
|
IP3KC-1-E |
Inositol 1,4,5-trisphosphate 3 Kinase C (cluster #1 Of 1), Eukaryotic |
Eukaryotes |
3550 |
0.32 |
Binding ≤ 10μM |
|
ITPR1-1-E |
Inositol 1,4,5-trisphosphate Receptor Type 1 (cluster #1 Of 1), Eukaryotic |
Eukaryotes |
2 |
0.51 |
Binding ≤ 10μM
|
|
ITPR1-1-E |
Inositol 1,4,5-trisphosphate Receptor Type 1 (cluster #1 Of 1), Eukaryotic |
Eukaryotes |
6 |
0.48 |
Binding ≤ 10μM |
|
ITPR2-1-E |
Inositol 1,4,5-trisphosphate Receptor Type 2 (cluster #1 Of 1), Eukaryotic |
Eukaryotes |
2 |
0.51 |
Binding ≤ 10μM
|
|
ITPR2-1-E |
Inositol 1,4,5-trisphosphate Receptor Type 2 (cluster #1 Of 1), Eukaryotic |
Eukaryotes |
6 |
0.48 |
Binding ≤ 10μM |
|
ITPR3-1-E |
Inositol 1,4,5-trisphosphate Receptor Type 3 (cluster #1 Of 1), Eukaryotic |
Eukaryotes |
2 |
0.51 |
Binding ≤ 10μM
|
|
ITPR3-1-E |
Inositol 1,4,5-trisphosphate Receptor Type 3 (cluster #1 Of 1), Eukaryotic |
Eukaryotes |
6 |
0.48 |
Binding ≤ 10μM |
|
P79248-1-E |
Type 1 InsP3 Receptor Isoform S2 (cluster #1 Of 1), Eukaryotic |
Eukaryotes |
20 |
0.45 |
Binding ≤ 10μM |
|
PLCL1-1-E |
Inositol 1,4,5-trisphosphate Binding Protein (cluster #1 Of 1), Eukaryotic |
Eukaryotes |
40 |
0.43 |
Binding ≤ 10μM |
|
Z50587-2-O |
Homo Sapiens (cluster #2 Of 9), Other |
Other |
120 |
0.40 |
Functional ≤ 10μM
|
|
Z50592-2-O |
Oryctolagus Cuniculus (cluster #2 Of 8), Other |
Other |
400 |
0.37 |
Functional ≤ 10μM |
|
Z50597-4-O |
Rattus Norvegicus (cluster #4 Of 12), Other |
Other |
90 |
0.41 |
Functional ≤ 10μM |
|
Z80193-3-O |
L1210 (Lymphocytic Leukemia Cells) (cluster #3 Of 12), Other |
Other |
740 |
0.36 |
Functional ≤ 10μM
|
|
Z80419-2-O |
RBL-1 (Basophilic Leukemia Cells) (cluster #2 Of 2), Other |
Other |
4300 |
0.31 |
Functional ≤ 10μM
|
|
Z80471-1-O |
SH-SY5 (Bone Marrow Neuroblastoma Cells) (cluster #1 Of 3), Other |
Other |
52 |
0.42 |
Functional ≤ 10μM
|
|
Z81205-1-O |
Lvec Cell Line (cluster #1 Of 1), Other |
Other |
247 |
0.39 |
Functional ≤ 10μM
|
Physical Representations
|
Type
pH range
|
xlogP
|
Des A‑Pol
Apolar desolvation
(kcal/mol)
|
Des Pol
Polar desolvation
(kcal/mol)
|
H Don
H-bond donors
|
H Acc
H-bond acceptors
|
Chg
Net charge
|
tPSA
(Ų)
|
MWT
Molecular weight
(g/mol)
|
RB
Rotatable bonds
|
DL |
|
Ref
Reference (pH 7)
|
-4.71 |
-7.28 |
-483.55 |
4 |
15 |
-5 |
275 |
415.053 |
6 |
↓
|
|
Mid
Mid (pH 6-8)
|
-4.71 |
-7.28 |
-484.19 |
4 |
15 |
-5 |
275 |
415.053 |
6 |
↓
|
|
Mid
Mid (pH 6-8)
|
-4.71 |
-7.28 |
-448.71 |
4 |
15 |
-5 |
275 |
415.053 |
6 |
↓
|
|
|
|
Analogs
Draw
Identity
99%
90%
80%
70%
Vendors
Clustered Target Annotations
| Code |
Organism Class |
Affinity (nM) |
LE (kcal/mol/atom) |
Type |
|
IP3KA-1-E |
Inositol-trisphosphate 3-kinase A (cluster #1 Of 1), Eukaryotic |
Eukaryotes |
6300 |
0.30 |
Binding ≤ 10μM
|
|
IP3KB-1-E |
Inositol-trisphosphate 3-kinase B (cluster #1 Of 1), Eukaryotic |
Eukaryotes |
3550 |
0.32 |
Binding ≤ 10μM |
|
IP3KC-1-E |
Inositol 1,4,5-trisphosphate 3 Kinase C (cluster #1 Of 1), Eukaryotic |
Eukaryotes |
3550 |
0.32 |
Binding ≤ 10μM |
|
ITPR1-1-E |
Inositol 1,4,5-trisphosphate Receptor Type 1 (cluster #1 Of 1), Eukaryotic |
Eukaryotes |
2 |
0.51 |
Binding ≤ 10μM
|
|
ITPR1-1-E |
Inositol 1,4,5-trisphosphate Receptor Type 1 (cluster #1 Of 1), Eukaryotic |
Eukaryotes |
6 |
0.48 |
Binding ≤ 10μM |
|
ITPR2-1-E |
Inositol 1,4,5-trisphosphate Receptor Type 2 (cluster #1 Of 1), Eukaryotic |
Eukaryotes |
2 |
0.51 |
Binding ≤ 10μM
|
|
ITPR2-1-E |
Inositol 1,4,5-trisphosphate Receptor Type 2 (cluster #1 Of 1), Eukaryotic |
Eukaryotes |
6 |
0.48 |
Binding ≤ 10μM |
|
ITPR3-1-E |
Inositol 1,4,5-trisphosphate Receptor Type 3 (cluster #1 Of 1), Eukaryotic |
Eukaryotes |
2 |
0.51 |
Binding ≤ 10μM
|
|
ITPR3-1-E |
Inositol 1,4,5-trisphosphate Receptor Type 3 (cluster #1 Of 1), Eukaryotic |
Eukaryotes |
6 |
0.48 |
Binding ≤ 10μM |
|
P79248-1-E |
Type 1 InsP3 Receptor Isoform S2 (cluster #1 Of 1), Eukaryotic |
Eukaryotes |
20 |
0.45 |
Binding ≤ 10μM |
|
PLCL1-1-E |
Inositol 1,4,5-trisphosphate Binding Protein (cluster #1 Of 1), Eukaryotic |
Eukaryotes |
40 |
0.43 |
Binding ≤ 10μM |
|
Z50587-2-O |
Homo Sapiens (cluster #2 Of 9), Other |
Other |
120 |
0.40 |
Functional ≤ 10μM
|
|
Z50592-2-O |
Oryctolagus Cuniculus (cluster #2 Of 8), Other |
Other |
400 |
0.37 |
Functional ≤ 10μM |
|
Z50597-4-O |
Rattus Norvegicus (cluster #4 Of 12), Other |
Other |
90 |
0.41 |
Functional ≤ 10μM |
|
Z80193-3-O |
L1210 (Lymphocytic Leukemia Cells) (cluster #3 Of 12), Other |
Other |
740 |
0.36 |
Functional ≤ 10μM
|
|
Z80419-2-O |
RBL-1 (Basophilic Leukemia Cells) (cluster #2 Of 2), Other |
Other |
4300 |
0.31 |
Functional ≤ 10μM
|
|
Z80471-1-O |
SH-SY5 (Bone Marrow Neuroblastoma Cells) (cluster #1 Of 3), Other |
Other |
52 |
0.42 |
Functional ≤ 10μM
|
|
Z81205-1-O |
Lvec Cell Line (cluster #1 Of 1), Other |
Other |
247 |
0.39 |
Functional ≤ 10μM
|
Physical Representations
|
Type
pH range
|
xlogP
|
Des A‑Pol
Apolar desolvation
(kcal/mol)
|
Des Pol
Polar desolvation
(kcal/mol)
|
H Don
H-bond donors
|
H Acc
H-bond acceptors
|
Chg
Net charge
|
tPSA
(Ų)
|
MWT
Molecular weight
(g/mol)
|
RB
Rotatable bonds
|
DL |
|
Ref
Reference (pH 7)
|
-4.71 |
-7.82 |
-466.23 |
4 |
15 |
-5 |
275 |
415.053 |
6 |
↓
|
|
Mid
Mid (pH 6-8)
|
-4.71 |
-7.82 |
-447.76 |
4 |
15 |
-5 |
275 |
415.053 |
6 |
↓
|
|
Mid
Mid (pH 6-8)
|
-4.71 |
-7.82 |
-484.1 |
4 |
15 |
-5 |
275 |
415.053 |
6 |
↓
|
|
|
|
Analogs
Draw
Identity
99%
90%
80%
70%
Vendors
Clustered Target Annotations
| Code |
Organism Class |
Affinity (nM) |
LE (kcal/mol/atom) |
Type |
|
IP3KA-1-E |
Inositol-trisphosphate 3-kinase A (cluster #1 Of 1), Eukaryotic |
Eukaryotes |
6300 |
0.30 |
Binding ≤ 10μM
|
|
IP3KB-1-E |
Inositol-trisphosphate 3-kinase B (cluster #1 Of 1), Eukaryotic |
Eukaryotes |
3550 |
0.32 |
Binding ≤ 10μM |
|
IP3KC-1-E |
Inositol 1,4,5-trisphosphate 3 Kinase C (cluster #1 Of 1), Eukaryotic |
Eukaryotes |
3550 |
0.32 |
Binding ≤ 10μM |
|
ITPR1-1-E |
Inositol 1,4,5-trisphosphate Receptor Type 1 (cluster #1 Of 1), Eukaryotic |
Eukaryotes |
2 |
0.51 |
Binding ≤ 10μM
|
|
ITPR1-1-E |
Inositol 1,4,5-trisphosphate Receptor Type 1 (cluster #1 Of 1), Eukaryotic |
Eukaryotes |
6 |
0.48 |
Binding ≤ 10μM |
|
ITPR2-1-E |
Inositol 1,4,5-trisphosphate Receptor Type 2 (cluster #1 Of 1), Eukaryotic |
Eukaryotes |
2 |
0.51 |
Binding ≤ 10μM
|
|
ITPR2-1-E |
Inositol 1,4,5-trisphosphate Receptor Type 2 (cluster #1 Of 1), Eukaryotic |
Eukaryotes |
6 |
0.48 |
Binding ≤ 10μM |
|
ITPR3-1-E |
Inositol 1,4,5-trisphosphate Receptor Type 3 (cluster #1 Of 1), Eukaryotic |
Eukaryotes |
2 |
0.51 |
Binding ≤ 10μM
|
|
ITPR3-1-E |
Inositol 1,4,5-trisphosphate Receptor Type 3 (cluster #1 Of 1), Eukaryotic |
Eukaryotes |
6 |
0.48 |
Binding ≤ 10μM |
|
P79248-1-E |
Type 1 InsP3 Receptor Isoform S2 (cluster #1 Of 1), Eukaryotic |
Eukaryotes |
20 |
0.45 |
Binding ≤ 10μM |
|
PLCL1-1-E |
Inositol 1,4,5-trisphosphate Binding Protein (cluster #1 Of 1), Eukaryotic |
Eukaryotes |
40 |
0.43 |
Binding ≤ 10μM |
|
Z50587-2-O |
Homo Sapiens (cluster #2 Of 9), Other |
Other |
120 |
0.40 |
Functional ≤ 10μM
|
|
Z50592-2-O |
Oryctolagus Cuniculus (cluster #2 Of 8), Other |
Other |
400 |
0.37 |
Functional ≤ 10μM |
|
Z50597-4-O |
Rattus Norvegicus (cluster #4 Of 12), Other |
Other |
90 |
0.41 |
Functional ≤ 10μM |
|
Z80193-3-O |
L1210 (Lymphocytic Leukemia Cells) (cluster #3 Of 12), Other |
Other |
740 |
0.36 |
Functional ≤ 10μM
|
|
Z80419-2-O |
RBL-1 (Basophilic Leukemia Cells) (cluster #2 Of 2), Other |
Other |
4300 |
0.31 |
Functional ≤ 10μM
|
|
Z80471-1-O |
SH-SY5 (Bone Marrow Neuroblastoma Cells) (cluster #1 Of 3), Other |
Other |
52 |
0.42 |
Functional ≤ 10μM
|
|
Z81205-1-O |
Lvec Cell Line (cluster #1 Of 1), Other |
Other |
247 |
0.39 |
Functional ≤ 10μM
|
Physical Representations
|
Type
pH range
|
xlogP
|
Des A‑Pol
Apolar desolvation
(kcal/mol)
|
Des Pol
Polar desolvation
(kcal/mol)
|
H Don
H-bond donors
|
H Acc
H-bond acceptors
|
Chg
Net charge
|
tPSA
(Ų)
|
MWT
Molecular weight
(g/mol)
|
RB
Rotatable bonds
|
DL |
|
Ref
Reference (pH 7)
|
-4.71 |
-8.3 |
-466.15 |
4 |
15 |
-5 |
275 |
415.053 |
6 |
↓
|
|
Mid
Mid (pH 6-8)
|
-4.71 |
-8.3 |
-448.27 |
4 |
15 |
-5 |
275 |
415.053 |
6 |
↓
|
|
Mid
Mid (pH 6-8)
|
-4.71 |
-7.16 |
-627.03 |
3 |
15 |
-6 |
278 |
414.045 |
6 |
↓
|
|
|
|
Analogs
Draw
Identity
99%
90%
80%
70%
Vendors
And 4 More
Clustered Target Annotations
| Code |
Organism Class |
Affinity (nM) |
LE (kcal/mol/atom) |
Type |
|
ITPR1-1-E |
Inositol 1,4,5-trisphosphate Receptor Type 1 (cluster #1 Of 1), Eukaryotic |
Eukaryotes |
300 |
0.38 |
Binding ≤ 10μM |
|
ITPR2-1-E |
Inositol 1,4,5-trisphosphate Receptor Type 2 (cluster #1 Of 1), Eukaryotic |
Eukaryotes |
200 |
0.39 |
Binding ≤ 10μM |
|
ITPR3-1-E |
Inositol 1,4,5-trisphosphate Receptor Type 3 (cluster #1 Of 1), Eukaryotic |
Eukaryotes |
5 |
0.48 |
Binding ≤ 10μM
|
|
ITPR1-1-E |
Inositol 1,4,5-trisphosphate Receptor Type 1 (cluster #1 Of 1), Eukaryotic |
Eukaryotes |
25 |
0.44 |
Functional ≤ 10μM
|
|
Z50591-2-O |
Bos Taurus (cluster #2 Of 3), Other |
Other |
10 |
0.47 |
Binding ≤ 10μM |
|
Z50597-4-O |
Rattus Norvegicus (cluster #4 Of 12), Other |
Other |
90 |
0.41 |
Functional ≤ 10μM
|
|
Z50597-4-O |
Rattus Norvegicus (cluster #4 Of 12), Other |
Other |
119 |
0.40 |
Functional ≤ 10μM
|
Physical Representations
|
Type
pH range
|
xlogP
|
Des A‑Pol
Apolar desolvation
(kcal/mol)
|
Des Pol
Polar desolvation
(kcal/mol)
|
H Don
H-bond donors
|
H Acc
H-bond acceptors
|
Chg
Net charge
|
tPSA
(Ų)
|
MWT
Molecular weight
(g/mol)
|
RB
Rotatable bonds
|
DL |
|
Ref
Reference (pH 7)
|
-4.71 |
-8.52 |
-463.16 |
4 |
15 |
-5 |
275 |
415.053 |
6 |
↓
|
|
Mid
Mid (pH 6-8)
|
-4.71 |
-8.49 |
-497.6 |
4 |
15 |
-5 |
275 |
415.053 |
6 |
↓
|
|
Mid
Mid (pH 6-8)
|
-4.71 |
-7.37 |
-637.17 |
3 |
15 |
-6 |
278 |
414.045 |
6 |
↓
|
|
|
|
Analogs
-
14556041
-
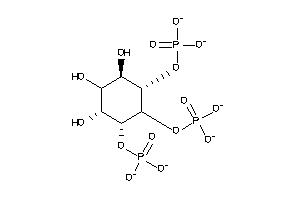
-
25757731
-
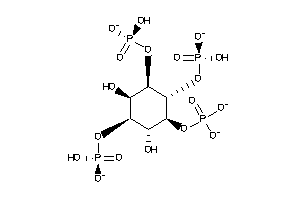
-
43308011
-
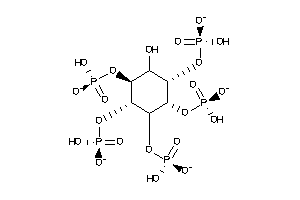
-
12494830
-
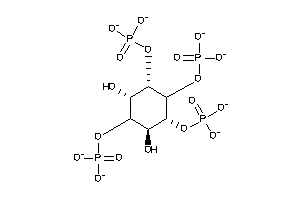
-
12494942
-
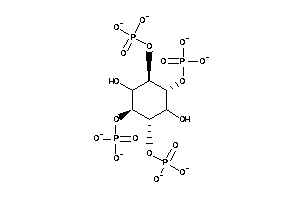
Draw
Identity
99%
90%
80%
70%
Vendors
Clustered Target Annotations
| Code |
Organism Class |
Affinity (nM) |
LE (kcal/mol/atom) |
Type |
|
ITPR1-1-E |
Inositol 1,4,5-trisphosphate Receptor Type 1 (cluster #1 Of 1), Eukaryotic |
Eukaryotes |
9 |
0.40 |
Binding ≤ 10μM |
|
ITPR2-1-E |
Inositol 1,4,5-trisphosphate Receptor Type 2 (cluster #1 Of 1), Eukaryotic |
Eukaryotes |
9 |
0.40 |
Binding ≤ 10μM |
|
ITPR3-1-E |
Inositol 1,4,5-trisphosphate Receptor Type 3 (cluster #1 Of 1), Eukaryotic |
Eukaryotes |
9 |
0.40 |
Binding ≤ 10μM |
|
Z50587-2-O |
Homo Sapiens (cluster #2 Of 9), Other |
Other |
3900 |
0.27 |
Functional ≤ 10μM |
|
Z50592-2-O |
Oryctolagus Cuniculus (cluster #2 Of 8), Other |
Other |
9670 |
0.25 |
Functional ≤ 10μM |
|
Z80471-1-O |
SH-SY5 (Bone Marrow Neuroblastoma Cells) (cluster #1 Of 3), Other |
Other |
77 |
0.36 |
Functional ≤ 10μM
|
Physical Representations
|
Type
pH range
|
xlogP
|
Des A‑Pol
Apolar desolvation
(kcal/mol)
|
Des Pol
Polar desolvation
(kcal/mol)
|
H Don
H-bond donors
|
H Acc
H-bond acceptors
|
Chg
Net charge
|
tPSA
(Ų)
|
MWT
Molecular weight
(g/mol)
|
RB
Rotatable bonds
|
DL |
|
Ref
Reference (pH 7)
|
-5.07 |
-9.46 |
-434.04 |
5 |
18 |
-5 |
322 |
495.032 |
8 |
↓
|
|
Mid
Mid (pH 6-8)
|
-5.07 |
-6.03 |
-993.35 |
2 |
18 |
-8 |
330 |
492.008 |
8 |
↓
|
|
Mid
Mid (pH 6-8)
|
-5.07 |
-7.17 |
-794.92 |
3 |
18 |
-7 |
327 |
493.016 |
8 |
↓
|
|
|
|
Analogs
Draw
Identity
99%
90%
80%
70%
Vendors
Clustered Target Annotations
| Code |
Organism Class |
Affinity (nM) |
LE (kcal/mol/atom) |
Type |
|
ITPR1-1-E |
Inositol 1,4,5-trisphosphate Receptor Type 1 (cluster #1 Of 1), Eukaryotic |
Eukaryotes |
9 |
0.40 |
Binding ≤ 10μM |
|
ITPR2-1-E |
Inositol 1,4,5-trisphosphate Receptor Type 2 (cluster #1 Of 1), Eukaryotic |
Eukaryotes |
9 |
0.40 |
Binding ≤ 10μM |
|
ITPR3-1-E |
Inositol 1,4,5-trisphosphate Receptor Type 3 (cluster #1 Of 1), Eukaryotic |
Eukaryotes |
9 |
0.40 |
Binding ≤ 10μM |
|
Z50587-2-O |
Homo Sapiens (cluster #2 Of 9), Other |
Other |
3900 |
0.27 |
Functional ≤ 10μM |
|
Z50592-2-O |
Oryctolagus Cuniculus (cluster #2 Of 8), Other |
Other |
9670 |
0.25 |
Functional ≤ 10μM |
|
Z80471-1-O |
SH-SY5 (Bone Marrow Neuroblastoma Cells) (cluster #1 Of 3), Other |
Other |
77 |
0.36 |
Functional ≤ 10μM
|
Physical Representations
|
Type
pH range
|
xlogP
|
Des A‑Pol
Apolar desolvation
(kcal/mol)
|
Des Pol
Polar desolvation
(kcal/mol)
|
H Don
H-bond donors
|
H Acc
H-bond acceptors
|
Chg
Net charge
|
tPSA
(Ų)
|
MWT
Molecular weight
(g/mol)
|
RB
Rotatable bonds
|
DL |
|
Ref
Reference (pH 7)
|
-5.07 |
-9.59 |
-433.57 |
5 |
18 |
-5 |
322 |
495.032 |
8 |
↓
|
|
Mid
Mid (pH 6-8)
|
-5.07 |
-7.3 |
-786.57 |
3 |
18 |
-7 |
327 |
493.016 |
8 |
↓
|
|
Mid
Mid (pH 6-8)
|
-5.07 |
-6.16 |
-991.09 |
2 |
18 |
-8 |
330 |
492.008 |
8 |
↓
|
|
|
|
Analogs
Draw
Identity
99%
90%
80%
70%
Vendors
Clustered Target Annotations
| Code |
Organism Class |
Affinity (nM) |
LE (kcal/mol/atom) |
Type |
|
ITPR1-1-E |
Inositol 1,4,5-trisphosphate Receptor Type 1 (cluster #1 Of 1), Eukaryotic |
Eukaryotes |
9 |
0.40 |
Binding ≤ 10μM |
|
ITPR2-1-E |
Inositol 1,4,5-trisphosphate Receptor Type 2 (cluster #1 Of 1), Eukaryotic |
Eukaryotes |
9 |
0.40 |
Binding ≤ 10μM |
|
ITPR3-1-E |
Inositol 1,4,5-trisphosphate Receptor Type 3 (cluster #1 Of 1), Eukaryotic |
Eukaryotes |
9 |
0.40 |
Binding ≤ 10μM |
|
Z50587-2-O |
Homo Sapiens (cluster #2 Of 9), Other |
Other |
3900 |
0.27 |
Functional ≤ 10μM |
|
Z50592-2-O |
Oryctolagus Cuniculus (cluster #2 Of 8), Other |
Other |
9670 |
0.25 |
Functional ≤ 10μM |
|
Z80471-1-O |
SH-SY5 (Bone Marrow Neuroblastoma Cells) (cluster #1 Of 3), Other |
Other |
77 |
0.36 |
Functional ≤ 10μM
|
Physical Representations
|
Type
pH range
|
xlogP
|
Des A‑Pol
Apolar desolvation
(kcal/mol)
|
Des Pol
Polar desolvation
(kcal/mol)
|
H Don
H-bond donors
|
H Acc
H-bond acceptors
|
Chg
Net charge
|
tPSA
(Ų)
|
MWT
Molecular weight
(g/mol)
|
RB
Rotatable bonds
|
DL |
|
Ref
Reference (pH 7)
|
-5.07 |
-9.91 |
-438.18 |
5 |
18 |
-5 |
322 |
495.032 |
8 |
↓
|
|
Mid
Mid (pH 6-8)
|
-5.07 |
-7.59 |
-789.92 |
3 |
18 |
-7 |
327 |
493.016 |
8 |
↓
|
|
Lo
Low (pH 4.5-6)
|
-5.07 |
-11.06 |
-288.63 |
6 |
18 |
-4 |
319 |
496.04 |
8 |
↓
|
|
|
|
Analogs
Draw
Identity
99%
90%
80%
70%
Vendors
Clustered Target Annotations
| Code |
Organism Class |
Affinity (nM) |
LE (kcal/mol/atom) |
Type |
|
ITPR1-1-E |
Inositol 1,4,5-trisphosphate Receptor Type 1 (cluster #1 Of 1), Eukaryotic |
Eukaryotes |
9 |
0.40 |
Binding ≤ 10μM |
|
ITPR2-1-E |
Inositol 1,4,5-trisphosphate Receptor Type 2 (cluster #1 Of 1), Eukaryotic |
Eukaryotes |
9 |
0.40 |
Binding ≤ 10μM |
|
ITPR3-1-E |
Inositol 1,4,5-trisphosphate Receptor Type 3 (cluster #1 Of 1), Eukaryotic |
Eukaryotes |
9 |
0.40 |
Binding ≤ 10μM |
|
Z50587-2-O |
Homo Sapiens (cluster #2 Of 9), Other |
Other |
3900 |
0.27 |
Functional ≤ 10μM |
|
Z50592-2-O |
Oryctolagus Cuniculus (cluster #2 Of 8), Other |
Other |
9670 |
0.25 |
Functional ≤ 10μM |
|
Z80471-1-O |
SH-SY5 (Bone Marrow Neuroblastoma Cells) (cluster #1 Of 3), Other |
Other |
77 |
0.36 |
Functional ≤ 10μM
|
Physical Representations
|
Type
pH range
|
xlogP
|
Des A‑Pol
Apolar desolvation
(kcal/mol)
|
Des Pol
Polar desolvation
(kcal/mol)
|
H Don
H-bond donors
|
H Acc
H-bond acceptors
|
Chg
Net charge
|
tPSA
(Ų)
|
MWT
Molecular weight
(g/mol)
|
RB
Rotatable bonds
|
DL |
|
Ref
Reference (pH 7)
|
-5.07 |
-9.72 |
-436.08 |
5 |
18 |
-5 |
322 |
495.032 |
8 |
↓
|
|
Mid
Mid (pH 6-8)
|
-5.07 |
-7.43 |
-792.66 |
3 |
18 |
-7 |
327 |
493.016 |
8 |
↓
|
|