|
|
|
|
|
|
|
|
|
|
|
|
|
|
Analogs
-
1552220
-
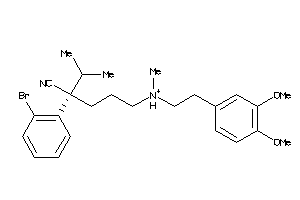
Draw
Identity
99%
90%
80%
70%
Vendors
And 4 More
Clustered Target Annotations
| Code |
Organism Class |
Affinity (nM) |
LE (kcal/mol/atom) |
Type |
|
MDR1-1-E |
P-glycoprotein 1 (cluster #1 Of 3), Eukaryotic |
Eukaryotes |
4240 |
0.24 |
Binding ≤ 10μM
|
|
CP3A4-2-E |
Cytochrome P450 3A4 (cluster #2 Of 4), Eukaryotic |
Eukaryotes |
5890 |
0.23 |
ADME/T ≤ 10μM
|
|
CP3A5-1-E |
Cytochrome P450 3A5 (cluster #1 Of 1), Eukaryotic |
Eukaryotes |
4530 |
0.23 |
ADME/T ≤ 10μM
|
Physical Representations
|
Type
pH range
|
xlogP
|
Des A‑Pol
Apolar desolvation
(kcal/mol)
|
Des Pol
Polar desolvation
(kcal/mol)
|
H Don
H-bond donors
|
H Acc
H-bond acceptors
|
Chg
Net charge
|
tPSA
(Ų)
|
MWT
Molecular weight
(g/mol)
|
RB
Rotatable bonds
|
DL |
|
Ref
Reference (pH 7)
|
3.96 |
10.65 |
-62.79 |
2 |
6 |
1 |
77 |
441.592 |
13 |
↓
|
|
|
|
Analogs
-
1552220
-

Draw
Identity
99%
90%
80%
70%
Vendors
And 3 More
Clustered Target Annotations
| Code |
Organism Class |
Affinity (nM) |
LE (kcal/mol/atom) |
Type |
|
MDR1-1-E |
P-glycoprotein 1 (cluster #1 Of 3), Eukaryotic |
Eukaryotes |
4240 |
0.24 |
Binding ≤ 10μM
|
|
CP3A4-2-E |
Cytochrome P450 3A4 (cluster #2 Of 4), Eukaryotic |
Eukaryotes |
5890 |
0.23 |
ADME/T ≤ 10μM
|
|
CP3A5-1-E |
Cytochrome P450 3A5 (cluster #1 Of 1), Eukaryotic |
Eukaryotes |
4530 |
0.23 |
ADME/T ≤ 10μM
|
Physical Representations
|
Type
pH range
|
xlogP
|
Des A‑Pol
Apolar desolvation
(kcal/mol)
|
Des Pol
Polar desolvation
(kcal/mol)
|
H Don
H-bond donors
|
H Acc
H-bond acceptors
|
Chg
Net charge
|
tPSA
(Ų)
|
MWT
Molecular weight
(g/mol)
|
RB
Rotatable bonds
|
DL |
|
Ref
Reference (pH 7)
|
3.96 |
10.64 |
-62.86 |
2 |
6 |
1 |
77 |
441.592 |
13 |
↓
|
|
|
|
Analogs
-
4193716
-
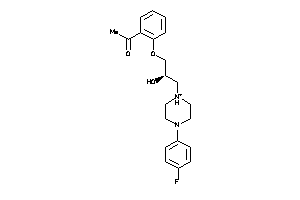
-
4193717
-
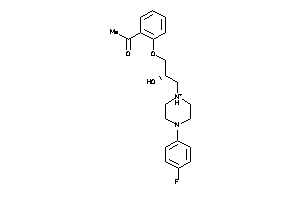
Draw
Identity
99%
90%
80%
70%
Vendors
And 4 More
Clustered Target Annotations
| Code |
Organism Class |
Affinity (nM) |
LE (kcal/mol/atom) |
Type |
|
MDR1-1-E |
P-glycoprotein 1 (cluster #1 Of 3), Eukaryotic |
Eukaryotes |
2087 |
0.29 |
Binding ≤ 10μM
|
|
Z80066-1-O |
CCRF-CEM/VCR-1000 (cluster #1 Of 1), Other |
Other |
3840 |
0.28 |
Functional ≤ 10μM
|
Physical Representations
|
Type
pH range
|
xlogP
|
Des A‑Pol
Apolar desolvation
(kcal/mol)
|
Des Pol
Polar desolvation
(kcal/mol)
|
H Don
H-bond donors
|
H Acc
H-bond acceptors
|
Chg
Net charge
|
tPSA
(Ų)
|
MWT
Molecular weight
(g/mol)
|
RB
Rotatable bonds
|
DL |
|
Ref
Reference (pH 7)
|
2.98 |
6.31 |
-14.31 |
1 |
5 |
0 |
53 |
372.44 |
7 |
↓
|
|
|
|
Analogs
-
4193716
-

-
4193717
-

Draw
Identity
99%
90%
80%
70%
Vendors
And 4 More
Clustered Target Annotations
| Code |
Organism Class |
Affinity (nM) |
LE (kcal/mol/atom) |
Type |
|
MDR1-1-E |
P-glycoprotein 1 (cluster #1 Of 3), Eukaryotic |
Eukaryotes |
2087 |
0.29 |
Binding ≤ 10μM
|
|
Z80066-1-O |
CCRF-CEM/VCR-1000 (cluster #1 Of 1), Other |
Other |
3840 |
0.28 |
Functional ≤ 10μM
|
Physical Representations
|
Type
pH range
|
xlogP
|
Des A‑Pol
Apolar desolvation
(kcal/mol)
|
Des Pol
Polar desolvation
(kcal/mol)
|
H Don
H-bond donors
|
H Acc
H-bond acceptors
|
Chg
Net charge
|
tPSA
(Ų)
|
MWT
Molecular weight
(g/mol)
|
RB
Rotatable bonds
|
DL |
|
Ref
Reference (pH 7)
|
2.98 |
6.39 |
-14.34 |
1 |
5 |
0 |
53 |
372.44 |
7 |
↓
|
|
|
|
Analogs
-
1999561
-

Draw
Identity
99%
90%
80%
70%
Vendors
Clustered Target Annotations
| Code |
Organism Class |
Affinity (nM) |
LE (kcal/mol/atom) |
Type |
|
MDR1-1-E |
P-glycoprotein 1 (cluster #1 Of 3), Eukaryotic |
Eukaryotes |
5500 |
0.31 |
Binding ≤ 10μM
|
Physical Representations
|
Type
pH range
|
xlogP
|
Des A‑Pol
Apolar desolvation
(kcal/mol)
|
Des Pol
Polar desolvation
(kcal/mol)
|
H Don
H-bond donors
|
H Acc
H-bond acceptors
|
Chg
Net charge
|
tPSA
(Ų)
|
MWT
Molecular weight
(g/mol)
|
RB
Rotatable bonds
|
DL |
|
Ref
Reference (pH 7)
|
2.10 |
-5.97 |
-47.54 |
5 |
6 |
1 |
87 |
338.472 |
10 |
↓
|
|
|
|
Analogs
-
4779
-

Draw
Identity
99%
90%
80%
70%
Vendors
Clustered Target Annotations
| Code |
Organism Class |
Affinity (nM) |
LE (kcal/mol/atom) |
Type |
|
MDR1-1-E |
P-glycoprotein 1 (cluster #1 Of 3), Eukaryotic |
Eukaryotes |
5500 |
0.31 |
Binding ≤ 10μM
|
Physical Representations
|
Type
pH range
|
xlogP
|
Des A‑Pol
Apolar desolvation
(kcal/mol)
|
Des Pol
Polar desolvation
(kcal/mol)
|
H Don
H-bond donors
|
H Acc
H-bond acceptors
|
Chg
Net charge
|
tPSA
(Ų)
|
MWT
Molecular weight
(g/mol)
|
RB
Rotatable bonds
|
DL |
|
Ref
Reference (pH 7)
|
2.10 |
-5.92 |
-47.37 |
5 |
6 |
1 |
87 |
338.472 |
10 |
↓
|
|
|
|
Analogs
-
22056448
-
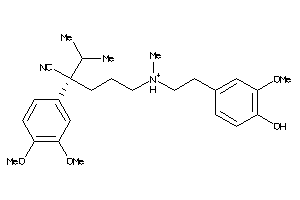
-
22056453
-
-
31474612
-
-
1552220
-

Draw
Identity
99%
90%
80%
70%
Vendors
And 54 More
Clustered Target Annotations
| Code |
Organism Class |
Affinity (nM) |
LE (kcal/mol/atom) |
Type |
|
CAC1C-1-E |
Voltage-gated L-type Calcium Channel Alpha-1C Subunit (cluster #1 Of 1), Eukaryotic |
Eukaryotes |
38 |
0.31 |
Binding ≤ 10μM
|
|
CAC1D-2-E |
Voltage-gated L-type Calcium Channel Alpha-1D Subunit (cluster #2 Of 2), Eukaryotic |
Eukaryotes |
38 |
0.31 |
Binding ≤ 10μM
|
|
CAC1S-1-E |
Voltage-gated L-type Calcium Channel Alpha-1S Subunit (cluster #1 Of 1), Eukaryotic |
Eukaryotes |
58 |
0.31 |
Binding ≤ 10μM
|
|
KCNH2-5-E |
HERG (cluster #5 Of 5), Eukaryotic |
Eukaryotes |
6850 |
0.22 |
Binding ≤ 10μM
|
|
MDR1-1-E |
P-glycoprotein 1 (cluster #1 Of 3), Eukaryotic |
Eukaryotes |
9800 |
0.21 |
Binding ≤ 10μM
|
|
MRP1-1-E |
Multidrug Resistance-associated Protein 1 (cluster #1 Of 1), Eukaryotic |
Eukaryotes |
9660 |
0.21 |
Binding ≤ 10μM
|
|
P97706-1-E |
Sodium Channel Protein Type VI Alpha Subunit (cluster #1 Of 1), Eukaryotic |
Eukaryotes |
2500 |
0.24 |
Binding ≤ 10μM
|
|
S22A1-1-E |
Solute Carrier Family 22 Member 1 (cluster #1 Of 1), Eukaryotic |
Eukaryotes |
6800 |
0.22 |
Binding ≤ 10μM
|
|
SCN1A-1-E |
Sodium Channel Protein Type I Alpha Subunit (cluster #1 Of 2), Eukaryotic |
Eukaryotes |
3300 |
0.23 |
Binding ≤ 10μM
|
|
SCN2A-1-E |
Sodium Channel Protein Type II Alpha Subunit (cluster #1 Of 2), Eukaryotic |
Eukaryotes |
3300 |
0.23 |
Binding ≤ 10μM
|
|
SCN3A-1-E |
Sodium Channel Protein Type III Alpha Subunit (cluster #1 Of 2), Eukaryotic |
Eukaryotes |
3300 |
0.23 |
Binding ≤ 10μM
|
|
SCN5A-1-E |
Sodium Channel Protein Type V Alpha Subunit (cluster #1 Of 1), Eukaryotic |
Eukaryotes |
2500 |
0.24 |
Binding ≤ 10μM
|
|
SCN8A-1-E |
Sodium Channel Protein Type VIII Alpha Subunit (cluster #1 Of 2), Eukaryotic |
Eukaryotes |
3300 |
0.23 |
Binding ≤ 10μM
|
|
TSPO-1-E |
Peripheral-type Benzodiazepine Receptor (cluster #1 Of 1), Eukaryotic |
Eukaryotes |
1 |
0.38 |
Binding ≤ 10μM
|
|
CAC1C-1-E |
Voltage-gated L-type Calcium Channel Alpha-1C Subunit (cluster #1 Of 1), Eukaryotic |
Eukaryotes |
38 |
0.31 |
Functional ≤ 10μM
|
|
CAC1D-1-E |
Voltage-gated L-type Calcium Channel Alpha-1D Subunit (cluster #1 Of 1), Eukaryotic |
Eukaryotes |
38 |
0.31 |
Functional ≤ 10μM
|
|
KCNH2-1-E |
HERG (cluster #1 Of 2), Eukaryotic |
Eukaryotes |
143 |
0.29 |
Functional ≤ 10μM
|
|
MDR1-1-E |
P-glycoprotein 1 (cluster #1 Of 2), Eukaryotic |
Eukaryotes |
6300 |
0.22 |
Functional ≤ 10μM
|
|
MDR3-1-E |
P-glycoprotein 3 (cluster #1 Of 2), Eukaryotic |
Eukaryotes |
10000 |
0.21 |
Functional ≤ 10μM
|
|
P97706-1-E |
Sodium Channel Protein Type VI Alpha Subunit (cluster #1 Of 1), Eukaryotic |
Eukaryotes |
2500 |
0.24 |
Functional ≤ 10μM
|
|
SCN5A-1-E |
Sodium Channel Protein Type V Alpha Subunit (cluster #1 Of 1), Eukaryotic |
Eukaryotes |
2500 |
0.24 |
Functional ≤ 10μM
|
|
CP3A4-2-E |
Cytochrome P450 3A4 (cluster #2 Of 4), Eukaryotic |
Eukaryotes |
6460 |
0.22 |
ADME/T ≤ 10μM
|
|
Z50425-11-O |
Plasmodium Falciparum (cluster #11 Of 22), Other |
Other |
800 |
0.26 |
Functional ≤ 10μM
|
|
Z50425-11-O |
Plasmodium Falciparum (cluster #11 Of 22), Other |
Other |
3162 |
0.23 |
Functional ≤ 10μM
|
|
Z50512-1-O |
Cavia Porcellus (cluster #1 Of 7), Other |
Other |
800 |
0.26 |
Functional ≤ 10μM
|
|
Z50592-3-O |
Oryctolagus Cuniculus (cluster #3 Of 8), Other |
Other |
300 |
0.28 |
Functional ≤ 10μM
|
|
Z50597-1-O |
Rattus Norvegicus (cluster #1 Of 12), Other |
Other |
47 |
0.31 |
Functional ≤ 10μM
|
|
Z80133-1-O |
EMT6 (Mammary Carcinoma Cells) (cluster #1 Of 3), Other |
Other |
5800 |
0.22 |
Functional ≤ 10μM
|
|
Z80224-1-O |
MCF7 (Breast Carcinoma Cells) (cluster #1 Of 14), Other |
Other |
53 |
0.31 |
Functional ≤ 10μM
|
|
Z80232-1-O |
MCF7-VP (cluster #1 Of 1), Other |
Other |
12 |
0.34 |
Functional ≤ 10μM
|
|
Z80362-1-O |
P388 (Lymphoma Cells) (cluster #1 Of 8), Other |
Other |
3100 |
0.23 |
Functional ≤ 10μM
|
|
Z80364-1-O |
P388/ADR (Lymphoma Cells) (cluster #1 Of 1), Other |
Other |
5 |
0.35 |
Functional ≤ 10μM
|
|
Z80532-1-O |
T-24 (Bladder Carcinoma Cells) (cluster #1 Of 6), Other |
Other |
7 |
0.35 |
Functional ≤ 10μM
|
|
Z80711-1-O |
NCI/ADR-RES (Breast Carcinoma Cells) (cluster #1 Of 2), Other |
Other |
6 |
0.35 |
Functional ≤ 10μM
|
|
Z80773-1-O |
CHRC/5 Cell Line (cluster #1 Of 1), Other |
Other |
3000 |
0.23 |
Functional ≤ 10μM
|
|
Z80774-1-O |
CHRC5 Cell Line (cluster #1 Of 1), Other |
Other |
1200 |
0.25 |
Functional ≤ 10μM |
|
Z80928-6-O |
HCT-116 (Colon Carcinoma Cells) (cluster #6 Of 9), Other |
Other |
500 |
0.27 |
Functional ≤ 10μM
|
|
Z81008-1-O |
Human Breast Cancer Cell Lines (cluster #1 Of 1), Other |
Other |
2400 |
0.24 |
Functional ≤ 10μM
|
|
Z81245-1-O |
MDA-MB-435 (Breast Carcinoma Cells) (cluster #1 Of 6), Other |
Other |
700 |
0.26 |
Functional ≤ 10μM
|
Physical Representations
|
Type
pH range
|
xlogP
|
Des A‑Pol
Apolar desolvation
(kcal/mol)
|
Des Pol
Polar desolvation
(kcal/mol)
|
H Don
H-bond donors
|
H Acc
H-bond acceptors
|
Chg
Net charge
|
tPSA
(Ų)
|
MWT
Molecular weight
(g/mol)
|
RB
Rotatable bonds
|
DL |
|
Ref
Reference (pH 7)
|
4.55 |
12.51 |
-58.32 |
1 |
6 |
1 |
65 |
455.619 |
13 |
↓
|
|
Hi
High (pH 8-9.5)
|
4.55 |
10.19 |
-15.26 |
0 |
6 |
0 |
64 |
454.611 |
13 |
↓
|
|
|
|
Analogs
Draw
Identity
99%
90%
80%
70%
Vendors
Clustered Target Annotations
| Code |
Organism Class |
Affinity (nM) |
LE (kcal/mol/atom) |
Type |
|
MDR1-1-E |
P-glycoprotein 1 (cluster #1 Of 3), Eukaryotic |
Eukaryotes |
1349 |
0.29 |
Binding ≤ 10μM
|
Physical Representations
|
Type
pH range
|
xlogP
|
Des A‑Pol
Apolar desolvation
(kcal/mol)
|
Des Pol
Polar desolvation
(kcal/mol)
|
H Don
H-bond donors
|
H Acc
H-bond acceptors
|
Chg
Net charge
|
tPSA
(Ų)
|
MWT
Molecular weight
(g/mol)
|
RB
Rotatable bonds
|
DL |
|
Ref
Reference (pH 7)
|
3.67 |
7.91 |
-10.67 |
1 |
5 |
0 |
53 |
382.504 |
7 |
↓
|
|
Mid
Mid (pH 6-8)
|
3.67 |
10.08 |
-49 |
2 |
5 |
1 |
54 |
383.512 |
7 |
↓
|
|
|
|
Analogs
Draw
Identity
99%
90%
80%
70%
Vendors
Clustered Target Annotations
| Code |
Organism Class |
Affinity (nM) |
LE (kcal/mol/atom) |
Type |
|
MDR1-1-E |
P-glycoprotein 1 (cluster #1 Of 3), Eukaryotic |
Eukaryotes |
1349 |
0.29 |
Binding ≤ 10μM
|
Physical Representations
|
Type
pH range
|
xlogP
|
Des A‑Pol
Apolar desolvation
(kcal/mol)
|
Des Pol
Polar desolvation
(kcal/mol)
|
H Don
H-bond donors
|
H Acc
H-bond acceptors
|
Chg
Net charge
|
tPSA
(Ų)
|
MWT
Molecular weight
(g/mol)
|
RB
Rotatable bonds
|
DL |
|
Ref
Reference (pH 7)
|
3.67 |
7.91 |
-10.85 |
1 |
5 |
0 |
53 |
382.504 |
7 |
↓
|
|
Mid
Mid (pH 6-8)
|
3.67 |
10.1 |
-49 |
2 |
5 |
1 |
54 |
383.512 |
7 |
↓
|
|
|
|
Analogs
-
39858285
-

-
39858286
-

Draw
Identity
99%
90%
80%
70%
Vendors
Clustered Target Annotations
| Code |
Organism Class |
Affinity (nM) |
LE (kcal/mol/atom) |
Type |
|
MDR1-1-E |
P-glycoprotein 1 (cluster #1 Of 3), Eukaryotic |
Eukaryotes |
357 |
0.33 |
Binding ≤ 10μM
|
Physical Representations
|
Type
pH range
|
xlogP
|
Des A‑Pol
Apolar desolvation
(kcal/mol)
|
Des Pol
Polar desolvation
(kcal/mol)
|
H Don
H-bond donors
|
H Acc
H-bond acceptors
|
Chg
Net charge
|
tPSA
(Ų)
|
MWT
Molecular weight
(g/mol)
|
RB
Rotatable bonds
|
DL |
|
Ref
Reference (pH 7)
|
3.81 |
0.52 |
-45.54 |
2 |
4 |
1 |
50 |
368.497 |
8 |
↓
|
|
|
|
Analogs
-
39858285
-

-
39858286
-

Draw
Identity
99%
90%
80%
70%
Vendors
Clustered Target Annotations
| Code |
Organism Class |
Affinity (nM) |
LE (kcal/mol/atom) |
Type |
|
MDR1-1-E |
P-glycoprotein 1 (cluster #1 Of 3), Eukaryotic |
Eukaryotes |
357 |
0.33 |
Binding ≤ 10μM
|
Physical Representations
|
Type
pH range
|
xlogP
|
Des A‑Pol
Apolar desolvation
(kcal/mol)
|
Des Pol
Polar desolvation
(kcal/mol)
|
H Don
H-bond donors
|
H Acc
H-bond acceptors
|
Chg
Net charge
|
tPSA
(Ų)
|
MWT
Molecular weight
(g/mol)
|
RB
Rotatable bonds
|
DL |
|
Ref
Reference (pH 7)
|
3.81 |
0.67 |
-44.5 |
2 |
4 |
1 |
50 |
368.497 |
8 |
↓
|
|
|
|
Analogs
Draw
Identity
99%
90%
80%
70%
Vendors
And 25 More
Physical Representations
|
Type
pH range
|
xlogP
|
Des A‑Pol
Apolar desolvation
(kcal/mol)
|
Des Pol
Polar desolvation
(kcal/mol)
|
H Don
H-bond donors
|
H Acc
H-bond acceptors
|
Chg
Net charge
|
tPSA
(Ų)
|
MWT
Molecular weight
(g/mol)
|
RB
Rotatable bonds
|
DL |
|
Ref
Reference (pH 7)
|
6.56 |
18.95 |
-45.51 |
1 |
3 |
1 |
31 |
470.677 |
10 |
↓
|
|
|
|
Analogs
Draw
Identity
99%
90%
80%
70%
Vendors
And 3 More
Clustered Target Annotations
| Code |
Organism Class |
Affinity (nM) |
LE (kcal/mol/atom) |
Type |
|
MDR1-1-E |
P-glycoprotein 1 (cluster #1 Of 3), Eukaryotic |
Eukaryotes |
599 |
0.32 |
Binding ≤ 10μM
|
|
Z80066-1-O |
CCRF-CEM/VCR-1000 (cluster #1 Of 1), Other |
Other |
680 |
0.32 |
Functional ≤ 10μM
|
Physical Representations
|
Type
pH range
|
xlogP
|
Des A‑Pol
Apolar desolvation
(kcal/mol)
|
Des Pol
Polar desolvation
(kcal/mol)
|
H Don
H-bond donors
|
H Acc
H-bond acceptors
|
Chg
Net charge
|
tPSA
(Ų)
|
MWT
Molecular weight
(g/mol)
|
RB
Rotatable bonds
|
DL |
|
Ref
Reference (pH 7)
|
4.08 |
0.34 |
-41.38 |
2 |
4 |
1 |
50 |
368.497 |
9 |
↓
|
|
|
|
Analogs
Draw
Identity
99%
90%
80%
70%
Vendors
And 3 More
Clustered Target Annotations
| Code |
Organism Class |
Affinity (nM) |
LE (kcal/mol/atom) |
Type |
|
MDR1-1-E |
P-glycoprotein 1 (cluster #1 Of 3), Eukaryotic |
Eukaryotes |
599 |
0.32 |
Binding ≤ 10μM
|
|
Z80066-1-O |
CCRF-CEM/VCR-1000 (cluster #1 Of 1), Other |
Other |
680 |
0.32 |
Functional ≤ 10μM
|
Physical Representations
|
Type
pH range
|
xlogP
|
Des A‑Pol
Apolar desolvation
(kcal/mol)
|
Des Pol
Polar desolvation
(kcal/mol)
|
H Don
H-bond donors
|
H Acc
H-bond acceptors
|
Chg
Net charge
|
tPSA
(Ų)
|
MWT
Molecular weight
(g/mol)
|
RB
Rotatable bonds
|
DL |
|
Ref
Reference (pH 7)
|
4.08 |
0.3 |
-41.44 |
2 |
4 |
1 |
50 |
368.497 |
9 |
↓
|
|
|
|
|
|
|
Analogs
Draw
Identity
99%
90%
80%
70%
Vendors
And 2 More
Clustered Target Annotations
| Code |
Organism Class |
Affinity (nM) |
LE (kcal/mol/atom) |
Type |
|
5HT1A-1-E |
Serotonin 1a (5-HT1a) Receptor (cluster #1 Of 4), Eukaryotic |
Eukaryotes |
29 |
0.39 |
Binding ≤ 10μM
|
|
EBP-1-E |
3-beta-hydroxysteroid-delta(8),delta(7)-isomerase (cluster #1 Of 1), Eukaryotic |
Eukaryotes |
8 |
0.42 |
Binding ≤ 10μM
|
|
MDR1-1-E |
P-glycoprotein 1 (cluster #1 Of 3), Eukaryotic |
Eukaryotes |
550 |
0.32 |
Binding ≤ 10μM
|
|
SGMR1-1-E |
Sigma Opioid Receptor (cluster #1 Of 6), Eukaryotic |
Eukaryotes |
6 |
0.43 |
Binding ≤ 10μM
|
|
SGMR1-1-E |
Sigma Opioid Receptor (cluster #1 Of 6), Eukaryotic |
Eukaryotes |
14 |
0.41 |
Binding ≤ 10μM
|
|
SGMR1-1-E |
Sigma Opioid Receptor (cluster #1 Of 6), Eukaryotic |
Eukaryotes |
71 |
0.37 |
Binding ≤ 10μM
|
|
DRD2-2-E |
Dopamine D2 Receptor (cluster #2 Of 24), Eukaryotic |
Eukaryotes |
604 |
0.32 |
Binding ≤ 10μM
|
|
Z100491-1-O |
Sigma 2 Receptor (cluster #1 Of 2), Other |
Other |
0 |
0.00 |
Binding ≤ 10μM
|
|
Z100491-1-O |
Sigma 2 Receptor (cluster #1 Of 2), Other |
Other |
2 |
0.45 |
Binding ≤ 10μM
|
|
Z50512-1-O |
Cavia Porcellus (cluster #1 Of 7), Other |
Other |
1500 |
0.30 |
Functional ≤ 10μM
|
|
Z50512-1-O |
Cavia Porcellus (cluster #1 Of 7), Other |
Other |
2620 |
0.29 |
Functional ≤ 10μM
|
|
Z80390-3-O |
PC-3 (Prostate Carcinoma Cells) (cluster #3 Of 10), Other |
Other |
38 |
0.38 |
Functional ≤ 10μM
|
|
Z80492-2-O |
SK-N-SH (Neuroblastoma Cells) (cluster #2 Of 2), Other |
Other |
9070 |
0.26 |
Functional ≤ 10μM
|
|
Z80492-2-O |
SK-N-SH (Neuroblastoma Cells) (cluster #2 Of 2), Other |
Other |
9970 |
0.26 |
Functional ≤ 10μM
|
Physical Representations
|
Type
pH range
|
xlogP
|
Des A‑Pol
Apolar desolvation
(kcal/mol)
|
Des Pol
Polar desolvation
(kcal/mol)
|
H Don
H-bond donors
|
H Acc
H-bond acceptors
|
Chg
Net charge
|
tPSA
(Ų)
|
MWT
Molecular weight
(g/mol)
|
RB
Rotatable bonds
|
DL |
|
Ref
Reference (pH 7)
|
5.07 |
12.02 |
-35.51 |
1 |
3 |
1 |
17 |
371.589 |
6 |
↓
|
|
Hi
High (pH 8-9.5)
|
5.07 |
9.8 |
-3.9 |
0 |
3 |
0 |
16 |
370.581 |
6 |
↓
|
|
|
|
Analogs
Draw
Identity
99%
90%
80%
70%
Vendors
And 2 More
Clustered Target Annotations
| Code |
Organism Class |
Affinity (nM) |
LE (kcal/mol/atom) |
Type |
|
5HT1A-1-E |
Serotonin 1a (5-HT1a) Receptor (cluster #1 Of 4), Eukaryotic |
Eukaryotes |
29 |
0.39 |
Binding ≤ 10μM
|
|
EBP-1-E |
3-beta-hydroxysteroid-delta(8),delta(7)-isomerase (cluster #1 Of 1), Eukaryotic |
Eukaryotes |
8 |
0.42 |
Binding ≤ 10μM
|
|
MDR1-1-E |
P-glycoprotein 1 (cluster #1 Of 3), Eukaryotic |
Eukaryotes |
550 |
0.32 |
Binding ≤ 10μM
|
|
SGMR1-1-E |
Sigma Opioid Receptor (cluster #1 Of 6), Eukaryotic |
Eukaryotes |
2 |
0.45 |
Binding ≤ 10μM
|
|
SGMR1-1-E |
Sigma Opioid Receptor (cluster #1 Of 6), Eukaryotic |
Eukaryotes |
14 |
0.41 |
Binding ≤ 10μM
|
|
SGMR1-1-E |
Sigma Opioid Receptor (cluster #1 Of 6), Eukaryotic |
Eukaryotes |
71 |
0.37 |
Binding ≤ 10μM
|
|
DRD2-2-E |
Dopamine D2 Receptor (cluster #2 Of 24), Eukaryotic |
Eukaryotes |
604 |
0.32 |
Binding ≤ 10μM
|
|
Z100491-1-O |
Sigma 2 Receptor (cluster #1 Of 2), Other |
Other |
0 |
0.00 |
Binding ≤ 10μM
|
|
Z100491-1-O |
Sigma 2 Receptor (cluster #1 Of 2), Other |
Other |
9 |
0.42 |
Binding ≤ 10μM
|
|
Z50512-1-O |
Cavia Porcellus (cluster #1 Of 7), Other |
Other |
1750 |
0.30 |
Functional ≤ 10μM
|
|
Z50512-1-O |
Cavia Porcellus (cluster #1 Of 7), Other |
Other |
2620 |
0.29 |
Functional ≤ 10μM
|
|
Z80390-3-O |
PC-3 (Prostate Carcinoma Cells) (cluster #3 Of 10), Other |
Other |
38 |
0.38 |
Functional ≤ 10μM
|
|
Z80492-2-O |
SK-N-SH (Neuroblastoma Cells) (cluster #2 Of 2), Other |
Other |
9370 |
0.26 |
Functional ≤ 10μM
|
|
Z80492-2-O |
SK-N-SH (Neuroblastoma Cells) (cluster #2 Of 2), Other |
Other |
9970 |
0.26 |
Functional ≤ 10μM
|
Physical Representations
|
Type
pH range
|
xlogP
|
Des A‑Pol
Apolar desolvation
(kcal/mol)
|
Des Pol
Polar desolvation
(kcal/mol)
|
H Don
H-bond donors
|
H Acc
H-bond acceptors
|
Chg
Net charge
|
tPSA
(Ų)
|
MWT
Molecular weight
(g/mol)
|
RB
Rotatable bonds
|
DL |
|
Ref
Reference (pH 7)
|
5.07 |
12.01 |
-35.57 |
1 |
3 |
1 |
17 |
371.589 |
6 |
↓
|
|
Hi
High (pH 8-9.5)
|
5.07 |
9.8 |
-3.91 |
0 |
3 |
0 |
16 |
370.581 |
6 |
↓
|
|
|
|
Analogs
-
5750285
-
-
36464350
-
Draw
Identity
99%
90%
80%
70%
Vendors
And 27 More
Clustered Target Annotations
| Code |
Organism Class |
Affinity (nM) |
LE (kcal/mol/atom) |
Type |
|
5HT1A-1-E |
Serotonin 1a (5-HT1a) Receptor (cluster #1 Of 4), Eukaryotic |
Eukaryotes |
7000 |
0.28 |
Binding ≤ 10μM
|
|
5HT1B-1-E |
Serotonin 1b (5-HT1b) Receptor (cluster #1 Of 2), Eukaryotic |
Eukaryotes |
400 |
0.34 |
Binding ≤ 10μM
|
|
5HT1D-1-E |
Serotonin 1d (5-HT1d) Receptor (cluster #1 Of 2), Eukaryotic |
Eukaryotes |
400 |
0.34 |
Binding ≤ 10μM
|
|
5HT1E-1-E |
Serotonin 1e (5-HT1e) Receptor (cluster #1 Of 2), Eukaryotic |
Eukaryotes |
400 |
0.34 |
Binding ≤ 10μM
|
|
5HT1F-1-E |
Serotonin 1f (5-HT1f) Receptor (cluster #1 Of 2), Eukaryotic |
Eukaryotes |
400 |
0.34 |
Binding ≤ 10μM
|
|
5HT2A-1-E |
Serotonin 2a (5-HT2a) Receptor (cluster #1 Of 3), Eukaryotic |
Eukaryotes |
30 |
0.41 |
Binding ≤ 10μM
|
|
5HT2B-2-E |
Serotonin 2b (5-HT2b) Receptor (cluster #2 Of 4), Eukaryotic |
Eukaryotes |
27 |
0.41 |
Binding ≤ 10μM
|
|
5HT2C-2-E |
Serotonin 2c (5-HT2c) Receptor (cluster #2 Of 3), Eukaryotic |
Eukaryotes |
27 |
0.41 |
Binding ≤ 10μM
|
|
5HT6R-1-E |
Serotonin 6 (5-HT6) Receptor (cluster #1 Of 2), Eukaryotic |
Eukaryotes |
6000 |
0.28 |
Binding ≤ 10μM
|
|
5HT7R-1-E |
Serotonin 7 (5-HT7) Receptor (cluster #1 Of 3), Eukaryotic |
Eukaryotes |
263 |
0.35 |
Binding ≤ 10μM
|
|
ACM1-3-E |
Muscarinic Acetylcholine Receptor M1 (cluster #3 Of 5), Eukaryotic |
Eukaryotes |
5500 |
0.28 |
Binding ≤ 10μM
|
|
ACM2-1-E |
Muscarinic Acetylcholine Receptor M2 (cluster #1 Of 6), Eukaryotic |
Eukaryotes |
6120 |
0.28 |
Binding ≤ 10μM
|
|
ACM3-1-E |
Muscarinic Acetylcholine Receptor M3 (cluster #1 Of 5), Eukaryotic |
Eukaryotes |
4670 |
0.29 |
Binding ≤ 10μM
|
|
ACM4-1-E |
Muscarinic Acetylcholine Receptor M4 (cluster #1 Of 6), Eukaryotic |
Eukaryotes |
4670 |
0.29 |
Binding ≤ 10μM
|
|
ACM5-2-E |
Muscarinic Acetylcholine Receptor M5 (cluster #2 Of 4), Eukaryotic |
Eukaryotes |
4670 |
0.29 |
Binding ≤ 10μM
|
|
ADA1A-1-E |
Alpha-1a Adrenergic Receptor (cluster #1 Of 3), Eukaryotic |
Eukaryotes |
19 |
0.42 |
Binding ≤ 10μM
|
|
ADA1B-1-E |
Alpha-1b Adrenergic Receptor (cluster #1 Of 4), Eukaryotic |
Eukaryotes |
6 |
0.44 |
Binding ≤ 10μM
|
|
ADA1D-1-E |
Alpha-1d Adrenergic Receptor (cluster #1 Of 3), Eukaryotic |
Eukaryotes |
6 |
0.44 |
Binding ≤ 10μM
|
|
ADA2A-1-E |
Alpha-2a Adrenergic Receptor (cluster #1 Of 4), Eukaryotic |
Eukaryotes |
9600 |
0.27 |
Binding ≤ 10μM
|
|
ADA2B-1-E |
Alpha-2b Adrenergic Receptor (cluster #1 Of 4), Eukaryotic |
Eukaryotes |
9600 |
0.27 |
Binding ≤ 10μM
|
|
ADA2C-1-E |
Alpha-2c Adrenergic Receptor (cluster #1 Of 4), Eukaryotic |
Eukaryotes |
9600 |
0.27 |
Binding ≤ 10μM
|
|
AP2S1-1-E |
AP-2 Complex Subunit Sigma (cluster #1 Of 1), Eukaryotic |
Eukaryotes |
24 |
0.41 |
Binding ≤ 10μM
|
|
DRD1-1-E |
Dopamine D1 Receptor (cluster #1 Of 4), Eukaryotic |
Eukaryotes |
500 |
0.34 |
Binding ≤ 10μM
|
|
DRD3-1-E |
Dopamine D3 Receptor (cluster #1 Of 2), Eukaryotic |
Eukaryotes |
6 |
0.44 |
Binding ≤ 10μM
|
|
DRD4-3-E |
Dopamine D4 Receptor (cluster #3 Of 4), Eukaryotic |
Eukaryotes |
13 |
0.42 |
Binding ≤ 10μM
|
|
DRD5-1-E |
Dopamine D5 Receptor (cluster #1 Of 1), Eukaryotic |
Eukaryotes |
9 |
0.43 |
Binding ≤ 10μM
|
|
EBP-1-E |
3-beta-hydroxysteroid-delta(8),delta(7)-isomerase (cluster #1 Of 1), Eukaryotic |
Eukaryotes |
190 |
0.36 |
Binding ≤ 10μM
|
|
HRH1-1-E |
Histamine H1 Receptor (cluster #1 Of 2), Eukaryotic |
Eukaryotes |
730 |
0.33 |
Binding ≤ 10μM
|
|
KCNH2-5-E |
HERG (cluster #5 Of 5), Eukaryotic |
Eukaryotes |
7520 |
0.28 |
Binding ≤ 10μM
|
|
MDR1-1-E |
P-glycoprotein 1 (cluster #1 Of 3), Eukaryotic |
Eukaryotes |
5300 |
0.28 |
Binding ≤ 10μM
|
|
OPRD-1-E |
Delta Opioid Receptor (cluster #1 Of 3), Eukaryotic |
Eukaryotes |
5687 |
0.28 |
Binding ≤ 10μM
|
|
OPRK-1-E |
Kappa Opioid Receptor (cluster #1 Of 6), Eukaryotic |
Eukaryotes |
5687 |
0.28 |
Binding ≤ 10μM
|
|
OPRM-1-E |
Mu-type Opioid Receptor (cluster #1 Of 4), Eukaryotic |
Eukaryotes |
5687 |
0.28 |
Binding ≤ 10μM
|
|
Q63380-1-E |
Transporter (cluster #1 Of 1), Eukaryotic |
Eukaryotes |
5500 |
0.28 |
Binding ≤ 10μM
|
|
SC6A4-3-E |
Serotonin Transporter (cluster #3 Of 4), Eukaryotic |
Eukaryotes |
1800 |
0.31 |
Binding ≤ 10μM
|
|
SCN1A-2-E |
Sodium Channel Protein Type I Alpha Subunit (cluster #2 Of 2), Eukaryotic |
Eukaryotes |
1200 |
0.32 |
Binding ≤ 10μM
|
|
SCN2A-1-E |
Sodium Channel Protein Type II Alpha Subunit (cluster #1 Of 2), Eukaryotic |
Eukaryotes |
1200 |
0.32 |
Binding ≤ 10μM
|
|
SCN3A-2-E |
Sodium Channel Protein Type III Alpha Subunit (cluster #2 Of 2), Eukaryotic |
Eukaryotes |
1200 |
0.32 |
Binding ≤ 10μM
|
|
SCN8A-2-E |
Sodium Channel Protein Type VIII Alpha Subunit (cluster #2 Of 2), Eukaryotic |
Eukaryotes |
1200 |
0.32 |
Binding ≤ 10μM
|
|
SGMR1-1-E |
Sigma Opioid Receptor (cluster #1 Of 6), Eukaryotic |
Eukaryotes |
6 |
0.44 |
Binding ≤ 10μM
|
|
DRD1-1-E |
Dopamine D1 Receptor (cluster #1 Of 1), Eukaryotic |
Eukaryotes |
550 |
0.34 |
Functional ≤ 10μM
|
|
KCNH2-1-E |
HERG (cluster #1 Of 2), Eukaryotic |
Eukaryotes |
28 |
0.41 |
Functional ≤ 10μM
|
|
DRD2-2-E |
Dopamine D2 Receptor (cluster #2 Of 24), Eukaryotic |
Eukaryotes |
6 |
0.44 |
Binding ≤ 10μM
|
|
ERG2-2-F |
C-8 Sterol Isomerase (cluster #2 Of 2), Fungal |
Fungi |
1 |
0.48 |
Binding ≤ 10μM
|
|
Z100491-1-O |
Sigma 2 Receptor (cluster #1 Of 2), Other |
Other |
70 |
0.39 |
Binding ≤ 10μM
|
|
Z104303-1-O |
Muscarinic Acetylcholine Receptor (cluster #1 Of 7), Other |
Other |
7466 |
0.28 |
Binding ≤ 10μM
|
|
Z104304-1-O |
Adrenergic Receptor Alpha-1 (cluster #1 Of 3), Other |
Other |
9 |
0.43 |
Binding ≤ 10μM
|
|
Z103204-1-O |
A427 (cluster #1 Of 4), Other |
Other |
10000 |
0.27 |
Functional ≤ 10μM
|
|
Z50425-3-O |
Plasmodium Falciparum (cluster #3 Of 22), Other |
Other |
3162 |
0.30 |
Functional ≤ 10μM
|
|
Z50466-1-O |
Trypanosoma Cruzi (cluster #1 Of 8), Other |
Other |
7000 |
0.28 |
Functional ≤ 10μM
|
|
Z50597-1-O |
Rattus Norvegicus (cluster #1 Of 12), Other |
Other |
10 |
0.43 |
Functional ≤ 10μM
|
|
Z80091-1-O |
CHO-hD3 (cluster #1 Of 1), Other |
Other |
9 |
0.43 |
Functional ≤ 10μM
|
|
Q4U254-1-V |
Human Rhinovirus A Protease (cluster #1 Of 3), Viral |
Viruses |
100 |
0.38 |
Binding ≤ 10μM
|
|
Q72874-1-V |
Human Immunodeficiency Virus Type 1 Protease (cluster #1 Of 3), Viral |
Viruses |
100 |
0.38 |
Binding ≤ 10μM
|
Physical Representations
|
Type
pH range
|
xlogP
|
Des A‑Pol
Apolar desolvation
(kcal/mol)
|
Des Pol
Polar desolvation
(kcal/mol)
|
H Don
H-bond donors
|
H Acc
H-bond acceptors
|
Chg
Net charge
|
tPSA
(Ų)
|
MWT
Molecular weight
(g/mol)
|
RB
Rotatable bonds
|
DL |
|
Ref
Reference (pH 7)
|
4.30 |
10.74 |
-49.71 |
2 |
3 |
1 |
42 |
376.879 |
6 |
↓
|
|
|
|
Analogs
-
1530760
-
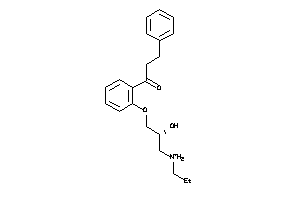
-
3644929
-
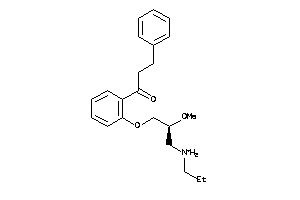
Draw
Identity
99%
90%
80%
70%
Vendors
And 30 More
Physical Representations
|
Type
pH range
|
xlogP
|
Des A‑Pol
Apolar desolvation
(kcal/mol)
|
Des Pol
Polar desolvation
(kcal/mol)
|
H Don
H-bond donors
|
H Acc
H-bond acceptors
|
Chg
Net charge
|
tPSA
(Ų)
|
MWT
Molecular weight
(g/mol)
|
RB
Rotatable bonds
|
DL |
|
Ref
Reference (pH 7)
|
3.46 |
9.64 |
-45.96 |
3 |
4 |
1 |
63 |
342.459 |
11 |
↓
|
|
Hi
High (pH 8-9.5)
|
3.46 |
8.3 |
-12.17 |
2 |
4 |
0 |
59 |
341.451 |
11 |
↓
|
|
|
|
Analogs
-
3644929
-

-
1530759
-
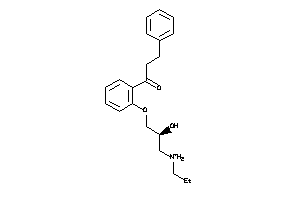
Draw
Identity
99%
90%
80%
70%
Vendors
And 30 More
Physical Representations
|
Type
pH range
|
xlogP
|
Des A‑Pol
Apolar desolvation
(kcal/mol)
|
Des Pol
Polar desolvation
(kcal/mol)
|
H Don
H-bond donors
|
H Acc
H-bond acceptors
|
Chg
Net charge
|
tPSA
(Ų)
|
MWT
Molecular weight
(g/mol)
|
RB
Rotatable bonds
|
DL |
|
Ref
Reference (pH 7)
|
3.46 |
9.61 |
-45.97 |
3 |
4 |
1 |
63 |
342.459 |
11 |
↓
|
|
Hi
High (pH 8-9.5)
|
3.46 |
8.19 |
-12.18 |
2 |
4 |
0 |
59 |
341.451 |
11 |
↓
|
|
|
|
Analogs
-
1530690
-
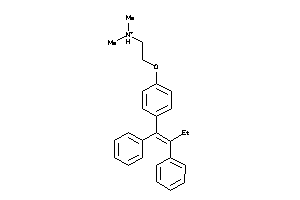
-
1849472
-
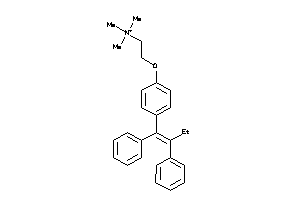
-
8602413
-
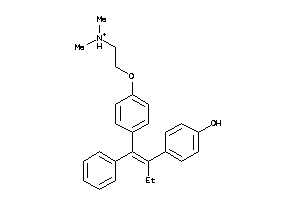
-
13319948
-
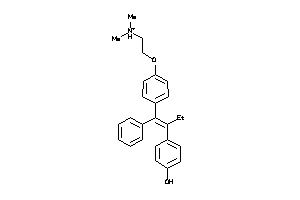
-
44699472
-
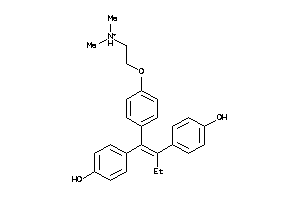
Draw
Identity
99%
90%
80%
70%
Vendors
And 43 More
Clustered Target Annotations
| Code |
Organism Class |
Affinity (nM) |
LE (kcal/mol/atom) |
Type |
|
EBP-1-E |
3-beta-hydroxysteroid-delta(8),delta(7)-isomerase (cluster #1 Of 1), Eukaryotic |
Eukaryotes |
5 |
0.42 |
Binding ≤ 10μM
|
|
ESR1-1-E |
Estrogen Receptor Alpha (cluster #1 Of 5), Eukaryotic |
Eukaryotes |
8 |
0.40 |
Binding ≤ 10μM
|
|
ESR2-1-E |
Estrogen Receptor Beta (cluster #1 Of 4), Eukaryotic |
Eukaryotes |
3900 |
0.27 |
Binding ≤ 10μM
|
|
KCNH2-2-E |
HERG (cluster #2 Of 5), Eukaryotic |
Eukaryotes |
1585 |
0.29 |
Binding ≤ 10μM
|
|
MDR1-1-E |
P-glycoprotein 1 (cluster #1 Of 3), Eukaryotic |
Eukaryotes |
100 |
0.35 |
Binding ≤ 10μM
|
|
O77823-1-E |
Phosphodiesterase 4A (cluster #1 Of 1), Eukaryotic |
Eukaryotes |
6800 |
0.26 |
Binding ≤ 10μM
|
|
PDE1A-1-E |
Phosphodiesterase 1A (cluster #1 Of 1), Eukaryotic |
Eukaryotes |
6800 |
0.26 |
Binding ≤ 10μM
|
|
PDE1B-1-E |
Phosphodiesterase 1B (cluster #1 Of 1), Eukaryotic |
Eukaryotes |
6750 |
0.26 |
Binding ≤ 10μM
|
|
PDE1C-1-E |
Phosphodiesterase 1C (cluster #1 Of 1), Eukaryotic |
Eukaryotes |
6800 |
0.26 |
Binding ≤ 10μM
|
|
Q8AWE3-1-E |
Serine-threonine Protein Phosphatase 2A Regulatory Subunit (cluster #1 Of 1), Eukaryotic |
Eukaryotes |
3400 |
0.27 |
Binding ≤ 10μM
|
|
SGMR1-1-E |
Sigma Opioid Receptor (cluster #1 Of 6), Eukaryotic |
Eukaryotes |
35 |
0.37 |
Binding ≤ 10μM
|
|
ESR1-1-E |
Estrogen Receptor Alpha (cluster #1 Of 3), Eukaryotic |
Eukaryotes |
904 |
0.30 |
Functional ≤ 10μM
|
|
ESR2-1-E |
Estrogen Receptor Beta (cluster #1 Of 2), Eukaryotic |
Eukaryotes |
904 |
0.30 |
Functional ≤ 10μM
|
|
CP2B6-2-E |
Cytochrome P450 2B6 (cluster #2 Of 4), Eukaryotic |
Eukaryotes |
900 |
0.30 |
ADME/T ≤ 10μM
|
|
CP3A4-2-E |
Cytochrome P450 3A4 (cluster #2 Of 4), Eukaryotic |
Eukaryotes |
200 |
0.33 |
ADME/T ≤ 10μM
|
|
ERG2-2-F |
C-8 Sterol Isomerase (cluster #2 Of 2), Fungal |
Fungi |
1500 |
0.29 |
Binding ≤ 10μM
|
|
Z100267-1-O |
Anti-estrogen Binding Site (AEBS) (cluster #1 Of 1), Other |
Other |
12 |
0.40 |
Binding ≤ 10μM
|
|
Z50425-11-O |
Plasmodium Falciparum (cluster #11 Of 22), Other |
Other |
7943 |
0.26 |
Functional ≤ 10μM
|
|
Z80132-2-O |
EL4 (Thymoma Cells) (cluster #2 Of 2), Other |
Other |
535 |
0.31 |
Functional ≤ 10μM
|
|
Z80224-1-O |
MCF7 (Breast Carcinoma Cells) (cluster #1 Of 14), Other |
Other |
904 |
0.30 |
Functional ≤ 10μM
|
|
Z80227-1-O |
MCF7-ADR (Breast Carcinoma Cells) (cluster #1 Of 2), Other |
Other |
2000 |
0.28 |
Functional ≤ 10μM
|
|
Z80231-2-O |
MCF7S (Breast Carcinoma Cells) (cluster #2 Of 2), Other |
Other |
7200 |
0.26 |
Functional ≤ 10μM
|
|
Z80296-1-O |
MVLN (cluster #1 Of 1), Other |
Other |
300 |
0.33 |
Functional ≤ 10μM
|
|
Z80712-2-O |
T47D (Breast Carcinoma Cells) (cluster #2 Of 7), Other |
Other |
1000 |
0.30 |
Functional ≤ 10μM
|
|
Z81068-1-O |
Ishikawa (Uterine Carcinoma Cells) (cluster #1 Of 1), Other |
Other |
420 |
0.32 |
Functional ≤ 10μM
|
|
Z81245-1-O |
MDA-MB-435 (Breast Carcinoma Cells) (cluster #1 Of 6), Other |
Other |
50 |
0.37 |
Functional ≤ 10μM
|
|
Z81252-1-O |
MDA-MB-231 (Breast Adenocarcinoma Cells) (cluster #1 Of 11), Other |
Other |
9860 |
0.25 |
Functional ≤ 10μM
|
|
Z80936-1-O |
HEK293 (Embryonic Kidney Fibroblasts) (cluster #1 Of 4), Other |
Other |
10000 |
0.25 |
ADME/T ≤ 10μM |
Physical Representations
|
Type
pH range
|
xlogP
|
Des A‑Pol
Apolar desolvation
(kcal/mol)
|
Des Pol
Polar desolvation
(kcal/mol)
|
H Don
H-bond donors
|
H Acc
H-bond acceptors
|
Chg
Net charge
|
tPSA
(Ų)
|
MWT
Molecular weight
(g/mol)
|
RB
Rotatable bonds
|
DL |
|
Ref
Reference (pH 7)
|
6.06 |
15.81 |
-35.9 |
1 |
2 |
1 |
14 |
372.532 |
8 |
↓
|
|
Hi
High (pH 8-9.5)
|
6.06 |
13.36 |
-4.97 |
0 |
2 |
0 |
12 |
371.524 |
8 |
↓
|
|
|
|
Analogs
-
39291113
-
-
39291115
-
-
3644929
-

Draw
Identity
99%
90%
80%
70%
Vendors
And 3 More
Clustered Target Annotations
| Code |
Organism Class |
Affinity (nM) |
LE (kcal/mol/atom) |
Type |
|
MDR1-1-E |
P-glycoprotein 1 (cluster #1 Of 3), Eukaryotic |
Eukaryotes |
907 |
0.33 |
Binding ≤ 10μM
|
|
Z80066-1-O |
CCRF-CEM/VCR-1000 (cluster #1 Of 1), Other |
Other |
910 |
0.33 |
Functional ≤ 10μM
|
Physical Representations
|
Type
pH range
|
xlogP
|
Des A‑Pol
Apolar desolvation
(kcal/mol)
|
Des Pol
Polar desolvation
(kcal/mol)
|
H Don
H-bond donors
|
H Acc
H-bond acceptors
|
Chg
Net charge
|
tPSA
(Ų)
|
MWT
Molecular weight
(g/mol)
|
RB
Rotatable bonds
|
DL |
|
Ref
Reference (pH 7)
|
3.93 |
11.16 |
-40.57 |
2 |
4 |
1 |
51 |
356.486 |
11 |
↓
|
|
|
|
Analogs
-
39291113
-

-
39291115
-

-
3644929
-

Draw
Identity
99%
90%
80%
70%
Vendors
And 3 More
Clustered Target Annotations
| Code |
Organism Class |
Affinity (nM) |
LE (kcal/mol/atom) |
Type |
|
MDR1-1-E |
P-glycoprotein 1 (cluster #1 Of 3), Eukaryotic |
Eukaryotes |
907 |
0.33 |
Binding ≤ 10μM
|
|
Z80066-1-O |
CCRF-CEM/VCR-1000 (cluster #1 Of 1), Other |
Other |
910 |
0.33 |
Functional ≤ 10μM
|
Physical Representations
|
Type
pH range
|
xlogP
|
Des A‑Pol
Apolar desolvation
(kcal/mol)
|
Des Pol
Polar desolvation
(kcal/mol)
|
H Don
H-bond donors
|
H Acc
H-bond acceptors
|
Chg
Net charge
|
tPSA
(Ų)
|
MWT
Molecular weight
(g/mol)
|
RB
Rotatable bonds
|
DL |
|
Ref
Reference (pH 7)
|
3.93 |
11.46 |
-40.09 |
2 |
4 |
1 |
51 |
356.486 |
11 |
↓
|
|
|
|
Analogs
Draw
Identity
99%
90%
80%
70%
Vendors
And 4 More
Clustered Target Annotations
| Code |
Organism Class |
Affinity (nM) |
LE (kcal/mol/atom) |
Type |
|
MDR1-1-E |
P-glycoprotein 1 (cluster #1 Of 3), Eukaryotic |
Eukaryotes |
3645 |
0.28 |
Binding ≤ 10μM
|
|
Z80066-1-O |
CCRF-CEM/VCR-1000 (cluster #1 Of 1), Other |
Other |
3750 |
0.28 |
Functional ≤ 10μM
|
Physical Representations
|
Type
pH range
|
xlogP
|
Des A‑Pol
Apolar desolvation
(kcal/mol)
|
Des Pol
Polar desolvation
(kcal/mol)
|
H Don
H-bond donors
|
H Acc
H-bond acceptors
|
Chg
Net charge
|
tPSA
(Ų)
|
MWT
Molecular weight
(g/mol)
|
RB
Rotatable bonds
|
DL |
|
Ref
Reference (pH 7)
|
3.02 |
7.57 |
-13.1 |
1 |
5 |
0 |
59 |
369.461 |
9 |
↓
|
|
|
|
Analogs
Draw
Identity
99%
90%
80%
70%
Vendors
And 4 More
Clustered Target Annotations
| Code |
Organism Class |
Affinity (nM) |
LE (kcal/mol/atom) |
Type |
|
MDR1-1-E |
P-glycoprotein 1 (cluster #1 Of 3), Eukaryotic |
Eukaryotes |
3645 |
0.28 |
Binding ≤ 10μM
|
|
Z80066-1-O |
CCRF-CEM/VCR-1000 (cluster #1 Of 1), Other |
Other |
3750 |
0.28 |
Functional ≤ 10μM
|
Physical Representations
|
Type
pH range
|
xlogP
|
Des A‑Pol
Apolar desolvation
(kcal/mol)
|
Des Pol
Polar desolvation
(kcal/mol)
|
H Don
H-bond donors
|
H Acc
H-bond acceptors
|
Chg
Net charge
|
tPSA
(Ų)
|
MWT
Molecular weight
(g/mol)
|
RB
Rotatable bonds
|
DL |
|
Ref
Reference (pH 7)
|
3.02 |
7.51 |
-12.97 |
1 |
5 |
0 |
59 |
369.461 |
9 |
↓
|
|