|
|
Analogs
-
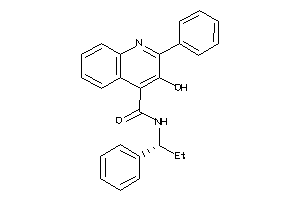
5932901
-
Draw
Identity
99%
90%
80%
70%
Vendors
Clustered Target Annotations
| Code |
Organism Class |
Affinity (nM) |
LE (kcal/mol/atom) |
Type |
|
NK2R-1-E |
Neurokinin 2 Receptor (cluster #1 Of 1), Eukaryotic |
Eukaryotes |
3700 |
0.26 |
Binding ≤ 10μM
|
|
NK3R-1-E |
Neurokinin 3 Receptor (cluster #1 Of 1), Eukaryotic |
Eukaryotes |
3 |
0.41 |
Binding ≤ 10μM
|
|
NK3R-1-E |
Neurokinin 3 Receptor (cluster #1 Of 1), Eukaryotic |
Eukaryotes |
5 |
0.40 |
Binding ≤ 10μM
|
|
OPRM-1-E |
Mu-type Opioid Receptor (cluster #1 Of 4), Eukaryotic |
Eukaryotes |
1860 |
0.28 |
Binding ≤ 10μM
|
|
NK3R-1-E |
Neurokinin 3 Receptor (cluster #1 Of 1), Eukaryotic |
Eukaryotes |
6 |
0.40 |
Functional ≤ 10μM
|
|
CP1A2-1-E |
Cytochrome P450 1A2 (cluster #1 Of 3), Eukaryotic |
Eukaryotes |
5000 |
0.26 |
ADME/T ≤ 10μM
|
|
CP2C9-1-E |
Cytochrome P450 2C9 (cluster #1 Of 3), Eukaryotic |
Eukaryotes |
2000 |
0.28 |
ADME/T ≤ 10μM
|
|
CP2CJ-1-E |
Cytochrome P450 2C19 (cluster #1 Of 3), Eukaryotic |
Eukaryotes |
9000 |
0.24 |
ADME/T ≤ 10μM
|
|
CP3A4-2-E |
Cytochrome P450 3A4 (cluster #2 Of 4), Eukaryotic |
Eukaryotes |
4000 |
0.26 |
ADME/T ≤ 10μM
|
|
Z50593-1-O |
Gerbillinae (cluster #1 Of 1), Other |
Other |
20 |
0.37 |
Functional ≤ 10μM
|
Physical Representations
|
Type
pH range
|
xlogP
|
Des A‑Pol
Apolar desolvation
(kcal/mol)
|
Des Pol
Polar desolvation
(kcal/mol)
|
H Don
H-bond donors
|
H Acc
H-bond acceptors
|
Chg
Net charge
|
tPSA
(Ų)
|
MWT
Molecular weight
(g/mol)
|
RB
Rotatable bonds
|
DL |
|
Ref
Reference (pH 7)
|
4.53 |
-2.05 |
-11.14 |
2 |
4 |
0 |
62 |
382.463 |
5 |
↓
|
|
|
|
Analogs
Draw
Identity
99%
90%
80%
70%
Vendors
Clustered Target Annotations
| Code |
Organism Class |
Affinity (nM) |
LE (kcal/mol/atom) |
Type |
|
CP2CJ-1-E |
Cytochrome P450 2C19 (cluster #1 Of 3), Eukaryotic |
Eukaryotes |
1800 |
0.38 |
ADME/T ≤ 10μM
|
|
CP2D6-1-E |
Cytochrome P450 2D6 (cluster #1 Of 3), Eukaryotic |
Eukaryotes |
100 |
0.47 |
ADME/T ≤ 10μM
|
|
CP3A4-2-E |
Cytochrome P450 3A4 (cluster #2 Of 4), Eukaryotic |
Eukaryotes |
9600 |
0.33 |
ADME/T ≤ 10μM
|
Physical Representations
|
Type
pH range
|
xlogP
|
Des A‑Pol
Apolar desolvation
(kcal/mol)
|
Des Pol
Polar desolvation
(kcal/mol)
|
H Don
H-bond donors
|
H Acc
H-bond acceptors
|
Chg
Net charge
|
tPSA
(Ų)
|
MWT
Molecular weight
(g/mol)
|
RB
Rotatable bonds
|
DL |
|
Ref
Reference (pH 7)
|
3.84 |
9.12 |
-28.34 |
3 |
3 |
1 |
42 |
280.395 |
3 |
↓
|
|
Hi
High (pH 8-9.5)
|
3.84 |
8.76 |
-6.72 |
2 |
3 |
0 |
41 |
279.387 |
3 |
↓
|
|
|
|
|
|
|
Analogs
Draw
Identity
99%
90%
80%
70%
Vendors
And 21 More
Physical Representations
|
Type
pH range
|
xlogP
|
Des A‑Pol
Apolar desolvation
(kcal/mol)
|
Des Pol
Polar desolvation
(kcal/mol)
|
H Don
H-bond donors
|
H Acc
H-bond acceptors
|
Chg
Net charge
|
tPSA
(Ų)
|
MWT
Molecular weight
(g/mol)
|
RB
Rotatable bonds
|
DL |
|
Ref
Reference (pH 7)
|
1.25 |
8.94 |
-44.5 |
2 |
5 |
1 |
55 |
295.366 |
2 |
↓
|
|
Ref
Reference (pH 7)
|
1.25 |
8.94 |
-43.84 |
2 |
5 |
1 |
55 |
295.366 |
2 |
↓
|
|
Mid
Mid (pH 6-8)
|
1.25 |
8.47 |
-18.57 |
1 |
5 |
0 |
54 |
294.358 |
2 |
↓
|
|
|
|
Analogs
Draw
Identity
99%
90%
80%
70%
Vendors
Physical Representations
|
Type
pH range
|
xlogP
|
Des A‑Pol
Apolar desolvation
(kcal/mol)
|
Des Pol
Polar desolvation
(kcal/mol)
|
H Don
H-bond donors
|
H Acc
H-bond acceptors
|
Chg
Net charge
|
tPSA
(Ų)
|
MWT
Molecular weight
(g/mol)
|
RB
Rotatable bonds
|
DL |
|
Ref
Reference (pH 7)
|
2.91 |
11.58 |
-40.63 |
1 |
4 |
1 |
31 |
288.415 |
9 |
↓
|
|
|
|
|
|
|
Analogs
Draw
Identity
99%
90%
80%
70%
Vendors
Physical Representations
|
Type
pH range
|
xlogP
|
Des A‑Pol
Apolar desolvation
(kcal/mol)
|
Des Pol
Polar desolvation
(kcal/mol)
|
H Don
H-bond donors
|
H Acc
H-bond acceptors
|
Chg
Net charge
|
tPSA
(Ų)
|
MWT
Molecular weight
(g/mol)
|
RB
Rotatable bonds
|
DL |
|
Ref
Reference (pH 7)
|
1.08 |
-2.03 |
-62.97 |
3 |
5 |
1 |
66 |
304.395 |
2 |
↓
|
|
|
|
Analogs
Draw
Identity
99%
90%
80%
70%
Vendors
Physical Representations
|
Type
pH range
|
xlogP
|
Des A‑Pol
Apolar desolvation
(kcal/mol)
|
Des Pol
Polar desolvation
(kcal/mol)
|
H Don
H-bond donors
|
H Acc
H-bond acceptors
|
Chg
Net charge
|
tPSA
(Ų)
|
MWT
Molecular weight
(g/mol)
|
RB
Rotatable bonds
|
DL |
|
Ref
Reference (pH 7)
|
4.03 |
-1.62 |
-54.43 |
4 |
11 |
1 |
124 |
531.572 |
8 |
↓
|
|
|
|
Analogs
Draw
Identity
99%
90%
80%
70%
Vendors
Clustered Target Annotations
| Code |
Organism Class |
Affinity (nM) |
LE (kcal/mol/atom) |
Type |
|
CP2CJ-1-E |
Cytochrome P450 2C19 (cluster #1 Of 3), Eukaryotic |
Eukaryotes |
770 |
0.28 |
ADME/T ≤ 10μM |
Physical Representations
|
Type
pH range
|
xlogP
|
Des A‑Pol
Apolar desolvation
(kcal/mol)
|
Des Pol
Polar desolvation
(kcal/mol)
|
H Don
H-bond donors
|
H Acc
H-bond acceptors
|
Chg
Net charge
|
tPSA
(Ų)
|
MWT
Molecular weight
(g/mol)
|
RB
Rotatable bonds
|
DL |
|
Ref
Reference (pH 7)
|
2.54 |
12.36 |
-55.23 |
2 |
7 |
-1 |
106 |
413.457 |
7 |
↓
|
|
Lo
Low (pH 4.5-6)
|
2.54 |
12.87 |
-77.28 |
3 |
7 |
0 |
107 |
414.465 |
7 |
↓
|
|
|
|
Analogs
Draw
Identity
99%
90%
80%
70%
Vendors
And 2 More
Physical Representations
|
Type
pH range
|
xlogP
|
Des A‑Pol
Apolar desolvation
(kcal/mol)
|
Des Pol
Polar desolvation
(kcal/mol)
|
H Don
H-bond donors
|
H Acc
H-bond acceptors
|
Chg
Net charge
|
tPSA
(Ų)
|
MWT
Molecular weight
(g/mol)
|
RB
Rotatable bonds
|
DL |
|
Ref
Reference (pH 7)
|
4.01 |
10.12 |
-9.25 |
0 |
6 |
0 |
51 |
410.905 |
4 |
↓
|
|
|
|
Analogs
Draw
Identity
99%
90%
80%
70%
Vendors
And 2 More
Clustered Target Annotations
| Code |
Organism Class |
Affinity (nM) |
LE (kcal/mol/atom) |
Type |
|
HDA10-1-E |
Histone Deacetylase 10 (cluster #1 Of 3), Eukaryotic |
Eukaryotes |
23 |
0.41 |
Binding ≤ 10μM |
|
HDA11-1-E |
Histone Deacetylase 11 (cluster #1 Of 3), Eukaryotic |
Eukaryotes |
24 |
0.41 |
Binding ≤ 10μM |
|
HDAC1-2-E |
Histone Deacetylase 1 (cluster #2 Of 4), Eukaryotic |
Eukaryotes |
77 |
0.38 |
Binding ≤ 10μM |
|
HDAC2-1-E |
Histone Deacetylase 2 (cluster #1 Of 4), Eukaryotic |
Eukaryotes |
27 |
0.41 |
Binding ≤ 10μM |
|
HDAC3-1-E |
Histone Deacetylase 3 (cluster #1 Of 3), Eukaryotic |
Eukaryotes |
19 |
0.42 |
Binding ≤ 10μM |
|
HDAC4-1-E |
Histone Deacetylase 4 (cluster #1 Of 3), Eukaryotic |
Eukaryotes |
16 |
0.42 |
Binding ≤ 10μM |
|
HDAC5-1-E |
Histone Deacetylase 5 (cluster #1 Of 3), Eukaryotic |
Eukaryotes |
21 |
0.41 |
Binding ≤ 10μM |
|
HDAC6-1-E |
Histone Deacetylase 6 (cluster #1 Of 3), Eukaryotic |
Eukaryotes |
247 |
0.36 |
Binding ≤ 10μM |
|
HDAC7-1-E |
Histone Deacetylase 7 (cluster #1 Of 3), Eukaryotic |
Eukaryotes |
104 |
0.38 |
Binding ≤ 10μM |
|
HDAC8-1-E |
Histone Deacetylase 8 (cluster #1 Of 4), Eukaryotic |
Eukaryotes |
48 |
0.39 |
Binding ≤ 10μM |
|
HDAC9-1-E |
Histone Deacetylase 9 (cluster #1 Of 3), Eukaryotic |
Eukaryotes |
24 |
0.41 |
Binding ≤ 10μM |
|
CP2CJ-1-E |
Cytochrome P450 2C19 (cluster #1 Of 3), Eukaryotic |
Eukaryotes |
5780 |
0.28 |
ADME/T ≤ 10μM |
|
CP3A4-2-E |
Cytochrome P450 3A4 (cluster #2 Of 4), Eukaryotic |
Eukaryotes |
2730 |
0.30 |
ADME/T ≤ 10μM |
|
Z100405-1-O |
MV4-11 (Myeloid Leukemia Cells) (cluster #1 Of 1), Other |
Other |
100 |
0.38 |
Functional ≤ 10μM |
|
Z80390-1-O |
PC-3 (Prostate Carcinoma Cells) (cluster #1 Of 10), Other |
Other |
340 |
0.35 |
Functional ≤ 10μM |
|
Z80415-1-O |
Ramos (Burkitts Lymhoma B-cells) (cluster #1 Of 1), Other |
Other |
140 |
0.37 |
Functional ≤ 10μM |
|
Z80928-3-O |
HCT-116 (Colon Carcinoma Cells) (cluster #3 Of 9), Other |
Other |
480 |
0.34 |
Functional ≤ 10μM |
|
Z81034-6-O |
A2780 (Ovarian Carcinoma Cells) (cluster #6 Of 10), Other |
Other |
480 |
0.34 |
Functional ≤ 10μM |
Physical Representations
|
Type
pH range
|
xlogP
|
Des A‑Pol
Apolar desolvation
(kcal/mol)
|
Des Pol
Polar desolvation
(kcal/mol)
|
H Don
H-bond donors
|
H Acc
H-bond acceptors
|
Chg
Net charge
|
tPSA
(Ų)
|
MWT
Molecular weight
(g/mol)
|
RB
Rotatable bonds
|
DL |
|
Ref
Reference (pH 7)
|
3.49 |
9.6 |
-62.75 |
3 |
6 |
1 |
72 |
359.494 |
10 |
↓
|
|
Hi
High (pH 8-9.5)
|
3.49 |
7.49 |
-18.21 |
2 |
6 |
0 |
70 |
358.486 |
10 |
↓
|
|
Lo
Low (pH 4.5-6)
|
3.49 |
9.9 |
-112.62 |
4 |
6 |
2 |
73 |
360.502 |
10 |
↓
|
|
|
|
Analogs
Draw
Identity
99%
90%
80%
70%
Vendors
And 11 More
Clustered Target Annotations
| Code |
Organism Class |
Affinity (nM) |
LE (kcal/mol/atom) |
Type |
|
IKKB-1-E |
Inhibitor Of Nuclear Factor Kappa B Kinase Beta Subunit (cluster #1 Of 1), Eukaryotic |
Eukaryotes |
5000 |
0.46 |
Binding ≤ 10μM |
|
CP2C9-1-E |
Cytochrome P450 2C9 (cluster #1 Of 3), Eukaryotic |
Eukaryotes |
7000 |
0.45 |
ADME/T ≤ 10μM
|
|
CP2CJ-1-E |
Cytochrome P450 2C19 (cluster #1 Of 3), Eukaryotic |
Eukaryotes |
4000 |
0.47 |
ADME/T ≤ 10μM
|
|
CP3A4-2-E |
Cytochrome P450 3A4 (cluster #2 Of 4), Eukaryotic |
Eukaryotes |
2000 |
0.50 |
ADME/T ≤ 10μM
|
Physical Representations
|
Type
pH range
|
xlogP
|
Des A‑Pol
Apolar desolvation
(kcal/mol)
|
Des Pol
Polar desolvation
(kcal/mol)
|
H Don
H-bond donors
|
H Acc
H-bond acceptors
|
Chg
Net charge
|
tPSA
(Ų)
|
MWT
Molecular weight
(g/mol)
|
RB
Rotatable bonds
|
DL |
|
Ref
Reference (pH 7)
|
2.15 |
-3.32 |
-7.82 |
4 |
3 |
0 |
69 |
236.271 |
2 |
↓
|
|
|
|
Analogs
Draw
Identity
99%
90%
80%
70%
Vendors
Clustered Target Annotations
| Code |
Organism Class |
Affinity (nM) |
LE (kcal/mol/atom) |
Type |
|
KCNH2-1-E |
HERG (cluster #1 Of 5), Eukaryotic |
Eukaryotes |
1170 |
0.25 |
Binding ≤ 10μM
|
|
MCHR1-1-E |
Melanin-concentrating Hormone Receptor 1 (cluster #1 Of 2), Eukaryotic |
Eukaryotes |
3 |
0.36 |
Binding ≤ 10μM
|
|
MCHR1-1-E |
Melanin-concentrating Hormone Receptor 1 (cluster #1 Of 1), Eukaryotic |
Eukaryotes |
89 |
0.30 |
Functional ≤ 10μM
|
|
CP2CJ-1-E |
Cytochrome P450 2C19 (cluster #1 Of 3), Eukaryotic |
Eukaryotes |
9300 |
0.21 |
ADME/T ≤ 10μM
|
|
CP3A4-2-E |
Cytochrome P450 3A4 (cluster #2 Of 4), Eukaryotic |
Eukaryotes |
1600 |
0.25 |
ADME/T ≤ 10μM
|
Physical Representations
|
Type
pH range
|
xlogP
|
Des A‑Pol
Apolar desolvation
(kcal/mol)
|
Des Pol
Polar desolvation
(kcal/mol)
|
H Don
H-bond donors
|
H Acc
H-bond acceptors
|
Chg
Net charge
|
tPSA
(Ų)
|
MWT
Molecular weight
(g/mol)
|
RB
Rotatable bonds
|
DL |
|
Ref
Reference (pH 7)
|
4.97 |
0.74 |
-44.48 |
1 |
6 |
1 |
57 |
483.013 |
7 |
↓
|
|
|
|
|
|
|
Analogs
-
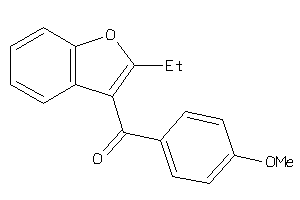
5688527
-
Draw
Identity
99%
90%
80%
70%
Vendors
Clustered Target Annotations
| Code |
Organism Class |
Affinity (nM) |
LE (kcal/mol/atom) |
Type |
|
CP2CJ-1-E |
Cytochrome P450 2C19 (cluster #1 Of 3), Eukaryotic |
Eukaryotes |
4500 |
0.37 |
ADME/T ≤ 10μM
|
Physical Representations
|
Type
pH range
|
xlogP
|
Des A‑Pol
Apolar desolvation
(kcal/mol)
|
Des Pol
Polar desolvation
(kcal/mol)
|
H Don
H-bond donors
|
H Acc
H-bond acceptors
|
Chg
Net charge
|
tPSA
(Ų)
|
MWT
Molecular weight
(g/mol)
|
RB
Rotatable bonds
|
DL |
|
Ref
Reference (pH 7)
|
3.92 |
8.44 |
-9.16 |
0 |
3 |
0 |
39 |
266.296 |
3 |
↓
|
|
|
|
|
|
|
Analogs
Draw
Identity
99%
90%
80%
70%
Vendors
And 4 More
Clustered Target Annotations
| Code |
Organism Class |
Affinity (nM) |
LE (kcal/mol/atom) |
Type |
|
CP2A6-4-E |
Cytochrome P450 2A6 (cluster #4 Of 5), Eukaryotic |
Eukaryotes |
80 |
0.76 |
ADME/T ≤ 10μM
|
|
CP2C9-3-E |
Cytochrome P450 2C9 (cluster #3 Of 3), Eukaryotic |
Eukaryotes |
8900 |
0.54 |
ADME/T ≤ 10μM
|
|
CP2CJ-1-E |
Cytochrome P450 2C19 (cluster #1 Of 3), Eukaryotic |
Eukaryotes |
2000 |
0.61 |
ADME/T ≤ 10μM
|
Physical Representations
|
Type
pH range
|
xlogP
|
Des A‑Pol
Apolar desolvation
(kcal/mol)
|
Des Pol
Polar desolvation
(kcal/mol)
|
H Don
H-bond donors
|
H Acc
H-bond acceptors
|
Chg
Net charge
|
tPSA
(Ų)
|
MWT
Molecular weight
(g/mol)
|
RB
Rotatable bonds
|
DL |
|
Ref
Reference (pH 7)
|
1.87 |
3.65 |
-48.44 |
3 |
2 |
1 |
41 |
191.279 |
2 |
↓
|
|
Lo
Low (pH 4.5-6)
|
1.87 |
3.92 |
-87.82 |
4 |
2 |
2 |
42 |
192.287 |
2 |
↓
|
|
|
|
Analogs
-
5688527
-

Draw
Identity
99%
90%
80%
70%
Vendors
Clustered Target Annotations
| Code |
Organism Class |
Affinity (nM) |
LE (kcal/mol/atom) |
Type |
|
CP2CJ-1-E |
Cytochrome P450 2C19 (cluster #1 Of 3), Eukaryotic |
Eukaryotes |
2500 |
0.41 |
ADME/T ≤ 10μM
|
Physical Representations
|
Type
pH range
|
xlogP
|
Des A‑Pol
Apolar desolvation
(kcal/mol)
|
Des Pol
Polar desolvation
(kcal/mol)
|
H Don
H-bond donors
|
H Acc
H-bond acceptors
|
Chg
Net charge
|
tPSA
(Ų)
|
MWT
Molecular weight
(g/mol)
|
RB
Rotatable bonds
|
DL |
|
Ref
Reference (pH 7)
|
3.39 |
6.29 |
-9.5 |
1 |
3 |
0 |
50 |
252.269 |
2 |
↓
|
|
|
|
Analogs
Draw
Identity
99%
90%
80%
70%
Vendors
Physical Representations
|
Type
pH range
|
xlogP
|
Des A‑Pol
Apolar desolvation
(kcal/mol)
|
Des Pol
Polar desolvation
(kcal/mol)
|
H Don
H-bond donors
|
H Acc
H-bond acceptors
|
Chg
Net charge
|
tPSA
(Ų)
|
MWT
Molecular weight
(g/mol)
|
RB
Rotatable bonds
|
DL |
|
Ref
Reference (pH 7)
|
3.40 |
8.83 |
-13.65 |
2 |
6 |
0 |
80 |
407.783 |
6 |
↓
|
|
Lo
Low (pH 4.5-6)
|
3.40 |
9.27 |
-51.17 |
3 |
6 |
1 |
81 |
408.791 |
6 |
↓
|
|
|
|
Analogs
Draw
Identity
99%
90%
80%
70%
Vendors
And 12 More
Clustered Target Annotations
| Code |
Organism Class |
Affinity (nM) |
LE (kcal/mol/atom) |
Type |
|
CP1A2-1-E |
Cytochrome P450 1A2 (cluster #1 Of 3), Eukaryotic |
Eukaryotes |
10000 |
0.28 |
ADME/T ≤ 10μM
|
|
CP2C9-1-E |
Cytochrome P450 2C9 (cluster #1 Of 3), Eukaryotic |
Eukaryotes |
10000 |
0.28 |
ADME/T ≤ 10μM
|
|
CP2CJ-1-E |
Cytochrome P450 2C19 (cluster #1 Of 3), Eukaryotic |
Eukaryotes |
10000 |
0.28 |
ADME/T ≤ 10μM
|
|
CP2D6-1-E |
Cytochrome P450 2D6 (cluster #1 Of 3), Eukaryotic |
Eukaryotes |
10000 |
0.28 |
ADME/T ≤ 10μM
|
|
CP3A4-2-E |
Cytochrome P450 3A4 (cluster #2 Of 4), Eukaryotic |
Eukaryotes |
10000 |
0.28 |
ADME/T ≤ 10μM
|
Physical Representations
|
Type
pH range
|
xlogP
|
Des A‑Pol
Apolar desolvation
(kcal/mol)
|
Des Pol
Polar desolvation
(kcal/mol)
|
H Don
H-bond donors
|
H Acc
H-bond acceptors
|
Chg
Net charge
|
tPSA
(Ų)
|
MWT
Molecular weight
(g/mol)
|
RB
Rotatable bonds
|
DL |
|
Ref
Reference (pH 7)
|
0.25 |
6.96 |
-72.97 |
3 |
7 |
1 |
99 |
340.407 |
3 |
↓
|
|
Hi
High (pH 8-9.5)
|
8.62 |
18.14 |
-52.22 |
0 |
0 |
-1 |
0 |
421.61 |
5 |
↓
|
|
|
|
Analogs
Draw
Identity
99%
90%
80%
70%
Vendors
And 23 More
Clustered Target Annotations
| Code |
Organism Class |
Affinity (nM) |
LE (kcal/mol/atom) |
Type |
|
AK1C1-1-E |
Aldo-keto Reductase Family 1 Member C1 (cluster #1 Of 1), Eukaryotic |
Eukaryotes |
48 |
0.47 |
Binding ≤ 10μM
|
|
MRP1-1-E |
Multidrug Resistance-associated Protein 1 (cluster #1 Of 1), Eukaryotic |
Eukaryotes |
4000 |
0.34 |
Binding ≤ 10μM |
|
S22AC-1-E |
Solute Carrier Family 22 Member 12 (cluster #1 Of 1), Eukaryotic |
Eukaryotes |
35 |
0.47 |
Binding ≤ 10μM
|
|
CP2C9-1-E |
Cytochrome P450 2C9 (cluster #1 Of 3), Eukaryotic |
Eukaryotes |
19 |
0.49 |
ADME/T ≤ 10μM
|
|
CP2CJ-1-E |
Cytochrome P450 2C19 (cluster #1 Of 3), Eukaryotic |
Eukaryotes |
3700 |
0.35 |
ADME/T ≤ 10μM
|
Physical Representations
|
Type
pH range
|
xlogP
|
Des A‑Pol
Apolar desolvation
(kcal/mol)
|
Des Pol
Polar desolvation
(kcal/mol)
|
H Don
H-bond donors
|
H Acc
H-bond acceptors
|
Chg
Net charge
|
tPSA
(Ų)
|
MWT
Molecular weight
(g/mol)
|
RB
Rotatable bonds
|
DL |
|
Ref
Reference (pH 7)
|
5.70 |
9.21 |
-37.09 |
0 |
3 |
-1 |
53 |
423.08 |
3 |
↓
|
|
Mid
Mid (pH 6-8)
|
5.70 |
8.44 |
-7.37 |
1 |
3 |
0 |
50 |
424.088 |
3 |
↓
|
|
|
|
Analogs
Draw
Identity
99%
90%
80%
70%
Vendors
Clustered Target Annotations
| Code |
Organism Class |
Affinity (nM) |
LE (kcal/mol/atom) |
Type |
|
CP2CJ-1-E |
Cytochrome P450 2C19 (cluster #1 Of 3), Eukaryotic |
Eukaryotes |
7200 |
0.34 |
ADME/T ≤ 10μM
|
Physical Representations
|
Type
pH range
|
xlogP
|
Des A‑Pol
Apolar desolvation
(kcal/mol)
|
Des Pol
Polar desolvation
(kcal/mol)
|
H Don
H-bond donors
|
H Acc
H-bond acceptors
|
Chg
Net charge
|
tPSA
(Ų)
|
MWT
Molecular weight
(g/mol)
|
RB
Rotatable bonds
|
DL |
|
Ref
Reference (pH 7)
|
5.67 |
8.59 |
-7.19 |
1 |
3 |
0 |
50 |
504.061 |
2 |
↓
|
|
|
|
Analogs
Draw
Identity
99%
90%
80%
70%
Vendors
Clustered Target Annotations
| Code |
Organism Class |
Affinity (nM) |
LE (kcal/mol/atom) |
Type |
|
EGFR-1-E |
Epidermal Growth Factor Receptor ErbB1 (cluster #1 Of 4), Eukaryotic |
Eukaryotes |
1600 |
0.24 |
Binding ≤ 10μM
|
|
FAK1-1-E |
Focal Adhesion Kinase 1 (cluster #1 Of 1), Eukaryotic |
Eukaryotes |
150 |
0.28 |
Binding ≤ 10μM
|
|
IGF1R-1-E |
Insulin-like Growth Factor 1 Receptor (cluster #1 Of 2), Eukaryotic |
Eukaryotes |
110 |
0.29 |
Binding ≤ 10μM
|
|
INSR-1-E |
Insulin Receptor (cluster #1 Of 1), Eukaryotic |
Eukaryotes |
73 |
0.29 |
Binding ≤ 10μM
|
|
LCK-1-E |
Tyrosine-protein Kinase LCK (cluster #1 Of 4), Eukaryotic |
Eukaryotes |
341 |
0.27 |
Binding ≤ 10μM
|
|
MET-1-E |
Hepatocyte Growth Factor Receptor (cluster #1 Of 1), Eukaryotic |
Eukaryotes |
4870 |
0.22 |
Binding ≤ 10μM
|
|
MP2K1-1-E |
Dual Specificity Mitogen-activated Protein Kinase Kinase 1 (cluster #1 Of 4), Eukaryotic |
Eukaryotes |
182 |
0.28 |
Binding ≤ 10μM
|
|
VGFR2-1-E |
Vascular Endothelial Growth Factor Receptor 2 (cluster #1 Of 2), Eukaryotic |
Eukaryotes |
1400 |
0.24 |
Binding ≤ 10μM
|
|
CP2C9-1-E |
Cytochrome P450 2C9 (cluster #1 Of 3), Eukaryotic |
Eukaryotes |
1200 |
0.24 |
ADME/T ≤ 10μM
|
|
CP2CJ-1-E |
Cytochrome P450 2C19 (cluster #1 Of 3), Eukaryotic |
Eukaryotes |
2000 |
0.23 |
ADME/T ≤ 10μM
|
|
CP3A4-2-E |
Cytochrome P450 3A4 (cluster #2 Of 4), Eukaryotic |
Eukaryotes |
5300 |
0.22 |
ADME/T ≤ 10μM
|
|
Z80099-1-O |
COLO 205 (Colon Adenocarcinoma Cells) (cluster #1 Of 3), Other |
Other |
212 |
0.27 |
Functional ≤ 10μM
|
|
Z80224-1-O |
MCF7 (Breast Carcinoma Cells) (cluster #1 Of 14), Other |
Other |
460 |
0.26 |
Functional ≤ 10μM
|
|
Z80421-1-O |
RD (Rhabdomyosarcoma Cells) (cluster #1 Of 1), Other |
Other |
202 |
0.28 |
Functional ≤ 10μM
|
|
Z50594-1-O |
Mus Musculus (cluster #1 Of 1), Other |
Other |
51 |
0.30 |
ADME/T ≤ 10μM
|
Physical Representations
|
Type
pH range
|
xlogP
|
Des A‑Pol
Apolar desolvation
(kcal/mol)
|
Des Pol
Polar desolvation
(kcal/mol)
|
H Don
H-bond donors
|
H Acc
H-bond acceptors
|
Chg
Net charge
|
tPSA
(Ų)
|
MWT
Molecular weight
(g/mol)
|
RB
Rotatable bonds
|
DL |
|
Ref
Reference (pH 7)
|
3.48 |
6.3 |
-21.76 |
4 |
8 |
0 |
106 |
479.968 |
6 |
↓
|
|
Ref
Reference (pH 7)
|
3.48 |
6.31 |
-21.49 |
4 |
8 |
0 |
106 |
479.968 |
6 |
↓
|
|
Lo
Low (pH 4.5-6)
|
3.48 |
6.54 |
-33.46 |
5 |
8 |
1 |
108 |
480.976 |
5 |
↓
|
|
|
|
Analogs
Draw
Identity
99%
90%
80%
70%
Vendors
Clustered Target Annotations
| Code |
Organism Class |
Affinity (nM) |
LE (kcal/mol/atom) |
Type |
|
CP2C9-1-E |
Cytochrome P450 2C9 (cluster #1 Of 3), Eukaryotic |
Eukaryotes |
9700 |
0.22 |
ADME/T ≤ 10μM
|
|
CP2CJ-1-E |
Cytochrome P450 2C19 (cluster #1 Of 3), Eukaryotic |
Eukaryotes |
2100 |
0.25 |
ADME/T ≤ 10μM
|
|
CP3A4-2-E |
Cytochrome P450 3A4 (cluster #2 Of 4), Eukaryotic |
Eukaryotes |
510 |
0.28 |
ADME/T ≤ 10μM
|
Physical Representations
|
Type
pH range
|
xlogP
|
Des A‑Pol
Apolar desolvation
(kcal/mol)
|
Des Pol
Polar desolvation
(kcal/mol)
|
H Don
H-bond donors
|
H Acc
H-bond acceptors
|
Chg
Net charge
|
tPSA
(Ų)
|
MWT
Molecular weight
(g/mol)
|
RB
Rotatable bonds
|
DL |
|
Ref
Reference (pH 7)
|
2.78 |
7.84 |
-55.82 |
4 |
9 |
1 |
118 |
442.471 |
8 |
↓
|
|
Mid
Mid (pH 6-8)
|
2.78 |
7.5 |
-18.75 |
3 |
9 |
0 |
117 |
441.463 |
8 |
↓
|
|
|
|
Analogs
Draw
Identity
99%
90%
80%
70%
Vendors
Clustered Target Annotations
| Code |
Organism Class |
Affinity (nM) |
LE (kcal/mol/atom) |
Type |
|
CP2C9-1-E |
Cytochrome P450 2C9 (cluster #1 Of 3), Eukaryotic |
Eukaryotes |
7900 |
0.26 |
ADME/T ≤ 10μM
|
|
CP2CJ-1-E |
Cytochrome P450 2C19 (cluster #1 Of 3), Eukaryotic |
Eukaryotes |
10000 |
0.25 |
ADME/T ≤ 10μM
|
|
Z50607-1-O |
Human Immunodeficiency Virus 1 (cluster #1 Of 10), Other |
Other |
30 |
0.38 |
Functional ≤ 10μM
|
Physical Representations
|
Type
pH range
|
xlogP
|
Des A‑Pol
Apolar desolvation
(kcal/mol)
|
Des Pol
Polar desolvation
(kcal/mol)
|
H Don
H-bond donors
|
H Acc
H-bond acceptors
|
Chg
Net charge
|
tPSA
(Ų)
|
MWT
Molecular weight
(g/mol)
|
RB
Rotatable bonds
|
DL |
|
Ref
Reference (pH 7)
|
0.84 |
-1.6 |
-13.17 |
1 |
7 |
0 |
86 |
376.416 |
3 |
↓
|
|
Lo
Low (pH 4.5-6)
|
0.84 |
-1.5 |
-41.49 |
2 |
7 |
1 |
87 |
377.424 |
3 |
↓
|
|
|
|
Analogs
Draw
Identity
99%
90%
80%
70%
Notice: Undefined index: field_name in /domains/zinc12/htdocs/lib/zinc/reporter/ZincAuxiliaryInfoReports.php on line 244
Notice: Undefined index: synonym in /domains/zinc12/htdocs/lib/zinc/reporter/ZincAuxiliaryInfoReports.php on line 245
Vendors
And 7 More
Clustered Target Annotations
| Code |
Organism Class |
Affinity (nM) |
LE (kcal/mol/atom) |
Type |
|
HYES-2-E |
Epoxide Hydrolase 2 (cluster #2 Of 3), Eukaryotic |
Eukaryotes |
5 |
0.48 |
Binding ≤ 10μM
|
|
CP2CJ-1-E |
Cytochrome P450 2C19 (cluster #1 Of 3), Eukaryotic |
Eukaryotes |
9000 |
0.29 |
ADME/T ≤ 10μM
|
Physical Representations
|
Type
pH range
|
xlogP
|
Des A‑Pol
Apolar desolvation
(kcal/mol)
|
Des Pol
Polar desolvation
(kcal/mol)
|
H Don
H-bond donors
|
H Acc
H-bond acceptors
|
Chg
Net charge
|
tPSA
(Ų)
|
MWT
Molecular weight
(g/mol)
|
RB
Rotatable bonds
|
DL |
|
Ref
Reference (pH 7)
|
3.35 |
-0.23 |
-10.51 |
1 |
3 |
0 |
41 |
316.404 |
6 |
↓
|
|
|
|
Analogs
Draw
Identity
99%
90%
80%
70%
Vendors
Clustered Target Annotations
| Code |
Organism Class |
Affinity (nM) |
LE (kcal/mol/atom) |
Type |
|
DHB1-1-E |
Estradiol 17-beta-dehydrogenase 1 (cluster #1 Of 1), Eukaryotic |
Eukaryotes |
46 |
0.51 |
Binding ≤ 10μM
|
|
DHB2-1-E |
Estradiol 17-beta-dehydrogenase 2 (cluster #1 Of 2), Eukaryotic |
Eukaryotes |
1971 |
0.40 |
Binding ≤ 10μM
|
|
CP2CJ-1-E |
Cytochrome P450 2C19 (cluster #1 Of 3), Eukaryotic |
Eukaryotes |
940 |
0.42 |
ADME/T ≤ 10μM
|
|
CP2D6-2-E |
Cytochrome P450 2D6 (cluster #2 Of 3), Eukaryotic |
Eukaryotes |
1500 |
0.41 |
ADME/T ≤ 10μM
|
|
CP3A4-2-E |
Cytochrome P450 3A4 (cluster #2 Of 4), Eukaryotic |
Eukaryotes |
500 |
0.44 |
ADME/T ≤ 10μM
|
|
Z80712-2-O |
T47D (Breast Carcinoma Cells) (cluster #2 Of 7), Other |
Other |
426 |
0.45 |
Functional ≤ 10μM
|
Physical Representations
|
Type
pH range
|
xlogP
|
Des A‑Pol
Apolar desolvation
(kcal/mol)
|
Des Pol
Polar desolvation
(kcal/mol)
|
H Don
H-bond donors
|
H Acc
H-bond acceptors
|
Chg
Net charge
|
tPSA
(Ų)
|
MWT
Molecular weight
(g/mol)
|
RB
Rotatable bonds
|
DL |
|
Ref
Reference (pH 7)
|
5.30 |
5.98 |
-8 |
2 |
2 |
0 |
40 |
282.364 |
2 |
↓
|
|
|
|
Analogs
Draw
Identity
99%
90%
80%
70%
Vendors
Clustered Target Annotations
| Code |
Organism Class |
Affinity (nM) |
LE (kcal/mol/atom) |
Type |
|
CP1A2-1-E |
Cytochrome P450 1A2 (cluster #1 Of 3), Eukaryotic |
Eukaryotes |
10000 |
0.29 |
ADME/T ≤ 10μM
|
|
CP2C9-1-E |
Cytochrome P450 2C9 (cluster #1 Of 3), Eukaryotic |
Eukaryotes |
10000 |
0.29 |
ADME/T ≤ 10μM
|
|
CP2CJ-1-E |
Cytochrome P450 2C19 (cluster #1 Of 3), Eukaryotic |
Eukaryotes |
316 |
0.38 |
ADME/T ≤ 10μM
|
|
CP2D6-1-E |
Cytochrome P450 2D6 (cluster #1 Of 3), Eukaryotic |
Eukaryotes |
10000 |
0.29 |
ADME/T ≤ 10μM
|
|
CP3A4-2-E |
Cytochrome P450 3A4 (cluster #2 Of 4), Eukaryotic |
Eukaryotes |
1259 |
0.34 |
ADME/T ≤ 10μM
|
Physical Representations
|
Type
pH range
|
xlogP
|
Des A‑Pol
Apolar desolvation
(kcal/mol)
|
Des Pol
Polar desolvation
(kcal/mol)
|
H Don
H-bond donors
|
H Acc
H-bond acceptors
|
Chg
Net charge
|
tPSA
(Ų)
|
MWT
Molecular weight
(g/mol)
|
RB
Rotatable bonds
|
DL |
|
Ref
Reference (pH 7)
|
4.69 |
10.57 |
-11.45 |
0 |
4 |
0 |
46 |
361.228 |
3 |
↓
|
|
|
|
Analogs
Draw
Identity
99%
90%
80%
70%
Vendors
And 8 More
Physical Representations
|
Type
pH range
|
xlogP
|
Des A‑Pol
Apolar desolvation
(kcal/mol)
|
Des Pol
Polar desolvation
(kcal/mol)
|
H Don
H-bond donors
|
H Acc
H-bond acceptors
|
Chg
Net charge
|
tPSA
(Ų)
|
MWT
Molecular weight
(g/mol)
|
RB
Rotatable bonds
|
DL |
|
Ref
Reference (pH 7)
|
3.45 |
7.08 |
-8.18 |
3 |
5 |
0 |
92 |
368.849 |
1 |
↓
|
|
|
|
Analogs
Draw
Identity
99%
90%
80%
70%
Vendors
And 8 More
Physical Representations
|
Type
pH range
|
xlogP
|
Des A‑Pol
Apolar desolvation
(kcal/mol)
|
Des Pol
Polar desolvation
(kcal/mol)
|
H Don
H-bond donors
|
H Acc
H-bond acceptors
|
Chg
Net charge
|
tPSA
(Ų)
|
MWT
Molecular weight
(g/mol)
|
RB
Rotatable bonds
|
DL |
|
Ref
Reference (pH 7)
|
3.45 |
6.74 |
-8.48 |
3 |
5 |
0 |
92 |
368.849 |
1 |
↓
|
|
|
|
Analogs
Draw
Identity
99%
90%
80%
70%
Vendors
Physical Representations
|
Type
pH range
|
xlogP
|
Des A‑Pol
Apolar desolvation
(kcal/mol)
|
Des Pol
Polar desolvation
(kcal/mol)
|
H Don
H-bond donors
|
H Acc
H-bond acceptors
|
Chg
Net charge
|
tPSA
(Ų)
|
MWT
Molecular weight
(g/mol)
|
RB
Rotatable bonds
|
DL |
|
Ref
Reference (pH 7)
|
3.78 |
9.6 |
-63.44 |
2 |
4 |
1 |
56 |
330.791 |
5 |
↓
|
|
|
|
Analogs
-
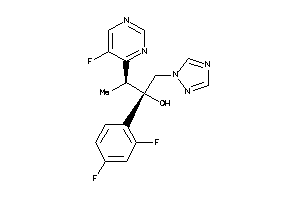
11592754
-
-
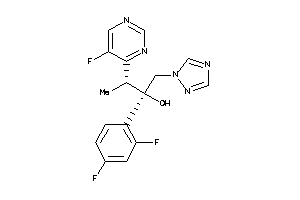
11592755
-
-
842
-
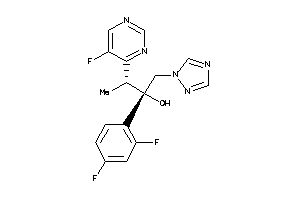
Draw
Identity
99%
90%
80%
70%
Vendors
And 30 More
Physical Representations
|
Type
pH range
|
xlogP
|
Des A‑Pol
Apolar desolvation
(kcal/mol)
|
Des Pol
Polar desolvation
(kcal/mol)
|
H Don
H-bond donors
|
H Acc
H-bond acceptors
|
Chg
Net charge
|
tPSA
(Ų)
|
MWT
Molecular weight
(g/mol)
|
RB
Rotatable bonds
|
DL |
|
Ref
Reference (pH 7)
|
1.49 |
8.74 |
-8.45 |
1 |
6 |
0 |
77 |
349.316 |
5 |
↓
|
|
|
|
Analogs
Draw
Identity
99%
90%
80%
70%
Vendors
And 56 More
Physical Representations
|
Type
pH range
|
xlogP
|
Des A‑Pol
Apolar desolvation
(kcal/mol)
|
Des Pol
Polar desolvation
(kcal/mol)
|
H Don
H-bond donors
|
H Acc
H-bond acceptors
|
Chg
Net charge
|
tPSA
(Ų)
|
MWT
Molecular weight
(g/mol)
|
RB
Rotatable bonds
|
DL |
|
Ref
Reference (pH 7)
|
-0.97 |
-0.4 |
-10.32 |
3 |
4 |
0 |
68 |
137.142 |
1 |
↓
|
|
|
|
Analogs
-
4677
-
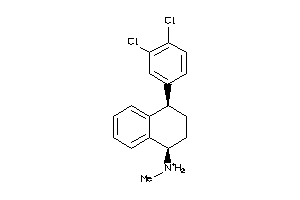
Draw
Identity
99%
90%
80%
70%
Vendors
And 56 More
Clustered Target Annotations
| Code |
Organism Class |
Affinity (nM) |
LE (kcal/mol/atom) |
Type |
|
Q9WTR4-1-E |
Norepinephrine Transporter (cluster #1 Of 2), Eukaryotic |
Eukaryotes |
220 |
0.47 |
Binding ≤ 10μM
|
|
SC6A2-1-E |
Norepinephrine Transporter (cluster #1 Of 2), Eukaryotic |
Eukaryotes |
825 |
0.43 |
Binding ≤ 10μM
|
|
SC6A3-1-E |
Dopamine Transporter (cluster #1 Of 3), Eukaryotic |
Eukaryotes |
310 |
0.46 |
Binding ≤ 10μM
|
|
SC6A4-3-E |
Serotonin Transporter (cluster #3 Of 4), Eukaryotic |
Eukaryotes |
3 |
0.60 |
Binding ≤ 10μM
|
|
Q9WTR4-1-E |
Norepinephrine Transporter (cluster #1 Of 2), Eukaryotic |
Eukaryotes |
300 |
0.46 |
Functional ≤ 10μM
|
|
SC6A3-1-E |
Dopamine Transporter (cluster #1 Of 1), Eukaryotic |
Eukaryotes |
320 |
0.45 |
Functional ≤ 10μM
|
|
SC6A4-1-E |
Serotonin Transporter (cluster #1 Of 1), Eukaryotic |
Eukaryotes |
60 |
0.51 |
Functional ≤ 10μM
|
|
CP2CJ-1-E |
Cytochrome P450 2C19 (cluster #1 Of 3), Eukaryotic |
Eukaryotes |
310 |
0.46 |
ADME/T ≤ 10μM
|
|
CP2D6-1-E |
Cytochrome P450 2D6 (cluster #1 Of 3), Eukaryotic |
Eukaryotes |
1400 |
0.41 |
ADME/T ≤ 10μM
|
|
CP3A4-2-E |
Cytochrome P450 3A4 (cluster #2 Of 4), Eukaryotic |
Eukaryotes |
800 |
0.43 |
ADME/T ≤ 10μM
|
|
Z50425-3-O |
Plasmodium Falciparum (cluster #3 Of 22), Other |
Other |
3981 |
0.38 |
Functional ≤ 10μM
|
|
Z50597-1-O |
Rattus Norvegicus (cluster #1 Of 12), Other |
Other |
60 |
0.51 |
Functional ≤ 10μM
|
Physical Representations
|
Type
pH range
|
xlogP
|
Des A‑Pol
Apolar desolvation
(kcal/mol)
|
Des Pol
Polar desolvation
(kcal/mol)
|
H Don
H-bond donors
|
H Acc
H-bond acceptors
|
Chg
Net charge
|
tPSA
(Ų)
|
MWT
Molecular weight
(g/mol)
|
RB
Rotatable bonds
|
DL |
|
Ref
Reference (pH 7)
|
3.98 |
10.12 |
-46.17 |
2 |
1 |
1 |
17 |
307.244 |
2 |
↓
|
|