|
|
Analogs
Draw
Identity
99%
90%
80%
70%
Vendors
And 35 More
Clustered Target Annotations
| Code |
Organism Class |
Affinity (nM) |
LE (kcal/mol/atom) |
Type |
|
ABL1-1-E |
Tyrosine-protein Kinase ABL (cluster #1 Of 1), Eukaryotic |
Eukaryotes |
590 |
0.26 |
Binding ≤ 10μM
|
|
ABL2-1-E |
Tyrosine-protein Kinase ABL2 (cluster #1 Of 1), Eukaryotic |
Eukaryotes |
0 |
0.00 |
Binding ≤ 10μM
|
|
ACK1-1-E |
Tyrosine Kinase Non-receptor Protein 2 (cluster #1 Of 1), Eukaryotic |
Eukaryotes |
6 |
0.35 |
Binding ≤ 10μM
|
|
ACV1B-1-E |
Activin Receptor Type-1B (cluster #1 Of 1), Eukaryotic |
Eukaryotes |
330 |
0.27 |
Binding ≤ 10μM
|
|
ACVL1-1-E |
Serine/threonine-protein Kinase Receptor R3 (cluster #1 Of 1), Eukaryotic |
Eukaryotes |
460 |
0.27 |
Binding ≤ 10μM
|
|
ACVR1-1-E |
Activin Receptor Type-1 (cluster #1 Of 1), Eukaryotic |
Eukaryotes |
620 |
0.26 |
Binding ≤ 10μM
|
|
ADCK3-1-E |
Chaperone Activity Of Bc1 Complex-like, Mitochondrial (cluster #1 Of 1), Eukaryotic |
Eukaryotes |
190 |
0.29 |
Binding ≤ 10μM
|
|
AURKB-1-E |
Serine/threonine-protein Kinase Aurora-B (cluster #1 Of 2), Eukaryotic |
Eukaryotes |
6485 |
0.22 |
Binding ≤ 10μM |
|
AVR2A-1-E |
Activin Receptor Type-2A (cluster #1 Of 1), Eukaryotic |
Eukaryotes |
210 |
0.28 |
Binding ≤ 10μM
|
|
AVR2B-1-E |
Activin Receptor Type-2B (cluster #1 Of 1), Eukaryotic |
Eukaryotes |
570 |
0.26 |
Binding ≤ 10μM
|
|
BCR-1-E |
Breakpoint Cluster Region Protein (cluster #1 Of 1), Eukaryotic |
Eukaryotes |
1 |
0.38 |
Binding ≤ 10μM
|
|
BLK-1-E |
Tyrosine-protein Kinase BLK (cluster #1 Of 1), Eukaryotic |
Eukaryotes |
0 |
0.00 |
Binding ≤ 10μM
|
|
BMX-1-E |
Tyrosine-protein Kinase BMX (cluster #1 Of 1), Eukaryotic |
Eukaryotes |
1 |
0.38 |
Binding ≤ 10μM
|
|
BRAF-1-E |
Serine/threonine-protein Kinase B-raf (cluster #1 Of 1), Eukaryotic |
Eukaryotes |
570 |
0.26 |
Binding ≤ 10μM
|
|
BTK-1-E |
Tyrosine-protein Kinase BTK (cluster #1 Of 1), Eukaryotic |
Eukaryotes |
5 |
0.35 |
Binding ≤ 10μM
|
|
CSF1R-1-E |
Macrophage Colony-stimulating Factor 1 Receptor (cluster #1 Of 1), Eukaryotic |
Eukaryotes |
7 |
0.35 |
Binding ≤ 10μM
|
|
CSK-1-E |
Tyrosine-protein Kinase CSK (cluster #1 Of 1), Eukaryotic |
Eukaryotes |
1 |
0.38 |
Binding ≤ 10μM
|
|
DDR1-1-E |
Epithelial Discoidin Domain-containing Receptor 1 (cluster #1 Of 1), Eukaryotic |
Eukaryotes |
1 |
0.38 |
Binding ≤ 10μM
|
|
DDR2-1-E |
Discoidin Domain-containing Receptor 2 (cluster #1 Of 1), Eukaryotic |
Eukaryotes |
3 |
0.36 |
Binding ≤ 10μM
|
|
DMPK-1-E |
Myotonin-protein Kinase (cluster #1 Of 1), Eukaryotic |
Eukaryotes |
1300 |
0.25 |
Binding ≤ 10μM
|
|
E2AK4-1-E |
Eukaryotic Translation Initiation Factor 2-alpha Kinase 4 (cluster #1 Of 1), Eukaryotic |
Eukaryotes |
1600 |
0.25 |
Binding ≤ 10μM
|
|
EGFR-1-E |
Epidermal Growth Factor Receptor ErbB1 (cluster #1 Of 4), Eukaryotic |
Eukaryotes |
79 |
0.30 |
Binding ≤ 10μM
|
|
EPHA1-1-E |
Ephrin Type-A Receptor 1 (cluster #1 Of 1), Eukaryotic |
Eukaryotes |
4 |
0.36 |
Binding ≤ 10μM
|
|
EPHA2-1-E |
Ephrin Type-A Receptor 2 (cluster #1 Of 1), Eukaryotic |
Eukaryotes |
137 |
0.29 |
Binding ≤ 10μM
|
|
EPHA3-1-E |
Ephrin Type-A Receptor 3 (cluster #1 Of 2), Eukaryotic |
Eukaryotes |
0 |
0.00 |
Binding ≤ 10μM
|
|
EPHA4-1-E |
Ephrin Type-A Receptor 4 (cluster #1 Of 1), Eukaryotic |
Eukaryotes |
1 |
0.38 |
Binding ≤ 10μM
|
|
EPHA5-1-E |
Ephrin Type-A Receptor 5 (cluster #1 Of 1), Eukaryotic |
Eukaryotes |
0 |
0.00 |
Binding ≤ 10μM
|
|
EPHA8-1-E |
Ephrin Type-A Receptor 8 (cluster #1 Of 1), Eukaryotic |
Eukaryotes |
0 |
0.00 |
Binding ≤ 10μM
|
|
EPHB1-1-E |
Ephrin Type-B Receptor 1 (cluster #1 Of 1), Eukaryotic |
Eukaryotes |
0 |
0.00 |
Binding ≤ 10μM
|
|
EPHB2-1-E |
Ephrin Type-B Receptor 2 (cluster #1 Of 1), Eukaryotic |
Eukaryotes |
4 |
0.36 |
Binding ≤ 10μM
|
|
EPHB3-1-E |
Ephrin Type-B Receptor 3 (cluster #1 Of 1), Eukaryotic |
Eukaryotes |
7 |
0.35 |
Binding ≤ 10μM
|
|
EPHB4-1-E |
Ephrin Type-B Receptor 4 (cluster #1 Of 1), Eukaryotic |
Eukaryotes |
1 |
0.38 |
Binding ≤ 10μM
|
|
ERBB2-2-E |
Receptor Protein-tyrosine Kinase ErbB-2 (cluster #2 Of 3), Eukaryotic |
Eukaryotes |
710 |
0.26 |
Binding ≤ 10μM
|
|
FGFR1-1-E |
Fibroblast Growth Factor Receptor 1 (cluster #1 Of 1), Eukaryotic |
Eukaryotes |
880 |
0.26 |
Binding ≤ 10μM
|
|
FGFR2-1-E |
Fibroblast Growth Factor Receptor 2 (cluster #1 Of 1), Eukaryotic |
Eukaryotes |
1400 |
0.25 |
Binding ≤ 10μM
|
|
FGR-1-E |
Tyrosine-protein Kinase FGR (cluster #1 Of 2), Eukaryotic |
Eukaryotes |
1 |
0.38 |
Binding ≤ 10μM
|
|
FLT3-1-E |
Tyrosine-protein Kinase Receptor FLT3 (cluster #1 Of 1), Eukaryotic |
Eukaryotes |
8100 |
0.22 |
Binding ≤ 10μM
|
|
FRK-1-E |
Tyrosine-protein Kinase FRK (cluster #1 Of 1), Eukaryotic |
Eukaryotes |
0 |
0.00 |
Binding ≤ 10μM
|
|
FYN-1-E |
Tyrosine-protein Kinase FYN (cluster #1 Of 5), Eukaryotic |
Eukaryotes |
1 |
0.38 |
Binding ≤ 10μM
|
|
GAK-1-E |
Serine/threonine-protein Kinase GAK (cluster #1 Of 2), Eukaryotic |
Eukaryotes |
3 |
0.36 |
Binding ≤ 10μM
|
|
HCK-1-E |
Tyrosine-protein Kinase HCK (cluster #1 Of 1), Eukaryotic |
Eukaryotes |
1 |
0.38 |
Binding ≤ 10μM
|
|
JAK2-1-E |
Tyrosine-protein Kinase JAK2 (cluster #1 Of 1), Eukaryotic |
Eukaryotes |
1000 |
0.25 |
Binding ≤ 10μM
|
|
KC1A-1-E |
Casein Kinase I Alpha (cluster #1 Of 1), Eukaryotic |
Eukaryotes |
1 |
0.38 |
Binding ≤ 10μM
|
|
KC1E-1-E |
Casein Kinase I Epsilon (cluster #1 Of 2), Eukaryotic |
Eukaryotes |
1500 |
0.25 |
Binding ≤ 10μM
|
|
KIT-1-E |
Stem Cell Growth Factor Receptor (cluster #1 Of 1), Eukaryotic |
Eukaryotes |
93 |
0.30 |
Binding ≤ 10μM
|
|
KSYK-1-E |
Tyrosine-protein Kinase SYK (cluster #1 Of 2), Eukaryotic |
Eukaryotes |
2900 |
0.23 |
Binding ≤ 10μM
|
|
LCK-1-E |
Tyrosine-protein Kinase LCK (cluster #1 Of 4), Eukaryotic |
Eukaryotes |
0 |
0.00 |
Binding ≤ 10μM
|
|
LIMK1-1-E |
LIM Domain Kinase 1 (cluster #1 Of 1), Eukaryotic |
Eukaryotes |
570 |
0.26 |
Binding ≤ 10μM
|
|
LIMK2-1-E |
LIM Domain Kinase 2 (cluster #1 Of 1), Eukaryotic |
Eukaryotes |
86 |
0.30 |
Binding ≤ 10μM
|
|
LYN-1-E |
Tyrosine-protein Kinase Lyn (cluster #1 Of 1), Eukaryotic |
Eukaryotes |
1 |
0.38 |
Binding ≤ 10μM
|
|
M3K4-1-E |
Mitogen-activated Protein Kinase Kinase Kinase 4 (cluster #1 Of 1), Eukaryotic |
Eukaryotes |
310 |
0.28 |
Binding ≤ 10μM
|
|
M4K1-1-E |
Mitogen-activated Protein Kinase Kinase Kinase Kinase 1 (cluster #1 Of 1), Eukaryotic |
Eukaryotes |
980 |
0.25 |
Binding ≤ 10μM
|
|
M4K3-1-E |
Mitogen-activated Protein Kinase Kinase Kinase Kinase 3 (cluster #1 Of 1), Eukaryotic |
Eukaryotes |
640 |
0.26 |
Binding ≤ 10μM
|
|
M4K4-1-E |
Mitogen-activated Protein Kinase Kinase Kinase Kinase 4 (cluster #1 Of 2), Eukaryotic |
Eukaryotes |
3100 |
0.23 |
Binding ≤ 10μM
|
|
M4K5-1-E |
Mitogen-activated Protein Kinase Kinase Kinase Kinase 5 (cluster #1 Of 1), Eukaryotic |
Eukaryotes |
45 |
0.31 |
Binding ≤ 10μM
|
|
MK11-1-E |
MAP Kinase P38 Beta (cluster #1 Of 1), Eukaryotic |
Eukaryotes |
410 |
0.27 |
Binding ≤ 10μM
|
|
MK12-1-E |
MAP Kinase P38 Gamma (cluster #1 Of 2), Eukaryotic |
Eukaryotes |
100 |
0.30 |
Binding ≤ 10μM
|
|
MK13-1-E |
MAP Kinase P38 Delta (cluster #1 Of 1), Eukaryotic |
Eukaryotes |
100 |
0.30 |
Binding ≤ 10μM
|
|
MK14-1-E |
MAP Kinase P38 Alpha (cluster #1 Of 3), Eukaryotic |
Eukaryotes |
495 |
0.27 |
Binding ≤ 10μM
|
|
MLTK-1-E |
Mixed Lineage Kinase 7 (cluster #1 Of 1), Eukaryotic |
Eukaryotes |
45 |
0.31 |
Binding ≤ 10μM
|
|
MP2K1-1-E |
Dual Specificity Mitogen-activated Protein Kinase Kinase 1 (cluster #1 Of 4), Eukaryotic |
Eukaryotes |
1700 |
0.24 |
Binding ≤ 10μM
|
|
MP2K2-1-E |
Dual Specificity Mitogen-activated Protein Kinase Kinase 2 (cluster #1 Of 1), Eukaryotic |
Eukaryotes |
1700 |
0.24 |
Binding ≤ 10μM
|
|
MRCKA-1-E |
Serine/threonine-protein Kinase MRCK-A (cluster #1 Of 1), Eukaryotic |
Eukaryotes |
2000 |
0.24 |
Binding ≤ 10μM
|
|
MRCKB-1-E |
Serine/threonine-protein Kinase MRCK Beta (cluster #1 Of 1), Eukaryotic |
Eukaryotes |
2100 |
0.24 |
Binding ≤ 10μM
|
|
MRCKG-1-E |
Serine/threonine-protein Kinase MRCK Gamma (cluster #1 Of 1), Eukaryotic |
Eukaryotes |
1200 |
0.25 |
Binding ≤ 10μM
|
|
MST4-1-E |
Serine/threonine-protein Kinase MST4 (cluster #1 Of 1), Eukaryotic |
Eukaryotes |
1900 |
0.24 |
Binding ≤ 10μM
|
|
NLK-1-E |
Serine/threonine Protein Kinase NLK (cluster #1 Of 1), Eukaryotic |
Eukaryotes |
260 |
0.28 |
Binding ≤ 10μM
|
|
PGFRA-1-E |
Platelet-derived Growth Factor Receptor Alpha (cluster #1 Of 2), Eukaryotic |
Eukaryotes |
63 |
0.31 |
Binding ≤ 10μM
|
|
PGFRB-1-E |
Platelet-derived Growth Factor Receptor Beta (cluster #1 Of 1), Eukaryotic |
Eukaryotes |
28 |
0.32 |
Binding ≤ 10μM
|
|
PMYT1-1-E |
Tyrosine- And Threonine-specific Cdc2-inhibitory Kinase (cluster #1 Of 1), Eukaryotic |
Eukaryotes |
130 |
0.29 |
Binding ≤ 10μM
|
|
PTK6-1-E |
Tyrosine-protein Kinase BRK (cluster #1 Of 1), Eukaryotic |
Eukaryotes |
9 |
0.34 |
Binding ≤ 10μM |
|
RAF1-1-E |
Serine/threonine-protein Kinase RAF (cluster #1 Of 1), Eukaryotic |
Eukaryotes |
570 |
0.26 |
Binding ≤ 10μM
|
|
RET-1-E |
Tyrosine-protein Kinase Receptor RET (cluster #1 Of 1), Eukaryotic |
Eukaryotes |
730 |
0.26 |
Binding ≤ 10μM
|
|
RIPK2-1-E |
Serine/threonine-protein Kinase RIPK2 (cluster #1 Of 1), Eukaryotic |
Eukaryotes |
31 |
0.32 |
Binding ≤ 10μM
|
|
SIK1-1-E |
Serine/threonine-protein Kinase SIK1 (cluster #1 Of 1), Eukaryotic |
Eukaryotes |
4 |
0.36 |
Binding ≤ 10μM
|
|
SIK2-1-E |
Serine/threonine-protein Kinase SIK2 (cluster #1 Of 1), Eukaryotic |
Eukaryotes |
6 |
0.35 |
Binding ≤ 10μM
|
|
SLK-1-E |
Serine/threonine-protein Kinase 2 (cluster #1 Of 2), Eukaryotic |
Eukaryotes |
720 |
0.26 |
Binding ≤ 10μM
|
|
SRC-1-E |
Tyrosine-protein Kinase SRC (cluster #1 Of 3), Eukaryotic |
Eukaryotes |
14 |
0.33 |
Binding ≤ 10μM
|
|
SRMS-1-E |
Tyrosine-protein Kinase Srms (cluster #1 Of 1), Eukaryotic |
Eukaryotes |
13 |
0.33 |
Binding ≤ 10μM
|
|
STK10-1-E |
Serine/threonine-protein Kinase 10 (cluster #1 Of 1), Eukaryotic |
Eukaryotes |
1200 |
0.25 |
Binding ≤ 10μM
|
|
STK36-1-E |
Serine/threonine-protein Kinase 36 (cluster #1 Of 1), Eukaryotic |
Eukaryotes |
210 |
0.28 |
Binding ≤ 10μM
|
|
TBA1A-1-E |
Tubulin Alpha-3 Chain (cluster #1 Of 3), Eukaryotic |
Eukaryotes |
55 |
0.31 |
Binding ≤ 10μM
|
|
TEC-1-E |
Tyrosine-protein Kinase TEC (cluster #1 Of 1), Eukaryotic |
Eukaryotes |
297 |
0.28 |
Binding ≤ 10μM
|
|
TESK1-1-E |
Dual Specificity Testis-specific Protein Kinase 1 (cluster #1 Of 1), Eukaryotic |
Eukaryotes |
33 |
0.32 |
Binding ≤ 10μM
|
|
TGFR1-1-E |
TGF-beta Receptor Type I (cluster #1 Of 1), Eukaryotic |
Eukaryotes |
230 |
0.28 |
Binding ≤ 10μM
|
|
TGFR2-1-E |
TGF-beta Receptor Type II (cluster #1 Of 1), Eukaryotic |
Eukaryotes |
2900 |
0.23 |
Binding ≤ 10μM
|
|
TNI3K-1-E |
Serine/threonine-protein Kinase TNNI3K (cluster #1 Of 1), Eukaryotic |
Eukaryotes |
11 |
0.34 |
Binding ≤ 10μM
|
|
TNIK-1-E |
TRAF2- And NCK-interacting Kinase (cluster #1 Of 2), Eukaryotic |
Eukaryotes |
2000 |
0.24 |
Binding ≤ 10μM
|
|
TXK-1-E |
Tyrosine-protein Kinase TXK (cluster #1 Of 1), Eukaryotic |
Eukaryotes |
2 |
0.37 |
Binding ≤ 10μM
|
|
VGFR1-1-E |
Vascular Endothelial Growth Factor Receptor 1 (cluster #1 Of 1), Eukaryotic |
Eukaryotes |
5000 |
0.22 |
Binding ≤ 10μM
|
|
VGFR2-2-E |
Vascular Endothelial Growth Factor Receptor 2 (cluster #2 Of 2), Eukaryotic |
Eukaryotes |
2360 |
0.24 |
Binding ≤ 10μM
|
|
WEE1-1-E |
Serine/threonine-protein Kinase WEE1 (cluster #1 Of 1), Eukaryotic |
Eukaryotes |
7000 |
0.22 |
Binding ≤ 10μM
|
|
YES-1-E |
Tyrosine-protein Kinase YES (cluster #1 Of 1), Eukaryotic |
Eukaryotes |
1 |
0.38 |
Binding ≤ 10μM
|
|
Z80186-1-O |
K562 (Erythroleukemia Cells) (cluster #1 Of 11), Other |
Other |
1 |
0.38 |
Functional ≤ 10μM
|
|
Z80390-1-O |
PC-3 (Prostate Carcinoma Cells) (cluster #1 Of 10), Other |
Other |
9 |
0.34 |
Functional ≤ 10μM
|
|
Z81017-1-O |
WiDr (Colon Adenocarcinoma Cells) (cluster #1 Of 5), Other |
Other |
52 |
0.31 |
Functional ≤ 10μM
|
|
Z81252-3-O |
MDA-MB-231 (Breast Adenocarcinoma Cells) (cluster #3 Of 11), Other |
Other |
12 |
0.34 |
Functional ≤ 10μM
|
|
Z81338-1-O |
T-cells (cluster #1 Of 3), Other |
Other |
3 |
0.36 |
Functional ≤ 10μM
|
Physical Representations
|
Type
pH range
|
xlogP
|
Des A‑Pol
Apolar desolvation
(kcal/mol)
|
Des Pol
Polar desolvation
(kcal/mol)
|
H Don
H-bond donors
|
H Acc
H-bond acceptors
|
Chg
Net charge
|
tPSA
(Ų)
|
MWT
Molecular weight
(g/mol)
|
RB
Rotatable bonds
|
DL |
|
Ref
Reference (pH 7)
|
3.13 |
7.33 |
-37.83 |
4 |
9 |
1 |
108 |
489.025 |
7 |
↓
|
|
Mid
Mid (pH 6-8)
|
3.13 |
7.4 |
-39.94 |
4 |
9 |
1 |
108 |
489.025 |
7 |
↓
|
|
Mid
Mid (pH 6-8)
|
3.13 |
7.04 |
-18.14 |
3 |
9 |
0 |
107 |
488.017 |
7 |
↓
|
|
|
|
Analogs
Draw
Identity
99%
90%
80%
70%
Vendors
Clustered Target Annotations
| Code |
Organism Class |
Affinity (nM) |
LE (kcal/mol/atom) |
Type |
|
Z81338-1-O |
T-cells (cluster #1 Of 3), Other |
Other |
2600 |
0.37 |
Functional ≤ 10μM
|
Physical Representations
|
Type
pH range
|
xlogP
|
Des A‑Pol
Apolar desolvation
(kcal/mol)
|
Des Pol
Polar desolvation
(kcal/mol)
|
H Don
H-bond donors
|
H Acc
H-bond acceptors
|
Chg
Net charge
|
tPSA
(Ų)
|
MWT
Molecular weight
(g/mol)
|
RB
Rotatable bonds
|
DL |
|
Ref
Reference (pH 7)
|
3.05 |
7.72 |
-10.23 |
3 |
4 |
0 |
64 |
298.777 |
4 |
↓
|
|
|
|
Analogs
Draw
Identity
99%
90%
80%
70%
Vendors
Clustered Target Annotations
| Code |
Organism Class |
Affinity (nM) |
LE (kcal/mol/atom) |
Type |
|
Z81338-1-O |
T-cells (cluster #1 Of 3), Other |
Other |
3400 |
0.36 |
Functional ≤ 10μM
|
Physical Representations
|
Type
pH range
|
xlogP
|
Des A‑Pol
Apolar desolvation
(kcal/mol)
|
Des Pol
Polar desolvation
(kcal/mol)
|
H Don
H-bond donors
|
H Acc
H-bond acceptors
|
Chg
Net charge
|
tPSA
(Ų)
|
MWT
Molecular weight
(g/mol)
|
RB
Rotatable bonds
|
DL |
|
Ref
Reference (pH 7)
|
3.05 |
7.7 |
-11.49 |
3 |
4 |
0 |
64 |
298.777 |
4 |
↓
|
|
|
|
Analogs
Draw
Identity
99%
90%
80%
70%
Vendors
Clustered Target Annotations
| Code |
Organism Class |
Affinity (nM) |
LE (kcal/mol/atom) |
Type |
|
Z81338-1-O |
T-cells (cluster #1 Of 3), Other |
Other |
500 |
0.44 |
Functional ≤ 10μM
|
Physical Representations
|
Type
pH range
|
xlogP
|
Des A‑Pol
Apolar desolvation
(kcal/mol)
|
Des Pol
Polar desolvation
(kcal/mol)
|
H Don
H-bond donors
|
H Acc
H-bond acceptors
|
Chg
Net charge
|
tPSA
(Ų)
|
MWT
Molecular weight
(g/mol)
|
RB
Rotatable bonds
|
DL |
|
Ref
Reference (pH 7)
|
4.00 |
9.83 |
-10.04 |
1 |
3 |
0 |
38 |
283.762 |
4 |
↓
|
|
|
|
Analogs
Draw
Identity
99%
90%
80%
70%
Vendors
Clustered Target Annotations
| Code |
Organism Class |
Affinity (nM) |
LE (kcal/mol/atom) |
Type |
|
LCK-1-E |
Tyrosine-protein Kinase LCK (cluster #1 Of 4), Eukaryotic |
Eukaryotes |
2 |
0.29 |
Binding ≤ 10μM
|
|
MK14-1-E |
MAP Kinase P38 Alpha (cluster #1 Of 3), Eukaryotic |
Eukaryotes |
1300 |
0.20 |
Binding ≤ 10μM
|
|
SRC-1-E |
Tyrosine-protein Kinase SRC (cluster #1 Of 3), Eukaryotic |
Eukaryotes |
6 |
0.27 |
Binding ≤ 10μM
|
|
VGFR2-1-E |
Vascular Endothelial Growth Factor Receptor 2 (cluster #1 Of 2), Eukaryotic |
Eukaryotes |
640 |
0.21 |
Binding ≤ 10μM
|
|
Z81338-1-O |
T-cells (cluster #1 Of 3), Other |
Other |
1900 |
0.19 |
Functional ≤ 10μM
|
Physical Representations
|
Type
pH range
|
xlogP
|
Des A‑Pol
Apolar desolvation
(kcal/mol)
|
Des Pol
Polar desolvation
(kcal/mol)
|
H Don
H-bond donors
|
H Acc
H-bond acceptors
|
Chg
Net charge
|
tPSA
(Ų)
|
MWT
Molecular weight
(g/mol)
|
RB
Rotatable bonds
|
DL |
|
Ref
Reference (pH 7)
|
6.30 |
17.15 |
-53.16 |
2 |
10 |
1 |
93 |
569.686 |
9 |
↓
|
|
Mid
Mid (pH 6-8)
|
6.30 |
14.8 |
-17.85 |
1 |
10 |
0 |
92 |
568.678 |
9 |
↓
|
|
|
|
Analogs
Draw
Identity
99%
90%
80%
70%
Vendors
Physical Representations
|
Type
pH range
|
xlogP
|
Des A‑Pol
Apolar desolvation
(kcal/mol)
|
Des Pol
Polar desolvation
(kcal/mol)
|
H Don
H-bond donors
|
H Acc
H-bond acceptors
|
Chg
Net charge
|
tPSA
(Ų)
|
MWT
Molecular weight
(g/mol)
|
RB
Rotatable bonds
|
DL |
|
Ref
Reference (pH 7)
|
4.97 |
11.58 |
-55.4 |
0 |
8 |
-1 |
108 |
554.435 |
5 |
↓
|
|
|
|
Analogs
Draw
Identity
99%
90%
80%
70%
Vendors
Clustered Target Annotations
| Code |
Organism Class |
Affinity (nM) |
LE (kcal/mol/atom) |
Type |
|
BTK-1-E |
Tyrosine-protein Kinase BTK (cluster #1 Of 1), Eukaryotic |
Eukaryotes |
545 |
0.22 |
Binding ≤ 10μM
|
|
JAK3-1-E |
Tyrosine-protein Kinase JAK3 (cluster #1 Of 2), Eukaryotic |
Eukaryotes |
72 |
0.26 |
Binding ≤ 10μM
|
|
KSYK-1-E |
Tyrosine-protein Kinase SYK (cluster #1 Of 2), Eukaryotic |
Eukaryotes |
292 |
0.23 |
Binding ≤ 10μM
|
|
LCK-1-E |
Tyrosine-protein Kinase LCK (cluster #1 Of 4), Eukaryotic |
Eukaryotes |
0 |
0.00 |
Binding ≤ 10μM
|
|
MK08-1-E |
Mitogen-activated Protein Kinase 8 (cluster #1 Of 5), Eukaryotic |
Eukaryotes |
389 |
0.23 |
Binding ≤ 10μM
|
|
MK09-1-E |
C-Jun N-terminal Kinase 2 (cluster #1 Of 3), Eukaryotic |
Eukaryotes |
173 |
0.24 |
Binding ≤ 10μM
|
|
MK10-1-E |
C-Jun N-terminal Kinase 3 (cluster #1 Of 2), Eukaryotic |
Eukaryotes |
145 |
0.25 |
Binding ≤ 10μM
|
|
MK14-1-E |
MAP Kinase P38 Alpha (cluster #1 Of 3), Eukaryotic |
Eukaryotes |
3 |
0.31 |
Binding ≤ 10μM
|
|
SRC-1-E |
Tyrosine-protein Kinase SRC (cluster #1 Of 3), Eukaryotic |
Eukaryotes |
2 |
0.31 |
Binding ≤ 10μM
|
|
TYK2-1-E |
Tyrosine-protein Kinase TYK2 (cluster #1 Of 1), Eukaryotic |
Eukaryotes |
1830 |
0.21 |
Binding ≤ 10μM
|
|
VGFR2-1-E |
Vascular Endothelial Growth Factor Receptor 2 (cluster #1 Of 2), Eukaryotic |
Eukaryotes |
1 |
0.32 |
Binding ≤ 10μM
|
|
Z81338-1-O |
T-cells (cluster #1 Of 3), Other |
Other |
30 |
0.27 |
Functional ≤ 10μM
|
|
Z50594-1-O |
Mus Musculus (cluster #1 Of 1), Other |
Other |
630 |
0.22 |
ADME/T ≤ 10μM
|
Physical Representations
|
Type
pH range
|
xlogP
|
Des A‑Pol
Apolar desolvation
(kcal/mol)
|
Des Pol
Polar desolvation
(kcal/mol)
|
H Don
H-bond donors
|
H Acc
H-bond acceptors
|
Chg
Net charge
|
tPSA
(Ų)
|
MWT
Molecular weight
(g/mol)
|
RB
Rotatable bonds
|
DL |
|
Ref
Reference (pH 7)
|
5.92 |
11.56 |
-18.2 |
2 |
7 |
0 |
79 |
535.57 |
8 |
↓
|
|
Mid
Mid (pH 6-8)
|
5.92 |
13.83 |
-49.85 |
3 |
7 |
1 |
81 |
536.578 |
8 |
↓
|
|
|
|
Analogs
-
14096305
-
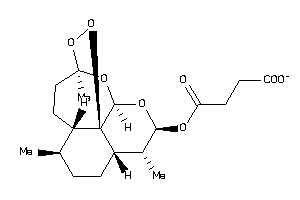
Draw
Identity
99%
90%
80%
70%
Vendors
Physical Representations
|
Type
pH range
|
xlogP
|
Des A‑Pol
Apolar desolvation
(kcal/mol)
|
Des Pol
Polar desolvation
(kcal/mol)
|
H Don
H-bond donors
|
H Acc
H-bond acceptors
|
Chg
Net charge
|
tPSA
(Ų)
|
MWT
Molecular weight
(g/mol)
|
RB
Rotatable bonds
|
DL |
|
Ref
Reference (pH 7)
|
2.75 |
-1.53 |
-50.29 |
0 |
8 |
-1 |
103 |
383.417 |
5 |
↓
|
|
|
|
Analogs
-
8214489
-
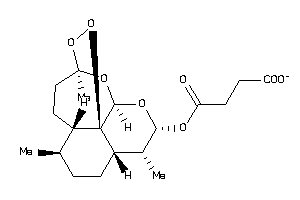
Draw
Identity
99%
90%
80%
70%
Vendors
And 4 More
Physical Representations
|
Type
pH range
|
xlogP
|
Des A‑Pol
Apolar desolvation
(kcal/mol)
|
Des Pol
Polar desolvation
(kcal/mol)
|
H Don
H-bond donors
|
H Acc
H-bond acceptors
|
Chg
Net charge
|
tPSA
(Ų)
|
MWT
Molecular weight
(g/mol)
|
RB
Rotatable bonds
|
DL |
|
Ref
Reference (pH 7)
|
2.75 |
7.73 |
-53.19 |
0 |
8 |
-1 |
103 |
383.417 |
5 |
↓
|
|
|
|
Analogs
Draw
Identity
99%
90%
80%
70%
Vendors
Physical Representations
|
Type
pH range
|
xlogP
|
Des A‑Pol
Apolar desolvation
(kcal/mol)
|
Des Pol
Polar desolvation
(kcal/mol)
|
H Don
H-bond donors
|
H Acc
H-bond acceptors
|
Chg
Net charge
|
tPSA
(Ų)
|
MWT
Molecular weight
(g/mol)
|
RB
Rotatable bonds
|
DL |
|
Ref
Reference (pH 7)
|
2.99 |
6.52 |
-12.45 |
2 |
4 |
0 |
62 |
287.322 |
2 |
↓
|
|
Lo
Low (pH 4.5-6)
|
2.99 |
6.81 |
-47.83 |
3 |
4 |
1 |
63 |
288.33 |
2 |
↓
|
|
|
|
Analogs
Draw
Identity
99%
90%
80%
70%
Vendors
Clustered Target Annotations
| Code |
Organism Class |
Affinity (nM) |
LE (kcal/mol/atom) |
Type |
|
Z81338-1-O |
T-cells (cluster #1 Of 3), Other |
Other |
1200 |
0.39 |
Functional ≤ 10μM
|
Physical Representations
|
Type
pH range
|
xlogP
|
Des A‑Pol
Apolar desolvation
(kcal/mol)
|
Des Pol
Polar desolvation
(kcal/mol)
|
H Don
H-bond donors
|
H Acc
H-bond acceptors
|
Chg
Net charge
|
tPSA
(Ų)
|
MWT
Molecular weight
(g/mol)
|
RB
Rotatable bonds
|
DL |
|
Ref
Reference (pH 7)
|
5.00 |
9.62 |
-13.2 |
1 |
3 |
0 |
38 |
318.207 |
4 |
↓
|
|
|
|
|
|
|
Analogs
-
3978012
-
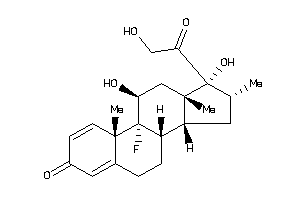
-
3978013
-
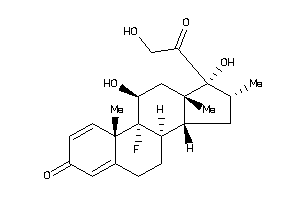
-
3978014
-
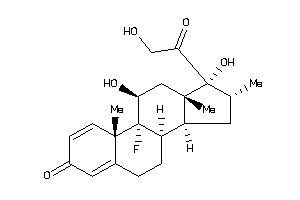
-
3978043
-
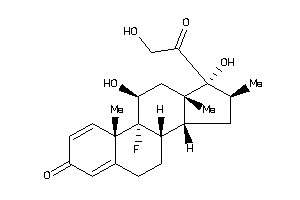
-
3978044
-
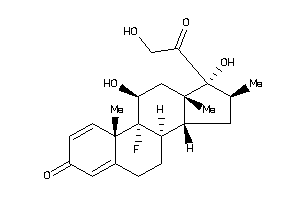
Draw
Identity
99%
90%
80%
70%
Vendors
And 34 More
Clustered Target Annotations
| Code |
Organism Class |
Affinity (nM) |
LE (kcal/mol/atom) |
Type |
|
ANDR-2-E |
Androgen Receptor (cluster #2 Of 4), Eukaryotic |
Eukaryotes |
1000 |
0.30 |
Binding ≤ 10μM
|
|
GCR-2-E |
Glucocorticoid Receptor (cluster #2 Of 2), Eukaryotic |
Eukaryotes |
22 |
0.38 |
Binding ≤ 10μM
|
|
MCR-1-E |
Mineralocorticoid Receptor (cluster #1 Of 2), Eukaryotic |
Eukaryotes |
7 |
0.41 |
Binding ≤ 10μM
|
|
PRGR-1-E |
Progesterone Receptor (cluster #1 Of 3), Eukaryotic |
Eukaryotes |
1000 |
0.30 |
Binding ≤ 10μM
|
|
GCR-2-E |
Glucocorticoid Receptor (cluster #2 Of 2), Eukaryotic |
Eukaryotes |
4 |
0.42 |
Functional ≤ 10μM
|
|
Z50594-7-O |
Mus Musculus (cluster #7 Of 9), Other |
Other |
5 |
0.42 |
Functional ≤ 10μM
|
|
Z50597-11-O |
Rattus Norvegicus (cluster #11 Of 12), Other |
Other |
20 |
0.38 |
Functional ≤ 10μM
|
|
Z80178-2-O |
J774.A1 (Macrophage Cells) (cluster #2 Of 3), Other |
Other |
48 |
0.37 |
Functional ≤ 10μM
|
|
Z80301-2-O |
N9 (cluster #2 Of 2), Other |
Other |
74 |
0.36 |
Functional ≤ 10μM
|
|
Z80418-3-O |
RAW264.7 (Monocytic-macrophage Leukemia Cells) (cluster #3 Of 9), Other |
Other |
860 |
0.30 |
Functional ≤ 10μM
|
|
Z80548-4-O |
THP-1 (Acute Monocytic Leukemia Cells) (cluster #4 Of 5), Other |
Other |
7 |
0.41 |
Functional ≤ 10μM
|
|
Z80954-3-O |
HFF (Foreskin Fibroblasts) (cluster #3 Of 4), Other |
Other |
2 |
0.43 |
Functional ≤ 10μM
|
|
Z81247-4-O |
HeLa (Cervical Adenocarcinoma Cells) (cluster #4 Of 9), Other |
Other |
17 |
0.39 |
Functional ≤ 10μM
|
|
Z81338-2-O |
T-cells (cluster #2 Of 3), Other |
Other |
5 |
0.42 |
Functional ≤ 10μM
|
Physical Representations
|
Type
pH range
|
xlogP
|
Des A‑Pol
Apolar desolvation
(kcal/mol)
|
Des Pol
Polar desolvation
(kcal/mol)
|
H Don
H-bond donors
|
H Acc
H-bond acceptors
|
Chg
Net charge
|
tPSA
(Ų)
|
MWT
Molecular weight
(g/mol)
|
RB
Rotatable bonds
|
DL |
|
Ref
Reference (pH 7)
|
2.06 |
3.98 |
-16.38 |
3 |
5 |
0 |
95 |
392.467 |
2 |
↓
|
|
|
|
Analogs
Draw
Identity
99%
90%
80%
70%
Vendors
Physical Representations
|
Type
pH range
|
xlogP
|
Des A‑Pol
Apolar desolvation
(kcal/mol)
|
Des Pol
Polar desolvation
(kcal/mol)
|
H Don
H-bond donors
|
H Acc
H-bond acceptors
|
Chg
Net charge
|
tPSA
(Ų)
|
MWT
Molecular weight
(g/mol)
|
RB
Rotatable bonds
|
DL |
|
Ref
Reference (pH 7)
|
3.93 |
9.58 |
-70.31 |
2 |
6 |
1 |
81 |
416.288 |
2 |
↓
|
|
Hi
High (pH 8-9.5)
|
3.93 |
8.14 |
-10.84 |
1 |
6 |
0 |
76 |
415.28 |
2 |
↓
|
|
|
|
Analogs
-
2369677
-
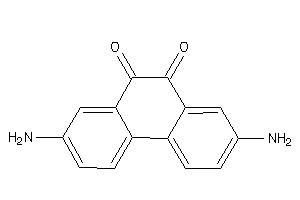
Draw
Identity
99%
90%
80%
70%
Vendors
Physical Representations
|
Type
pH range
|
xlogP
|
Des A‑Pol
Apolar desolvation
(kcal/mol)
|
Des Pol
Polar desolvation
(kcal/mol)
|
H Don
H-bond donors
|
H Acc
H-bond acceptors
|
Chg
Net charge
|
tPSA
(Ų)
|
MWT
Molecular weight
(g/mol)
|
RB
Rotatable bonds
|
DL |
|
Ref
Reference (pH 7)
|
1.83 |
5.46 |
-11.78 |
2 |
3 |
0 |
60 |
223.231 |
0 |
↓
|
|
|
|
Analogs
Draw
Identity
99%
90%
80%
70%
Vendors
And 7 More
Physical Representations
|
Type
pH range
|
xlogP
|
Des A‑Pol
Apolar desolvation
(kcal/mol)
|
Des Pol
Polar desolvation
(kcal/mol)
|
H Don
H-bond donors
|
H Acc
H-bond acceptors
|
Chg
Net charge
|
tPSA
(Ų)
|
MWT
Molecular weight
(g/mol)
|
RB
Rotatable bonds
|
DL |
|
Ref
Reference (pH 7)
|
2.71 |
2.12 |
-15.09 |
0 |
5 |
0 |
79 |
253.213 |
1 |
↓
|
|
|
|
Analogs
Draw
Identity
99%
90%
80%
70%
Vendors
Clustered Target Annotations
| Code |
Organism Class |
Affinity (nM) |
LE (kcal/mol/atom) |
Type |
|
PTPRC-3-E |
Leukocyte Common Antigen (cluster #3 Of 3), Eukaryotic |
Eukaryotes |
500 |
0.46 |
Binding ≤ 10μM
|
|
Z81338-1-O |
T-cells (cluster #1 Of 3), Other |
Other |
1300 |
0.43 |
Functional ≤ 10μM
|
Physical Representations
|
Type
pH range
|
xlogP
|
Des A‑Pol
Apolar desolvation
(kcal/mol)
|
Des Pol
Polar desolvation
(kcal/mol)
|
H Don
H-bond donors
|
H Acc
H-bond acceptors
|
Chg
Net charge
|
tPSA
(Ų)
|
MWT
Molecular weight
(g/mol)
|
RB
Rotatable bonds
|
DL |
|
Ref
Reference (pH 7)
|
2.69 |
2.09 |
-10.2 |
0 |
5 |
0 |
79 |
253.213 |
1 |
↓
|
|
|
|
Analogs
Draw
Identity
99%
90%
80%
70%
Vendors
Physical Representations
|
Type
pH range
|
xlogP
|
Des A‑Pol
Apolar desolvation
(kcal/mol)
|
Des Pol
Polar desolvation
(kcal/mol)
|
H Don
H-bond donors
|
H Acc
H-bond acceptors
|
Chg
Net charge
|
tPSA
(Ų)
|
MWT
Molecular weight
(g/mol)
|
RB
Rotatable bonds
|
DL |
|
Ref
Reference (pH 7)
|
3.64 |
8.51 |
-21.23 |
1 |
4 |
0 |
63 |
307.349 |
2 |
↓
|
|
|
|
Analogs
Draw
Identity
99%
90%
80%
70%
Vendors
And 40 More
Physical Representations
|
Type
pH range
|
xlogP
|
Des A‑Pol
Apolar desolvation
(kcal/mol)
|
Des Pol
Polar desolvation
(kcal/mol)
|
H Don
H-bond donors
|
H Acc
H-bond acceptors
|
Chg
Net charge
|
tPSA
(Ų)
|
MWT
Molecular weight
(g/mol)
|
RB
Rotatable bonds
|
DL |
|
Ref
Reference (pH 7)
|
2.78 |
7.58 |
-11.46 |
0 |
2 |
0 |
34 |
208.216 |
0 |
↓
|
|
|
|
Analogs
Draw
Identity
99%
90%
80%
70%
Vendors
And 24 More
Physical Representations
|
Type
pH range
|
xlogP
|
Des A‑Pol
Apolar desolvation
(kcal/mol)
|
Des Pol
Polar desolvation
(kcal/mol)
|
H Don
H-bond donors
|
H Acc
H-bond acceptors
|
Chg
Net charge
|
tPSA
(Ų)
|
MWT
Molecular weight
(g/mol)
|
RB
Rotatable bonds
|
DL |
|
Ref
Reference (pH 7)
|
1.67 |
6.09 |
-12.34 |
0 |
2 |
0 |
34 |
158.156 |
0 |
↓
|
|
|
|
Analogs
Draw
Identity
99%
90%
80%
70%
Vendors
Clustered Target Annotations
| Code |
Organism Class |
Affinity (nM) |
LE (kcal/mol/atom) |
Type |
|
PTPRC-3-E |
Leukocyte Common Antigen (cluster #3 Of 3), Eukaryotic |
Eukaryotes |
400 |
0.53 |
Binding ≤ 10μM
|
|
Z81338-1-O |
T-cells (cluster #1 Of 3), Other |
Other |
600 |
0.51 |
Functional ≤ 10μM
|
Physical Representations
|
Type
pH range
|
xlogP
|
Des A‑Pol
Apolar desolvation
(kcal/mol)
|
Des Pol
Polar desolvation
(kcal/mol)
|
H Don
H-bond donors
|
H Acc
H-bond acceptors
|
Chg
Net charge
|
tPSA
(Ų)
|
MWT
Molecular weight
(g/mol)
|
RB
Rotatable bonds
|
DL |
|
Ref
Reference (pH 7)
|
3.56 |
8.2 |
-10.88 |
0 |
2 |
0 |
34 |
287.112 |
0 |
↓
|
|
|
|
Analogs
-
43427402
-
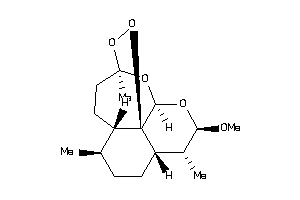
-
8214360
-
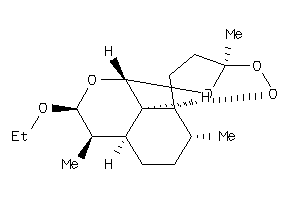
-
8214363
-
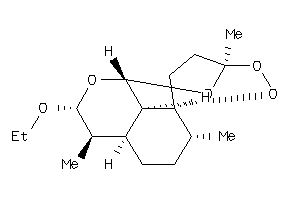
Draw
Identity
99%
90%
80%
70%
Vendors
And 2 More
Physical Representations
|
Type
pH range
|
xlogP
|
Des A‑Pol
Apolar desolvation
(kcal/mol)
|
Des Pol
Polar desolvation
(kcal/mol)
|
H Don
H-bond donors
|
H Acc
H-bond acceptors
|
Chg
Net charge
|
tPSA
(Ų)
|
MWT
Molecular weight
(g/mol)
|
RB
Rotatable bonds
|
DL |
|
Ref
Reference (pH 7)
|
3.40 |
5.25 |
-6.37 |
0 |
5 |
0 |
46 |
298.379 |
1 |
↓
|
|
|
|
Analogs
Draw
Identity
99%
90%
80%
70%
Vendors
And 20 More
Clustered Target Annotations
| Code |
Organism Class |
Affinity (nM) |
LE (kcal/mol/atom) |
Type |
|
VDR-1-E |
Vitamin D Receptor (cluster #1 Of 2), Eukaryotic |
Eukaryotes |
0 |
0.00 |
Binding ≤ 10μM
|
|
VDR-1-E |
Vitamin D Receptor (cluster #1 Of 1), Eukaryotic |
Eukaryotes |
1 |
0.42 |
Functional ≤ 10μM
|
|
Z100081-2-O |
PBMC (Peripheral Blood Mononuclear Cells) (cluster #2 Of 4), Other |
Other |
8 |
0.38 |
Functional ≤ 10μM
|
|
Z50587-5-O |
Homo Sapiens (cluster #5 Of 9), Other |
Other |
50 |
0.34 |
Functional ≤ 10μM
|
|
Z80156-5-O |
HL-60 (Promyeloblast Leukemia Cells) (cluster #5 Of 12), Other |
Other |
3 |
0.40 |
Functional ≤ 10μM
|
|
Z80224-2-O |
MCF7 (Breast Carcinoma Cells) (cluster #2 Of 14), Other |
Other |
52 |
0.34 |
Functional ≤ 10μM
|
|
Z80437-1-O |
RWLeu4 (cluster #1 Of 1), Other |
Other |
6 |
0.38 |
Functional ≤ 10μM |
|
Z80437-1-O |
RWLeu4 (cluster #1 Of 1), Other |
Other |
6 |
0.38 |
Functional ≤ 10μM |
|
Z80566-2-O |
U-937 (Histiocytic Lymphoma Cells) (cluster #2 Of 2), Other |
Other |
10 |
0.37 |
Functional ≤ 10μM |
|
Z80566-2-O |
U-937 (Histiocytic Lymphoma Cells) (cluster #2 Of 2), Other |
Other |
17 |
0.36 |
Functional ≤ 10μM |
|
Z81117-2-O |
Keratinocytes (Keratinocytes) (cluster #2 Of 2), Other |
Other |
27 |
0.35 |
Functional ≤ 10μM
|
|
Z81298-1-O |
PE Cell Line (cluster #1 Of 1), Other |
Other |
100 |
0.33 |
Functional ≤ 10μM |
|
Z81338-2-O |
T-cells (cluster #2 Of 3), Other |
Other |
0 |
0.00 |
Functional ≤ 10μM |
Physical Representations
|
Type
pH range
|
xlogP
|
Des A‑Pol
Apolar desolvation
(kcal/mol)
|
Des Pol
Polar desolvation
(kcal/mol)
|
H Don
H-bond donors
|
H Acc
H-bond acceptors
|
Chg
Net charge
|
tPSA
(Ų)
|
MWT
Molecular weight
(g/mol)
|
RB
Rotatable bonds
|
DL |
|
Ref
Reference (pH 7)
|
5.56 |
6.98 |
-5.55 |
3 |
3 |
0 |
61 |
416.646 |
6 |
↓
|
|
|
|
Analogs
-
1661
-
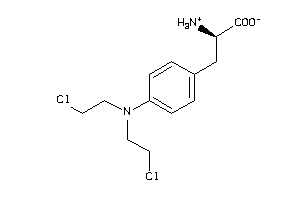
Draw
Identity
99%
90%
80%
70%
Vendors
And 1 More
Clustered Target Annotations
| Code |
Organism Class |
Affinity (nM) |
LE (kcal/mol/atom) |
Type |
|
Z103204-1-O |
A427 (cluster #1 Of 4), Other |
Other |
5130 |
0.39 |
Functional ≤ 10μM
|
|
Z50425-3-O |
Plasmodium Falciparum (cluster #3 Of 22), Other |
Other |
10000 |
0.37 |
Functional ≤ 10μM
|
|
Z50587-3-O |
Homo Sapiens (cluster #3 Of 9), Other |
Other |
3240 |
0.40 |
Functional ≤ 10μM
|
|
Z80008-2-O |
5637 (Epithelial Bladder Carcinoma Cells) (cluster #2 Of 3), Other |
Other |
310 |
0.48 |
Functional ≤ 10μM
|
|
Z80035-2-O |
B16 (Melanoma Cells) (cluster #2 Of 7), Other |
Other |
2200 |
0.42 |
Functional ≤ 10μM
|
|
Z80064-7-O |
CCRF-CEM (T-cell Leukemia) (cluster #7 Of 9), Other |
Other |
6170 |
0.38 |
Functional ≤ 10μM
|
|
Z80112-1-O |
DAN-G (cluster #1 Of 2), Other |
Other |
2650 |
0.41 |
Functional ≤ 10μM
|
|
Z80156-4-O |
HL-60 (Promyeloblast Leukemia Cells) (cluster #4 Of 12), Other |
Other |
2040 |
0.42 |
Functional ≤ 10μM
|
|
Z80193-10-O |
L1210 (Lymphocytic Leukemia Cells) (cluster #10 Of 12), Other |
Other |
981 |
0.44 |
Functional ≤ 10μM
|
|
Z80211-2-O |
LoVo (Colon Adenocarcinoma Cells) (cluster #2 Of 5), Other |
Other |
4900 |
0.39 |
Functional ≤ 10μM
|
|
Z80224-1-O |
MCF7 (Breast Carcinoma Cells) (cluster #1 Of 14), Other |
Other |
5700 |
0.39 |
Functional ≤ 10μM
|
|
Z80231-2-O |
MCF7S (Breast Carcinoma Cells) (cluster #2 Of 2), Other |
Other |
300 |
0.48 |
Functional ≤ 10μM
|
|
Z80285-2-O |
MOLT-4 (Acute T-lymphoblastic Leukemia Cells) (cluster #2 Of 4), Other |
Other |
3240 |
0.40 |
Functional ≤ 10μM
|
|
Z80362-3-O |
P388 (Lymphoma Cells) (cluster #3 Of 8), Other |
Other |
220 |
0.49 |
Functional ≤ 10μM
|
|
Z80473-1-O |
SISO (cluster #1 Of 2), Other |
Other |
1000 |
0.44 |
Functional ≤ 10μM
|
|
Z80604-1-O |
YAPC (cluster #1 Of 2), Other |
Other |
5950 |
0.39 |
Functional ≤ 10μM
|
|
Z80807-1-O |
D283 Cell Line (cluster #1 Of 1), Other |
Other |
6800 |
0.38 |
Functional ≤ 10μM
|
|
Z80874-3-O |
CEM (T-cell Leukemia) (cluster #3 Of 7), Other |
Other |
2500 |
0.41 |
Functional ≤ 10μM
|
|
Z80887-1-O |
H2981 Cell Line (cluster #1 Of 1), Other |
Other |
5000 |
0.39 |
Functional ≤ 10μM
|
|
Z81072-6-O |
Jurkat (Acute Leukemic T-cells) (cluster #6 Of 10), Other |
Other |
2200 |
0.42 |
Functional ≤ 10μM
|
|
Z81235-1-O |
M4Beu Cell Line (cluster #1 Of 1), Other |
Other |
1200 |
0.44 |
Functional ≤ 10μM
|
|
Z81247-2-O |
HeLa (Cervical Adenocarcinoma Cells) (cluster #2 Of 9), Other |
Other |
1900 |
0.42 |
Functional ≤ 10μM
|
|
Z81252-3-O |
MDA-MB-231 (Breast Adenocarcinoma Cells) (cluster #3 Of 11), Other |
Other |
5700 |
0.39 |
Functional ≤ 10μM
|
|
Z81338-1-O |
T-cells (cluster #1 Of 3), Other |
Other |
2200 |
0.42 |
Functional ≤ 10μM
|
|
Z80874-2-O |
CEM (T-cell Leukemia) (cluster #2 Of 4), Other |
Other |
2470 |
0.41 |
ADME/T ≤ 10μM
|
|
Z81325-1-O |
SR (Leukemia Cells) (cluster #1 Of 1), Other |
Other |
1860 |
0.42 |
ADME/T ≤ 10μM
|
Physical Representations
|
Type
pH range
|
xlogP
|
Des A‑Pol
Apolar desolvation
(kcal/mol)
|
Des Pol
Polar desolvation
(kcal/mol)
|
H Don
H-bond donors
|
H Acc
H-bond acceptors
|
Chg
Net charge
|
tPSA
(Ų)
|
MWT
Molecular weight
(g/mol)
|
RB
Rotatable bonds
|
DL |
|
Ref
Reference (pH 7)
|
0.08 |
6.61 |
-40.9 |
3 |
4 |
0 |
71 |
305.205 |
8 |
↓
|
|