|
|
Analogs
Draw
Identity
99%
90%
80%
70%
Vendors
And 56 More
Physical Representations
|
Type
pH range
|
xlogP
|
Des A‑Pol
Apolar desolvation
(kcal/mol)
|
Des Pol
Polar desolvation
(kcal/mol)
|
H Don
H-bond donors
|
H Acc
H-bond acceptors
|
Chg
Net charge
|
tPSA
(Ų)
|
MWT
Molecular weight
(g/mol)
|
RB
Rotatable bonds
|
DL |
|
Ref
Reference (pH 7)
|
-0.58 |
3.49 |
-22.11 |
4 |
5 |
0 |
83 |
167.197 |
0 |
↓
|
|
Hi
High (pH 8-9.5)
|
0.14 |
3.08 |
-52.15 |
3 |
5 |
-1 |
80 |
166.189 |
0 |
↓
|
|
|
|
Analogs
-
13819459
-
Draw
Identity
99%
90%
80%
70%
Vendors
Clustered Target Annotations
| Code |
Organism Class |
Affinity (nM) |
LE (kcal/mol/atom) |
Type |
|
CCNB1-1-E |
G2/mitotic-specific Cyclin B1 (cluster #1 Of 2), Eukaryotic |
Eukaryotes |
20 |
0.40 |
Binding ≤ 10μM
|
|
CCNB2-1-E |
G2/mitotic-specific Cyclin B2 (cluster #1 Of 2), Eukaryotic |
Eukaryotes |
20 |
0.40 |
Binding ≤ 10μM
|
|
CCNB3-1-E |
G2/mitotic-specific Cyclin B3 (cluster #1 Of 2), Eukaryotic |
Eukaryotes |
20 |
0.40 |
Binding ≤ 10μM
|
|
CDK1-1-E |
Cyclin-dependent Kinase 1 (cluster #1 Of 4), Eukaryotic |
Eukaryotes |
20 |
0.40 |
Binding ≤ 10μM
|
|
Z80138-1-O |
G-361 (Melanoma Cells) (cluster #1 Of 1), Other |
Other |
6300 |
0.27 |
Functional ≤ 10μM
|
|
Z80224-1-O |
MCF7 (Breast Carcinoma Cells) (cluster #1 Of 14), Other |
Other |
5300 |
0.27 |
Functional ≤ 10μM
|
|
Z80874-7-O |
CEM (T-cell Leukemia) (cluster #7 Of 7), Other |
Other |
8100 |
0.26 |
Functional ≤ 10μM
|
|
Z80979-1-O |
HOS Cancer Cell Line (cluster #1 Of 1), Other |
Other |
6300 |
0.27 |
Functional ≤ 10μM
|
|
Z81247-1-O |
HeLa (Cervical Adenocarcinoma Cells) (cluster #1 Of 9), Other |
Other |
9900 |
0.26 |
Functional ≤ 10μM
|
|
Z80704-1-O |
BJ (Foreskin Fibroblast Cells) (cluster #1 Of 2), Other |
Other |
5400 |
0.27 |
ADME/T ≤ 10μM
|
Physical Representations
|
Type
pH range
|
xlogP
|
Des A‑Pol
Apolar desolvation
(kcal/mol)
|
Des Pol
Polar desolvation
(kcal/mol)
|
H Don
H-bond donors
|
H Acc
H-bond acceptors
|
Chg
Net charge
|
tPSA
(Ų)
|
MWT
Molecular weight
(g/mol)
|
RB
Rotatable bonds
|
DL |
|
Ref
Reference (pH 7)
|
3.59 |
6.83 |
-12.29 |
4 |
8 |
0 |
108 |
370.457 |
8 |
↓
|
|
Hi
High (pH 8-9.5)
|
3.59 |
7.58 |
-54.97 |
3 |
8 |
-1 |
111 |
369.449 |
8 |
↓
|
|
Lo
Low (pH 4.5-6)
|
3.59 |
7.09 |
-29.94 |
5 |
8 |
1 |
109 |
371.465 |
8 |
↓
|
|
|
|
Analogs
Draw
Identity
99%
90%
80%
70%
Vendors
Physical Representations
|
Type
pH range
|
xlogP
|
Des A‑Pol
Apolar desolvation
(kcal/mol)
|
Des Pol
Polar desolvation
(kcal/mol)
|
H Don
H-bond donors
|
H Acc
H-bond acceptors
|
Chg
Net charge
|
tPSA
(Ų)
|
MWT
Molecular weight
(g/mol)
|
RB
Rotatable bonds
|
DL |
|
Ref
Reference (pH 7)
|
4.93 |
12.79 |
-11.95 |
2 |
8 |
0 |
86 |
432.528 |
9 |
↓
|
|
Lo
Low (pH 4.5-6)
|
4.93 |
13.07 |
-35.61 |
3 |
8 |
1 |
87 |
433.536 |
9 |
↓
|
|
Lo
Low (pH 4.5-6)
|
4.93 |
13.18 |
-31.89 |
3 |
8 |
1 |
87 |
433.536 |
9 |
↓
|
|
|
|
Analogs
Draw
Identity
99%
90%
80%
70%
Vendors
Clustered Target Annotations
| Code |
Organism Class |
Affinity (nM) |
LE (kcal/mol/atom) |
Type |
|
Z101697-1-O |
Camelpox Virus (cluster #1 Of 1), Other |
Other |
5500 |
0.39 |
Functional ≤ 10μM
|
|
Z50515-2-O |
Human Herpesvirus 2 (cluster #2 Of 2), Other |
Other |
1100 |
0.44 |
Functional ≤ 10μM
|
|
Z50530-4-O |
Human Herpesvirus 5 (cluster #4 Of 5), Other |
Other |
90 |
0.52 |
Functional ≤ 10μM
|
|
Z50607-1-O |
Human Immunodeficiency Virus 1 (cluster #1 Of 10), Other |
Other |
200 |
0.49 |
Functional ≤ 10μM
|
|
Z80291-2-O |
MRC5 (Embryonic Lung Fibroblast Cells) (cluster #2 Of 3), Other |
Other |
90 |
0.52 |
Functional ≤ 10μM
|
|
Z80295-2-O |
MT4 (Lymphocytes) (cluster #2 Of 8), Other |
Other |
200 |
0.49 |
Functional ≤ 10μM
|
|
Z80472-1-O |
SiHa (Cervical Squamous Cell Carcinoma) (cluster #1 Of 2), Other |
Other |
8970 |
0.37 |
Functional ≤ 10μM
|
|
Z80583-7-O |
Vero (Kidney Cells) (cluster #7 Of 7), Other |
Other |
1100 |
0.44 |
Functional ≤ 10μM
|
|
Z80874-7-O |
CEM (T-cell Leukemia) (cluster #7 Of 7), Other |
Other |
200 |
0.49 |
Functional ≤ 10μM
|
|
Z81247-5-O |
HeLa (Cervical Adenocarcinoma Cells) (cluster #5 Of 9), Other |
Other |
2160 |
0.42 |
Functional ≤ 10μM
|
Physical Representations
|
Type
pH range
|
xlogP
|
Des A‑Pol
Apolar desolvation
(kcal/mol)
|
Des Pol
Polar desolvation
(kcal/mol)
|
H Don
H-bond donors
|
H Acc
H-bond acceptors
|
Chg
Net charge
|
tPSA
(Ų)
|
MWT
Molecular weight
(g/mol)
|
RB
Rotatable bonds
|
DL |
|
Ref
Reference (pH 7)
|
-2.14 |
-0.85 |
-60.55 |
4 |
10 |
-1 |
159 |
288.18 |
5 |
↓
|
|
|
|
Analogs
-
40147
-
-
40148
-
-
40149
-
Draw
Identity
99%
90%
80%
70%
Vendors
And 21 More
Physical Representations
|
Type
pH range
|
xlogP
|
Des A‑Pol
Apolar desolvation
(kcal/mol)
|
Des Pol
Polar desolvation
(kcal/mol)
|
H Don
H-bond donors
|
H Acc
H-bond acceptors
|
Chg
Net charge
|
tPSA
(Ų)
|
MWT
Molecular weight
(g/mol)
|
RB
Rotatable bonds
|
DL |
|
Ref
Reference (pH 7)
|
0.02 |
1.15 |
-10.79 |
3 |
7 |
0 |
99 |
235.247 |
2 |
↓
|
|
|
|
Analogs
-
582580
-
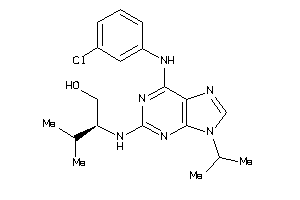
Draw
Identity
99%
90%
80%
70%
Vendors
And 7 More
Clustered Target Annotations
| Code |
Organism Class |
Affinity (nM) |
LE (kcal/mol/atom) |
Type |
|
CCNA1-1-E |
Cyclin A1 (cluster #1 Of 3), Eukaryotic |
Eukaryotes |
70 |
0.37 |
Binding ≤ 10μM
|
|
CCNA2-1-E |
Cyclin A2 (cluster #1 Of 3), Eukaryotic |
Eukaryotes |
70 |
0.37 |
Binding ≤ 10μM
|
|
CCNB1-1-E |
G2/mitotic-specific Cyclin B1 (cluster #1 Of 2), Eukaryotic |
Eukaryotes |
50 |
0.38 |
Binding ≤ 10μM
|
|
CCNB2-1-E |
G2/mitotic-specific Cyclin B2 (cluster #1 Of 2), Eukaryotic |
Eukaryotes |
50 |
0.38 |
Binding ≤ 10μM
|
|
CCNB3-1-E |
G2/mitotic-specific Cyclin B3 (cluster #1 Of 2), Eukaryotic |
Eukaryotes |
50 |
0.38 |
Binding ≤ 10μM
|
|
CCNE1-1-E |
G1/S-specific Cyclin E1 (cluster #1 Of 2), Eukaryotic |
Eukaryotes |
35 |
0.39 |
Binding ≤ 10μM
|
|
CCNE2-1-E |
G1/S-specific Cyclin E2 (cluster #1 Of 2), Eukaryotic |
Eukaryotes |
35 |
0.39 |
Binding ≤ 10μM
|
|
CDK1-1-E |
Cyclin-dependent Kinase 1 (cluster #1 Of 4), Eukaryotic |
Eukaryotes |
50 |
0.38 |
Binding ≤ 10μM
|
|
CDK2-1-E |
Cyclin-dependent Kinase 2 (cluster #1 Of 5), Eukaryotic |
Eukaryotes |
70 |
0.37 |
Binding ≤ 10μM
|
|
CDK4-1-E |
Cyclin-dependent Kinase 4 (cluster #1 Of 3), Eukaryotic |
Eukaryotes |
850 |
0.31 |
Binding ≤ 10μM
|
|
CDK5-1-E |
Cyclin-dependent Kinase 5 (cluster #1 Of 1), Eukaryotic |
Eukaryotes |
75 |
0.37 |
Binding ≤ 10μM
|
|
INSR-1-E |
Insulin Receptor (cluster #1 Of 1), Eukaryotic |
Eukaryotes |
5000 |
0.27 |
Binding ≤ 10μM
|
|
KAPCA-1-E |
CAMP-dependent Protein Kinase Alpha-catalytic Subunit (cluster #1 Of 4), Eukaryotic |
Eukaryotes |
9000 |
0.26 |
Binding ≤ 10μM
|
|
KAPCB-1-E |
CAMP-dependent Protein Kinase Beta-1 Catalytic Subunit (cluster #1 Of 3), Eukaryotic |
Eukaryotes |
9000 |
0.26 |
Binding ≤ 10μM
|
|
KAPCG-1-E |
CAMP-dependent Protein Kinase, Gamma Catalytic Subunit (cluster #1 Of 2), Eukaryotic |
Eukaryotes |
9000 |
0.26 |
Binding ≤ 10μM
|
|
MK03-1-E |
MAP Kinase ERK1 (cluster #1 Of 1), Eukaryotic |
Eukaryotes |
9000 |
0.26 |
Binding ≤ 10μM
|
|
PAK4-1-E |
Serine/threonine-protein Kinase PAK 4 (cluster #1 Of 1), Eukaryotic |
Eukaryotes |
130 |
0.36 |
Binding ≤ 10μM
|
|
Q17066-1-E |
Cdc2 (cluster #1 Of 1), Eukaryotic |
Eukaryotes |
500 |
0.33 |
Binding ≤ 10μM
|
|
SRC-1-E |
Tyrosine-protein Kinase SRC (cluster #1 Of 3), Eukaryotic |
Eukaryotes |
240 |
0.34 |
Binding ≤ 10μM
|
|
CDK1-1-F |
Cyclin-dependent Kinase 1 (cluster #1 Of 1), Fungal |
Fungi |
80 |
0.37 |
Binding ≤ 10μM
|
|
Z104295-1-O |
Cyclin-dependent Kinase 4/cyclin D1 (cluster #1 Of 2), Other |
Other |
850 |
0.31 |
Binding ≤ 10μM
|
|
Z50425-15-O |
Plasmodium Falciparum (cluster #15 Of 22), Other |
Other |
9200 |
0.26 |
Functional ≤ 10μM
|
|
Z80186-1-O |
K562 (Erythroleukemia Cells) (cluster #1 Of 11), Other |
Other |
9000 |
0.26 |
Functional ≤ 10μM
|
|
Z80874-7-O |
CEM (T-cell Leukemia) (cluster #7 Of 7), Other |
Other |
7400 |
0.27 |
Functional ≤ 10μM
|
Physical Representations
|
Type
pH range
|
xlogP
|
Des A‑Pol
Apolar desolvation
(kcal/mol)
|
Des Pol
Polar desolvation
(kcal/mol)
|
H Don
H-bond donors
|
H Acc
H-bond acceptors
|
Chg
Net charge
|
tPSA
(Ų)
|
MWT
Molecular weight
(g/mol)
|
RB
Rotatable bonds
|
DL |
|
Ref
Reference (pH 7)
|
5.28 |
10.24 |
-10.66 |
3 |
7 |
0 |
88 |
388.903 |
7 |
↓
|
|
|
|
Analogs
-
33893
-
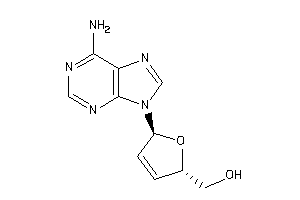
-
33895
-
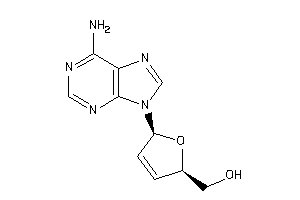
Draw
Identity
99%
90%
80%
70%
Vendors
Clustered Target Annotations
| Code |
Organism Class |
Affinity (nM) |
LE (kcal/mol/atom) |
Type |
|
Z80874-7-O |
CEM (T-cell Leukemia) (cluster #7 Of 7), Other |
Other |
540 |
0.52 |
Functional ≤ 10μM |
|
Z81020-1-O |
HepG2 (Hepatoblastoma Cells) (cluster #1 Of 8), Other |
Other |
1200 |
0.49 |
Functional ≤ 10μM |
Physical Representations
|
Type
pH range
|
xlogP
|
Des A‑Pol
Apolar desolvation
(kcal/mol)
|
Des Pol
Polar desolvation
(kcal/mol)
|
H Don
H-bond donors
|
H Acc
H-bond acceptors
|
Chg
Net charge
|
tPSA
(Ų)
|
MWT
Molecular weight
(g/mol)
|
RB
Rotatable bonds
|
DL |
|
Ref
Reference (pH 7)
|
0.00 |
0.89 |
-11.1 |
3 |
7 |
0 |
99 |
233.231 |
2 |
↓
|
|
Lo
Low (pH 4.5-6)
|
0.00 |
1.15 |
-35.13 |
4 |
7 |
1 |
100 |
234.239 |
2 |
↓
|
|
Lo
Low (pH 4.5-6)
|
0.00 |
-3.23 |
-33.93 |
4 |
7 |
1 |
100 |
234.239 |
2 |
↓
|
|
|
|
Analogs
-
33895
-

-
33892
-
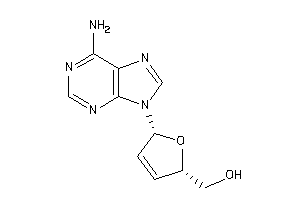
Draw
Identity
99%
90%
80%
70%
Vendors
Clustered Target Annotations
| Code |
Organism Class |
Affinity (nM) |
LE (kcal/mol/atom) |
Type |
|
Z80874-7-O |
CEM (T-cell Leukemia) (cluster #7 Of 7), Other |
Other |
540 |
0.52 |
Functional ≤ 10μM |
|
Z81020-1-O |
HepG2 (Hepatoblastoma Cells) (cluster #1 Of 8), Other |
Other |
1200 |
0.49 |
Functional ≤ 10μM |
Physical Representations
|
Type
pH range
|
xlogP
|
Des A‑Pol
Apolar desolvation
(kcal/mol)
|
Des Pol
Polar desolvation
(kcal/mol)
|
H Don
H-bond donors
|
H Acc
H-bond acceptors
|
Chg
Net charge
|
tPSA
(Ų)
|
MWT
Molecular weight
(g/mol)
|
RB
Rotatable bonds
|
DL |
|
Ref
Reference (pH 7)
|
0.00 |
0.81 |
-11.26 |
3 |
7 |
0 |
99 |
233.231 |
2 |
↓
|
|
Lo
Low (pH 4.5-6)
|
0.00 |
1.06 |
-35.84 |
4 |
7 |
1 |
100 |
234.239 |
2 |
↓
|
|
Lo
Low (pH 4.5-6)
|
0.00 |
-3.32 |
-34.32 |
4 |
7 |
1 |
100 |
234.239 |
2 |
↓
|
|
|
|
Analogs
-
33892
-

Draw
Identity
99%
90%
80%
70%
Vendors
Clustered Target Annotations
| Code |
Organism Class |
Affinity (nM) |
LE (kcal/mol/atom) |
Type |
|
Z80874-7-O |
CEM (T-cell Leukemia) (cluster #7 Of 7), Other |
Other |
540 |
0.52 |
Functional ≤ 10μM |
|
Z81020-1-O |
HepG2 (Hepatoblastoma Cells) (cluster #1 Of 8), Other |
Other |
1200 |
0.49 |
Functional ≤ 10μM |
Physical Representations
|
Type
pH range
|
xlogP
|
Des A‑Pol
Apolar desolvation
(kcal/mol)
|
Des Pol
Polar desolvation
(kcal/mol)
|
H Don
H-bond donors
|
H Acc
H-bond acceptors
|
Chg
Net charge
|
tPSA
(Ų)
|
MWT
Molecular weight
(g/mol)
|
RB
Rotatable bonds
|
DL |
|
Ref
Reference (pH 7)
|
0.00 |
0.83 |
-10.91 |
3 |
7 |
0 |
99 |
233.231 |
2 |
↓
|
|
Lo
Low (pH 4.5-6)
|
0.00 |
-3.29 |
-33.72 |
4 |
7 |
1 |
100 |
234.239 |
2 |
↓
|
|
|
|
|
|
|
|
|
|
Analogs
Draw
Identity
99%
90%
80%
70%
Vendors
And 44 More
Physical Representations
|
Type
pH range
|
xlogP
|
Des A‑Pol
Apolar desolvation
(kcal/mol)
|
Des Pol
Polar desolvation
(kcal/mol)
|
H Don
H-bond donors
|
H Acc
H-bond acceptors
|
Chg
Net charge
|
tPSA
(Ų)
|
MWT
Molecular weight
(g/mol)
|
RB
Rotatable bonds
|
DL |
|
Ref
Reference (pH 7)
|
-0.62 |
1.5 |
-46.54 |
3 |
9 |
-1 |
139 |
286.208 |
5 |
↓
|
|
|
|
Analogs
Draw
Identity
99%
90%
80%
70%
Vendors
And 24 More
Clustered Target Annotations
| Code |
Organism Class |
Affinity (nM) |
LE (kcal/mol/atom) |
Type |
|
Z102020-1-O |
Porcine Endogenous Retrovirus (cluster #1 Of 1), Other |
Other |
3400 |
0.43 |
Functional ≤ 10μM
|
|
Z50515-2-O |
Human Herpesvirus 2 (cluster #2 Of 2), Other |
Other |
0 |
0.00 |
Functional ≤ 10μM
|
|
Z50527-3-O |
Human Herpesvirus 3 (cluster #3 Of 3), Other |
Other |
5000 |
0.41 |
Functional ≤ 10μM |
|
Z50530-1-O |
Human Herpesvirus 5 (cluster #1 Of 5), Other |
Other |
0 |
0.00 |
Functional ≤ 10μM
|
|
Z50602-2-O |
Human Herpesvirus 1 (cluster #2 Of 5), Other |
Other |
200 |
0.52 |
Functional ≤ 10μM
|
|
Z50606-1-O |
Hepatitis B Virus (cluster #1 Of 3), Other |
Other |
7700 |
0.40 |
Functional ≤ 10μM
|
|
Z50607-2-O |
Human Immunodeficiency Virus 1 (cluster #2 Of 10), Other |
Other |
7900 |
0.40 |
Functional ≤ 10μM |
|
Z50611-2-O |
Moloney Murine Leukemia Virus (cluster #2 Of 3), Other |
Other |
530 |
0.49 |
Functional ≤ 10μM
|
|
Z50612-1-O |
Moloney Murine Sarcoma Virus (cluster #1 Of 2), Other |
Other |
2200 |
0.44 |
Functional ≤ 10μM
|
|
Z50658-2-O |
Human Immunodeficiency Virus 2 (cluster #2 Of 4), Other |
Other |
6600 |
0.40 |
Functional ≤ 10μM
|
|
Z80052-1-O |
C8166 (Leukemic T-cells) (cluster #1 Of 3), Other |
Other |
1700 |
0.45 |
Functional ≤ 10μM |
|
Z80076-1-O |
CEM-SS (T-cell Leukemia) (cluster #1 Of 5), Other |
Other |
420 |
0.50 |
Functional ≤ 10μM
|
|
Z80295-4-O |
MT4 (Lymphocytes) (cluster #4 Of 8), Other |
Other |
7500 |
0.40 |
Functional ≤ 10μM
|
|
Z80874-7-O |
CEM (T-cell Leukemia) (cluster #7 Of 7), Other |
Other |
7000 |
0.40 |
Functional ≤ 10μM
|
|
Z81020-5-O |
HepG2 (Hepatoblastoma Cells) (cluster #5 Of 8), Other |
Other |
2000 |
0.44 |
Functional ≤ 10μM
|
Physical Representations
|
Type
pH range
|
xlogP
|
Des A‑Pol
Apolar desolvation
(kcal/mol)
|
Des Pol
Polar desolvation
(kcal/mol)
|
H Don
H-bond donors
|
H Acc
H-bond acceptors
|
Chg
Net charge
|
tPSA
(Ų)
|
MWT
Molecular weight
(g/mol)
|
RB
Rotatable bonds
|
DL |
|
Ref
Reference (pH 7)
|
-0.98 |
0.91 |
-42.93 |
3 |
9 |
-1 |
139 |
272.181 |
5 |
↓
|
|