|
|
Analogs
-
28537734
-
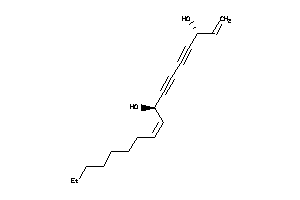
-
38143543
-
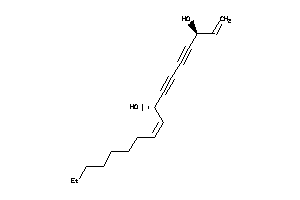
Draw
Identity
99%
90%
80%
70%
Vendors
Physical Representations
|
Type
pH range
|
xlogP
|
Des A‑Pol
Apolar desolvation
(kcal/mol)
|
Des Pol
Polar desolvation
(kcal/mol)
|
H Don
H-bond donors
|
H Acc
H-bond acceptors
|
Chg
Net charge
|
tPSA
(Ų)
|
MWT
Molecular weight
(g/mol)
|
RB
Rotatable bonds
|
DL |
|
Ref
Reference (pH 7)
|
5.08 |
-0.36 |
-5.49 |
2 |
2 |
0 |
40 |
260.377 |
8 |
↓
|
|
|
|
Analogs
-
8214562
-
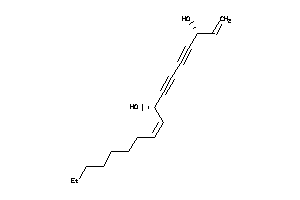
Draw
Identity
99%
90%
80%
70%
Vendors
Clustered Target Annotations
| Code |
Organism Class |
Affinity (nM) |
LE (kcal/mol/atom) |
Type |
|
Z80418-3-O |
RAW264.7 (Monocytic-macrophage Leukemia Cells) (cluster #3 Of 9), Other |
Other |
1540 |
0.43 |
Functional ≤ 10μM
|
|
Z80418-2-O |
RAW264.7 (Monocytic-macrophage Leukemia Cells) (cluster #2 Of 2), Other |
Other |
3770 |
0.40 |
ADME/T ≤ 10μM
|
Physical Representations
|
Type
pH range
|
xlogP
|
Des A‑Pol
Apolar desolvation
(kcal/mol)
|
Des Pol
Polar desolvation
(kcal/mol)
|
H Don
H-bond donors
|
H Acc
H-bond acceptors
|
Chg
Net charge
|
tPSA
(Ų)
|
MWT
Molecular weight
(g/mol)
|
RB
Rotatable bonds
|
DL |
|
Ref
Reference (pH 7)
|
5.08 |
6.45 |
-5.78 |
2 |
2 |
0 |
40 |
260.377 |
8 |
↓
|
|
|
|
Analogs
Draw
Identity
99%
90%
80%
70%
Vendors
And 2 More
Clustered Target Annotations
| Code |
Organism Class |
Affinity (nM) |
LE (kcal/mol/atom) |
Type |
|
Z80418-1-O |
RAW264.7 (Monocytic-macrophage Leukemia Cells) (cluster #1 Of 2), Other |
Other |
10000 |
0.21 |
ADME/T ≤ 10μM
|
Physical Representations
|
Type
pH range
|
xlogP
|
Des A‑Pol
Apolar desolvation
(kcal/mol)
|
Des Pol
Polar desolvation
(kcal/mol)
|
H Don
H-bond donors
|
H Acc
H-bond acceptors
|
Chg
Net charge
|
tPSA
(Ų)
|
MWT
Molecular weight
(g/mol)
|
RB
Rotatable bonds
|
DL |
|
Ref
Reference (pH 7)
|
5.16 |
-0.1 |
-58.83 |
4 |
5 |
1 |
74 |
461.467 |
5 |
↓
|
|
Hi
High (pH 8-9.5)
|
9.70 |
21.4 |
-6.43 |
1 |
3 |
0 |
47 |
576.906 |
15 |
↓
|
|
|
|
Analogs
Draw
Identity
99%
90%
80%
70%
Vendors
Clustered Target Annotations
| Code |
Organism Class |
Affinity (nM) |
LE (kcal/mol/atom) |
Type |
|
CCNB-1-E |
G2/mitotic-specific Cyclin B (cluster #1 Of 1), Eukaryotic |
Eukaryotes |
10000 |
0.35 |
Binding ≤ 10μM
|
|
CCNB1-2-E |
G2/mitotic-specific Cyclin B1 (cluster #2 Of 2), Eukaryotic |
Eukaryotes |
6500 |
0.36 |
Binding ≤ 10μM
|
|
CCNB2-2-E |
G2/mitotic-specific Cyclin B2 (cluster #2 Of 2), Eukaryotic |
Eukaryotes |
6500 |
0.36 |
Binding ≤ 10μM
|
|
CCNB3-2-E |
G2/mitotic-specific Cyclin B3 (cluster #2 Of 2), Eukaryotic |
Eukaryotes |
6500 |
0.36 |
Binding ≤ 10μM
|
|
CDK1-1-E |
Cyclin-dependent Kinase 1 (cluster #1 Of 4), Eukaryotic |
Eukaryotes |
6500 |
0.36 |
Binding ≤ 10μM
|
|
CDK2-2-E |
Cyclin-dependent Kinase 2 (cluster #2 Of 5), Eukaryotic |
Eukaryotes |
2200 |
0.40 |
Binding ≤ 10μM
|
|
GSK3A-1-E |
Glycogen Synthase Kinase-3 Alpha (cluster #1 Of 3), Eukaryotic |
Eukaryotes |
2500 |
0.39 |
Binding ≤ 10μM
|
|
GSK3B-1-E |
Glycogen Synthase Kinase-3 Beta (cluster #1 Of 7), Eukaryotic |
Eukaryotes |
2500 |
0.39 |
Binding ≤ 10μM
|
|
Z104294-1-O |
Cyclin-dependent Kinase 5/CDK5 Activator 1 (cluster #1 Of 2), Other |
Other |
5000 |
0.37 |
Binding ≤ 10μM
|
|
Z50425-3-O |
Plasmodium Falciparum (cluster #3 Of 22), Other |
Other |
1100 |
0.42 |
Functional ≤ 10μM |
|
Z80125-1-O |
DU-145 (Prostate Carcinoma) (cluster #1 Of 9), Other |
Other |
6800 |
0.36 |
Functional ≤ 10μM |
|
Z80211-1-O |
LoVo (Colon Adenocarcinoma Cells) (cluster #1 Of 5), Other |
Other |
2200 |
0.40 |
Functional ≤ 10μM |
|
Z80224-1-O |
MCF7 (Breast Carcinoma Cells) (cluster #1 Of 14), Other |
Other |
6700 |
0.36 |
Functional ≤ 10μM |
|
Z80418-1-O |
RAW264.7 (Monocytic-macrophage Leukemia Cells) (cluster #1 Of 2), Other |
Other |
6100 |
0.37 |
ADME/T ≤ 10μM |
Physical Representations
|
Type
pH range
|
xlogP
|
Des A‑Pol
Apolar desolvation
(kcal/mol)
|
Des Pol
Polar desolvation
(kcal/mol)
|
H Don
H-bond donors
|
H Acc
H-bond acceptors
|
Chg
Net charge
|
tPSA
(Ų)
|
MWT
Molecular weight
(g/mol)
|
RB
Rotatable bonds
|
DL |
|
Ref
Reference (pH 7)
|
3.11 |
4.28 |
-54.71 |
1 |
4 |
-1 |
69 |
261.26 |
1 |
↓
|
|
Lo
Low (pH 4.5-6)
|
3.11 |
3.49 |
-13.33 |
2 |
4 |
0 |
66 |
262.268 |
1 |
↓
|
|
|
|
Analogs
Draw
Identity
99%
90%
80%
70%
Vendors
Clustered Target Annotations
| Code |
Organism Class |
Affinity (nM) |
LE (kcal/mol/atom) |
Type |
|
Z80418-2-O |
RAW264.7 (Monocytic-macrophage Leukemia Cells) (cluster #2 Of 9), Other |
Other |
240 |
0.55 |
Functional ≤ 10μM
|
|
Z80596-1-O |
WISH (Amniotic Epithelial Cells) (cluster #1 Of 1), Other |
Other |
3000 |
0.45 |
Functional ≤ 10μM
|
|
Z80418-1-O |
RAW264.7 (Monocytic-macrophage Leukemia Cells) (cluster #1 Of 2), Other |
Other |
7419 |
0.42 |
ADME/T ≤ 10μM
|
Physical Representations
|
Type
pH range
|
xlogP
|
Des A‑Pol
Apolar desolvation
(kcal/mol)
|
Des Pol
Polar desolvation
(kcal/mol)
|
H Don
H-bond donors
|
H Acc
H-bond acceptors
|
Chg
Net charge
|
tPSA
(Ų)
|
MWT
Molecular weight
(g/mol)
|
RB
Rotatable bonds
|
DL |
|
Ref
Reference (pH 7)
|
3.00 |
4.11 |
-10.63 |
2 |
4 |
0 |
67 |
236.267 |
6 |
↓
|
|
|
|
Analogs
-
7996909
-
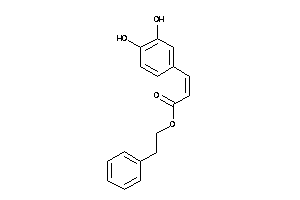
Draw
Identity
99%
90%
80%
70%
Vendors
And 22 More
Physical Representations
|
Type
pH range
|
xlogP
|
Des A‑Pol
Apolar desolvation
(kcal/mol)
|
Des Pol
Polar desolvation
(kcal/mol)
|
H Don
H-bond donors
|
H Acc
H-bond acceptors
|
Chg
Net charge
|
tPSA
(Ų)
|
MWT
Molecular weight
(g/mol)
|
RB
Rotatable bonds
|
DL |
|
Ref
Reference (pH 7)
|
3.36 |
6.23 |
-10.48 |
2 |
4 |
0 |
67 |
284.311 |
6 |
↓
|
|
|
|
Analogs
-
3874185
-
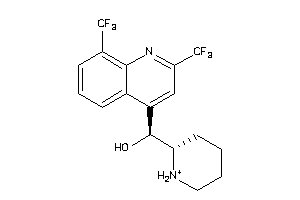
Draw
Identity
99%
90%
80%
70%
Vendors
And 6 More
Clustered Target Annotations
| Code |
Organism Class |
Affinity (nM) |
LE (kcal/mol/atom) |
Type |
|
AA1R-2-E |
Adenosine A1 Receptor (cluster #2 Of 4), Eukaryotic |
Eukaryotes |
1221 |
0.32 |
Binding ≤ 10μM
|
|
AA2AR-2-E |
Adenosine A2a Receptor (cluster #2 Of 4), Eukaryotic |
Eukaryotes |
124 |
0.37 |
Binding ≤ 10μM
|
|
KCNH2-5-E |
HERG (cluster #5 Of 5), Eukaryotic |
Eukaryotes |
5623 |
0.28 |
Binding ≤ 10μM
|
|
Z102013-2-O |
Plasmodium Malariae (cluster #2 Of 2), Other |
Other |
47 |
0.39 |
Functional ≤ 10μM
|
|
Z102015-1-O |
Plasmodium Vivax (cluster #1 Of 1), Other |
Other |
9 |
0.43 |
Functional ≤ 10μM
|
|
Z50417-3-O |
Leishmania Infantum (cluster #3 Of 4), Other |
Other |
7000 |
0.28 |
Functional ≤ 10μM
|
|
Z50425-3-O |
Plasmodium Falciparum (cluster #3 Of 22), Other |
Other |
91 |
0.38 |
Functional ≤ 10μM
|
|
Z50426-6-O |
Plasmodium Falciparum (isolate K1 / Thailand) (cluster #6 Of 9), Other |
Other |
8 |
0.44 |
Functional ≤ 10μM |
|
Z80211-1-O |
LoVo (Colon Adenocarcinoma Cells) (cluster #1 Of 5), Other |
Other |
7900 |
0.27 |
Functional ≤ 10μM |
|
Z80418-1-O |
RAW264.7 (Monocytic-macrophage Leukemia Cells) (cluster #1 Of 2), Other |
Other |
6500 |
0.28 |
ADME/T ≤ 10μM |
|
Z81135-3-O |
L6 (Skeletal Muscle Myoblast Cells) (cluster #3 Of 6), Other |
Other |
4760 |
0.29 |
ADME/T ≤ 10μM
|
Physical Representations
|
Type
pH range
|
xlogP
|
Des A‑Pol
Apolar desolvation
(kcal/mol)
|
Des Pol
Polar desolvation
(kcal/mol)
|
H Don
H-bond donors
|
H Acc
H-bond acceptors
|
Chg
Net charge
|
tPSA
(Ų)
|
MWT
Molecular weight
(g/mol)
|
RB
Rotatable bonds
|
DL |
|
Ref
Reference (pH 7)
|
4.24 |
6.7 |
-52.23 |
3 |
3 |
1 |
50 |
379.324 |
4 |
↓
|
|
|
|
Analogs
Draw
Identity
99%
90%
80%
70%
Vendors
And 20 More
Clustered Target Annotations
| Code |
Organism Class |
Affinity (nM) |
LE (kcal/mol/atom) |
Type |
|
AA2AR-2-E |
Adenosine A2a Receptor (cluster #2 Of 4), Eukaryotic |
Eukaryotes |
6553 |
0.28 |
Binding ≤ 10μM
|
|
KCNH2-5-E |
HERG (cluster #5 Of 5), Eukaryotic |
Eukaryotes |
5250 |
0.28 |
Binding ≤ 10μM
|
|
KCNH2-5-E |
HERG (cluster #5 Of 5), Eukaryotic |
Eukaryotes |
5623 |
0.28 |
Binding ≤ 10μM
|
|
Z102013-2-O |
Plasmodium Malariae (cluster #2 Of 2), Other |
Other |
47 |
0.39 |
Functional ≤ 10μM
|
|
Z102015-1-O |
Plasmodium Vivax (cluster #1 Of 1), Other |
Other |
9 |
0.43 |
Functional ≤ 10μM
|
|
Z50417-3-O |
Leishmania Infantum (cluster #3 Of 4), Other |
Other |
7000 |
0.28 |
Functional ≤ 10μM
|
|
Z50425-3-O |
Plasmodium Falciparum (cluster #3 Of 22), Other |
Other |
5 |
0.45 |
Functional ≤ 10μM
|
|
Z50425-3-O |
Plasmodium Falciparum (cluster #3 Of 22), Other |
Other |
91 |
0.38 |
Functional ≤ 10μM
|
|
Z50426-6-O |
Plasmodium Falciparum (isolate K1 / Thailand) (cluster #6 Of 9), Other |
Other |
8 |
0.44 |
Functional ≤ 10μM |
|
Z80211-1-O |
LoVo (Colon Adenocarcinoma Cells) (cluster #1 Of 5), Other |
Other |
7900 |
0.27 |
Functional ≤ 10μM |
|
Z80418-1-O |
RAW264.7 (Monocytic-macrophage Leukemia Cells) (cluster #1 Of 2), Other |
Other |
6500 |
0.28 |
ADME/T ≤ 10μM |
|
Z81135-3-O |
L6 (Skeletal Muscle Myoblast Cells) (cluster #3 Of 6), Other |
Other |
4760 |
0.29 |
ADME/T ≤ 10μM
|
Physical Representations
|
Type
pH range
|
xlogP
|
Des A‑Pol
Apolar desolvation
(kcal/mol)
|
Des Pol
Polar desolvation
(kcal/mol)
|
H Don
H-bond donors
|
H Acc
H-bond acceptors
|
Chg
Net charge
|
tPSA
(Ų)
|
MWT
Molecular weight
(g/mol)
|
RB
Rotatable bonds
|
DL |
|
Ref
Reference (pH 7)
|
4.24 |
6.35 |
-59.95 |
3 |
3 |
1 |
50 |
379.324 |
4 |
↓
|
|
Hi
High (pH 8-9.5)
|
4.24 |
5.78 |
-11.48 |
2 |
3 |
0 |
45 |
378.316 |
4 |
↓
|
|
|
|
Analogs
Draw
Identity
99%
90%
80%
70%
Vendors
And 11 More
Clustered Target Annotations
| Code |
Organism Class |
Affinity (nM) |
LE (kcal/mol/atom) |
Type |
|
AA1R-2-E |
Adenosine A1 Receptor (cluster #2 Of 4), Eukaryotic |
Eukaryotes |
255 |
0.36 |
Binding ≤ 10μM
|
|
AA2AR-2-E |
Adenosine A2a Receptor (cluster #2 Of 4), Eukaryotic |
Eukaryotes |
61 |
0.39 |
Binding ≤ 10μM
|
|
KCNH2-5-E |
HERG (cluster #5 Of 5), Eukaryotic |
Eukaryotes |
5623 |
0.28 |
Binding ≤ 10μM
|
|
Z102013-2-O |
Plasmodium Malariae (cluster #2 Of 2), Other |
Other |
47 |
0.39 |
Functional ≤ 10μM
|
|
Z102015-1-O |
Plasmodium Vivax (cluster #1 Of 1), Other |
Other |
9 |
0.43 |
Functional ≤ 10μM
|
|
Z50417-3-O |
Leishmania Infantum (cluster #3 Of 4), Other |
Other |
7000 |
0.28 |
Functional ≤ 10μM
|
|
Z50425-3-O |
Plasmodium Falciparum (cluster #3 Of 22), Other |
Other |
91 |
0.38 |
Functional ≤ 10μM
|
|
Z50426-6-O |
Plasmodium Falciparum (isolate K1 / Thailand) (cluster #6 Of 9), Other |
Other |
8 |
0.44 |
Functional ≤ 10μM |
|
Z80211-1-O |
LoVo (Colon Adenocarcinoma Cells) (cluster #1 Of 5), Other |
Other |
7900 |
0.27 |
Functional ≤ 10μM |
|
Z80418-1-O |
RAW264.7 (Monocytic-macrophage Leukemia Cells) (cluster #1 Of 2), Other |
Other |
6500 |
0.28 |
ADME/T ≤ 10μM |
|
Z81135-3-O |
L6 (Skeletal Muscle Myoblast Cells) (cluster #3 Of 6), Other |
Other |
4760 |
0.29 |
ADME/T ≤ 10μM
|
Physical Representations
|
Type
pH range
|
xlogP
|
Des A‑Pol
Apolar desolvation
(kcal/mol)
|
Des Pol
Polar desolvation
(kcal/mol)
|
H Don
H-bond donors
|
H Acc
H-bond acceptors
|
Chg
Net charge
|
tPSA
(Ų)
|
MWT
Molecular weight
(g/mol)
|
RB
Rotatable bonds
|
DL |
|
Ref
Reference (pH 7)
|
4.24 |
6.35 |
-59.95 |
3 |
3 |
1 |
50 |
379.324 |
4 |
↓
|
|
Hi
High (pH 8-9.5)
|
4.24 |
5.69 |
-9.16 |
2 |
3 |
0 |
45 |
378.316 |
4 |
↓
|
|
|
|
Analogs
-
537964
-
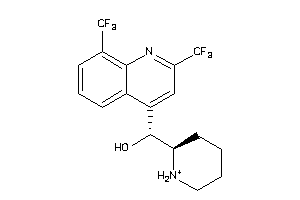
Draw
Identity
99%
90%
80%
70%
Vendors
And 3 More
Clustered Target Annotations
| Code |
Organism Class |
Affinity (nM) |
LE (kcal/mol/atom) |
Type |
|
AA1R-2-E |
Adenosine A1 Receptor (cluster #2 Of 4), Eukaryotic |
Eukaryotes |
8607 |
0.27 |
Binding ≤ 10μM
|
|
AA2AR-2-E |
Adenosine A2a Receptor (cluster #2 Of 4), Eukaryotic |
Eukaryotes |
2534 |
0.30 |
Binding ≤ 10μM
|
|
KCNH2-5-E |
HERG (cluster #5 Of 5), Eukaryotic |
Eukaryotes |
5623 |
0.28 |
Binding ≤ 10μM
|
|
Z102013-2-O |
Plasmodium Malariae (cluster #2 Of 2), Other |
Other |
47 |
0.39 |
Functional ≤ 10μM
|
|
Z102015-1-O |
Plasmodium Vivax (cluster #1 Of 1), Other |
Other |
9 |
0.43 |
Functional ≤ 10μM
|
|
Z50417-3-O |
Leishmania Infantum (cluster #3 Of 4), Other |
Other |
7000 |
0.28 |
Functional ≤ 10μM
|
|
Z50425-3-O |
Plasmodium Falciparum (cluster #3 Of 22), Other |
Other |
91 |
0.38 |
Functional ≤ 10μM
|
|
Z50426-6-O |
Plasmodium Falciparum (isolate K1 / Thailand) (cluster #6 Of 9), Other |
Other |
8 |
0.44 |
Functional ≤ 10μM |
|
Z80211-1-O |
LoVo (Colon Adenocarcinoma Cells) (cluster #1 Of 5), Other |
Other |
7900 |
0.27 |
Functional ≤ 10μM |
|
Z80418-1-O |
RAW264.7 (Monocytic-macrophage Leukemia Cells) (cluster #1 Of 2), Other |
Other |
6500 |
0.28 |
ADME/T ≤ 10μM |
|
Z81135-3-O |
L6 (Skeletal Muscle Myoblast Cells) (cluster #3 Of 6), Other |
Other |
4760 |
0.29 |
ADME/T ≤ 10μM
|
Physical Representations
|
Type
pH range
|
xlogP
|
Des A‑Pol
Apolar desolvation
(kcal/mol)
|
Des Pol
Polar desolvation
(kcal/mol)
|
H Don
H-bond donors
|
H Acc
H-bond acceptors
|
Chg
Net charge
|
tPSA
(Ų)
|
MWT
Molecular weight
(g/mol)
|
RB
Rotatable bonds
|
DL |
|
Ref
Reference (pH 7)
|
4.24 |
6.7 |
-52.4 |
3 |
3 |
1 |
50 |
379.324 |
4 |
↓
|
|
|
|
Analogs
Draw
Identity
99%
90%
80%
70%
Vendors
And 1 More
Clustered Target Annotations
| Code |
Organism Class |
Affinity (nM) |
LE (kcal/mol/atom) |
Type |
|
CCNB1-1-E |
G2/mitotic-specific Cyclin B1 (cluster #1 Of 2), Eukaryotic |
Eukaryotes |
35 |
0.47 |
Binding ≤ 10μM
|
|
CCNB2-1-E |
G2/mitotic-specific Cyclin B2 (cluster #1 Of 2), Eukaryotic |
Eukaryotes |
35 |
0.47 |
Binding ≤ 10μM
|
|
CCNB3-1-E |
G2/mitotic-specific Cyclin B3 (cluster #1 Of 2), Eukaryotic |
Eukaryotes |
35 |
0.47 |
Binding ≤ 10μM
|
|
CDK1-1-E |
Cyclin-dependent Kinase 1 (cluster #1 Of 4), Eukaryotic |
Eukaryotes |
35 |
0.47 |
Binding ≤ 10μM
|
|
CDK2-1-E |
Cyclin-dependent Kinase 2 (cluster #1 Of 5), Eukaryotic |
Eukaryotes |
15 |
0.50 |
Binding ≤ 10μM
|
|
CDK5-1-E |
Cyclin-dependent Kinase 5 (cluster #1 Of 1), Eukaryotic |
Eukaryotes |
40 |
0.47 |
Binding ≤ 10μM
|
|
GSK3A-1-E |
Glycogen Synthase Kinase-3 Alpha (cluster #1 Of 3), Eukaryotic |
Eukaryotes |
4 |
0.53 |
Binding ≤ 10μM
|
|
GSK3B-1-E |
Glycogen Synthase Kinase-3 Beta (cluster #1 Of 7), Eukaryotic |
Eukaryotes |
4 |
0.53 |
Binding ≤ 10μM
|
|
Z104294-1-O |
Cyclin-dependent Kinase 5/CDK5 Activator 1 (cluster #1 Of 2), Other |
Other |
40 |
0.47 |
Binding ≤ 10μM
|
|
Z50425-3-O |
Plasmodium Falciparum (cluster #3 Of 22), Other |
Other |
4300 |
0.34 |
Functional ≤ 10μM |
|
Z80125-1-O |
DU-145 (Prostate Carcinoma) (cluster #1 Of 9), Other |
Other |
1100 |
0.38 |
Functional ≤ 10μM |
|
Z80186-1-O |
K562 (Erythroleukemia Cells) (cluster #1 Of 11), Other |
Other |
1580 |
0.37 |
Functional ≤ 10μM
|
|
Z80211-1-O |
LoVo (Colon Adenocarcinoma Cells) (cluster #1 Of 5), Other |
Other |
1000 |
0.38 |
Functional ≤ 10μM |
|
Z80224-1-O |
MCF7 (Breast Carcinoma Cells) (cluster #1 Of 14), Other |
Other |
2700 |
0.35 |
Functional ≤ 10μM |
|
Z80390-1-O |
PC-3 (Prostate Carcinoma Cells) (cluster #1 Of 10), Other |
Other |
1120 |
0.38 |
Functional ≤ 10μM
|
|
Z80559-1-O |
U251 (cluster #1 Of 3), Other |
Other |
680 |
0.39 |
Functional ≤ 10μM
|
|
Z81335-1-O |
HCT-15 (Colon Adenocarcinoma Cells) (cluster #1 Of 5), Other |
Other |
620 |
0.40 |
Functional ≤ 10μM
|
|
Z80418-1-O |
RAW264.7 (Monocytic-macrophage Leukemia Cells) (cluster #1 Of 2), Other |
Other |
2200 |
0.36 |
ADME/T ≤ 10μM |
Physical Representations
|
Type
pH range
|
xlogP
|
Des A‑Pol
Apolar desolvation
(kcal/mol)
|
Des Pol
Polar desolvation
(kcal/mol)
|
H Don
H-bond donors
|
H Acc
H-bond acceptors
|
Chg
Net charge
|
tPSA
(Ų)
|
MWT
Molecular weight
(g/mol)
|
RB
Rotatable bonds
|
DL |
|
Ref
Reference (pH 7)
|
2.87 |
-0.89 |
-13.52 |
2 |
6 |
0 |
90 |
293.282 |
1 |
↓
|
|
|
|
Analogs
Draw
Identity
99%
90%
80%
70%
Vendors
And 3 More
Physical Representations
|
Type
pH range
|
xlogP
|
Des A‑Pol
Apolar desolvation
(kcal/mol)
|
Des Pol
Polar desolvation
(kcal/mol)
|
H Don
H-bond donors
|
H Acc
H-bond acceptors
|
Chg
Net charge
|
tPSA
(Ų)
|
MWT
Molecular weight
(g/mol)
|
RB
Rotatable bonds
|
DL |
|
Ref
Reference (pH 7)
|
0.71 |
2.16 |
-90.15 |
6 |
3 |
2 |
65 |
179.267 |
4 |
↓
|
|
|
|
Analogs
-
33799539
-
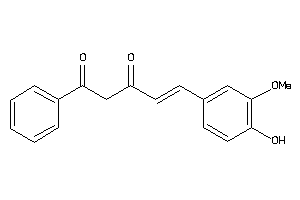
-
44608728
-
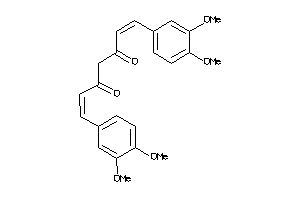
Draw
Identity
99%
90%
80%
70%
Vendors
And 53 More
Clustered Target Annotations
| Code |
Organism Class |
Affinity (nM) |
LE (kcal/mol/atom) |
Type |
|
MTSI-1-B |
CpG DNA Methylase (cluster #1 Of 2), Bacterial |
Bacteria |
30 |
0.39 |
Binding ≤ 10μM
|
|
A4-1-E |
Beta Amyloid A4 Protein (cluster #1 Of 5), Eukaryotic |
Eukaryotes |
800 |
0.32 |
Binding ≤ 10μM
|
|
CAH1-1-E |
Carbonic Anhydrase I (cluster #1 Of 12), Eukaryotic |
Eukaryotes |
2410 |
0.29 |
Binding ≤ 10μM
|
|
CAH12-2-E |
Carbonic Anhydrase XII (cluster #2 Of 9), Eukaryotic |
Eukaryotes |
3480 |
0.28 |
Binding ≤ 10μM
|
|
CAH13-1-E |
Carbonic Anhydrase XIII (cluster #1 Of 7), Eukaryotic |
Eukaryotes |
6850 |
0.27 |
Binding ≤ 10μM
|
|
CAH15-4-E |
Carbonic Anhydrase 15 (cluster #4 Of 6), Eukaryotic |
Eukaryotes |
5090 |
0.27 |
Binding ≤ 10μM
|
|
CAH2-1-E |
Carbonic Anhydrase II (cluster #1 Of 15), Eukaryotic |
Eukaryotes |
380 |
0.33 |
Binding ≤ 10μM
|
|
CAH4-3-E |
Carbonic Anhydrase IV (cluster #3 Of 16), Eukaryotic |
Eukaryotes |
4970 |
0.28 |
Binding ≤ 10μM
|
|
CAH5B-4-E |
Carbonic Anhydrase VB (cluster #4 Of 9), Eukaryotic |
Eukaryotes |
9460 |
0.26 |
Binding ≤ 10μM
|
|
CAH6-8-E |
Carbonic Anhydrase VI (cluster #8 Of 8), Eukaryotic |
Eukaryotes |
9940 |
0.26 |
Binding ≤ 10μM
|
|
CAH7-2-E |
Carbonic Anhydrase VII (cluster #2 Of 8), Eukaryotic |
Eukaryotes |
9300 |
0.26 |
Binding ≤ 10μM
|
|
CAH9-3-E |
Carbonic Anhydrase IX (cluster #3 Of 11), Eukaryotic |
Eukaryotes |
4050 |
0.28 |
Binding ≤ 10μM
|
|
DHB3-1-E |
Estradiol 17-beta-dehydrogenase 3 (cluster #1 Of 4), Eukaryotic |
Eukaryotes |
9000 |
0.26 |
Binding ≤ 10μM
|
|
KPCE-5-E |
Protein Kinase C Epsilon (cluster #5 Of 5), Eukaryotic |
Eukaryotes |
8810 |
0.26 |
Binding ≤ 10μM
|
|
LGUL-2-E |
Glyoxalase I (cluster #2 Of 2), Eukaryotic |
Eukaryotes |
10000 |
0.26 |
Binding ≤ 10μM
|
|
LOX5-4-E |
Arachidonate 5-lipoxygenase (cluster #4 Of 6), Eukaryotic |
Eukaryotes |
8000 |
0.26 |
Binding ≤ 10μM
|
|
MMP9-1-E |
Matrix Metalloproteinase 9 (cluster #1 Of 3), Eukaryotic |
Eukaryotes |
8500 |
0.26 |
Binding ≤ 10μM
|
|
NOS2-4-E |
Nitric Oxide Synthase, Inducible (cluster #4 Of 9), Eukaryotic |
Eukaryotes |
6000 |
0.27 |
Binding ≤ 10μM
|
|
PGH1-6-E |
Cyclooxygenase-1 (cluster #6 Of 6), Eukaryotic |
Eukaryotes |
8800 |
0.26 |
Binding ≤ 10μM
|
|
Q8HY88-1-E |
Potassium Channel Subfamily K Member 2 (cluster #1 Of 1), Eukaryotic |
Eukaryotes |
930 |
0.31 |
Binding ≤ 10μM
|
|
CP2C9-1-E |
Cytochrome P450 2C9 (cluster #1 Of 3), Eukaryotic |
Eukaryotes |
4300 |
0.28 |
ADME/T ≤ 10μM
|
|
Z103192-1-O |
Trypanosoma Evansi (cluster #1 Of 2), Other |
Other |
2000 |
0.30 |
Functional ≤ 10μM
|
|
Z50420-1-O |
Trypanosoma Brucei Brucei (cluster #1 Of 7), Other |
Other |
4800 |
0.28 |
Functional ≤ 10μM
|
|
Z50425-11-O |
Plasmodium Falciparum (cluster #11 Of 22), Other |
Other |
4210 |
0.28 |
Functional ≤ 10μM
|
|
Z50515-1-O |
Human Herpesvirus 2 (cluster #1 Of 2), Other |
Other |
10 |
0.41 |
Functional ≤ 10μM
|
|
Z50518-1-O |
Human Herpesvirus 4 (cluster #1 Of 5), Other |
Other |
10 |
0.41 |
Functional ≤ 10μM
|
|
Z50600-2-O |
Vaccinia Virus (cluster #2 Of 2), Other |
Other |
10 |
0.41 |
Functional ≤ 10μM
|
|
Z50602-1-O |
Human Herpesvirus 1 (cluster #1 Of 5), Other |
Other |
10 |
0.41 |
Functional ≤ 10μM
|
|
Z50607-3-O |
Human Immunodeficiency Virus 1 (cluster #3 Of 10), Other |
Other |
37 |
0.39 |
Functional ≤ 10μM
|
|
Z50651-2-O |
Vesicular Stomatitis Virus (cluster #2 Of 2), Other |
Other |
10 |
0.41 |
Functional ≤ 10μM
|
|
Z50658-4-O |
Human Immunodeficiency Virus 2 (cluster #4 Of 4), Other |
Other |
37 |
0.39 |
Functional ≤ 10μM
|
|
Z80186-2-O |
K562 (Erythroleukemia Cells) (cluster #2 Of 11), Other |
Other |
6810 |
0.27 |
Functional ≤ 10μM
|
|
Z80224-1-O |
MCF7 (Breast Carcinoma Cells) (cluster #1 Of 14), Other |
Other |
5580 |
0.27 |
Functional ≤ 10μM
|
|
Z80244-4-O |
MDA-MB-468 (Breast Adenocarcinoma) (cluster #4 Of 7), Other |
Other |
9700 |
0.26 |
Functional ≤ 10μM
|
|
Z80390-1-O |
PC-3 (Prostate Carcinoma Cells) (cluster #1 Of 10), Other |
Other |
7700 |
0.27 |
Functional ≤ 10μM
|
|
Z80418-2-O |
RAW264.7 (Monocytic-macrophage Leukemia Cells) (cluster #2 Of 9), Other |
Other |
8300 |
0.26 |
Functional ≤ 10μM
|
|
Z80548-3-O |
THP-1 (Acute Monocytic Leukemia Cells) (cluster #3 Of 5), Other |
Other |
1210 |
0.31 |
Functional ≤ 10μM |
|
Z80612-1-O |
2008 (Ovarian Carcinoma Cells) (cluster #1 Of 2), Other |
Other |
5000 |
0.27 |
Functional ≤ 10μM
|
|
Z81170-1-O |
LNCaP (Prostate Carcinoma) (cluster #1 Of 5), Other |
Other |
8500 |
0.26 |
Functional ≤ 10μM
|
|
Z81186-1-O |
LS174T (Colon Adencocarcinoma Cells) (cluster #1 Of 2), Other |
Other |
6500 |
0.27 |
Functional ≤ 10μM
|
|
Z81252-1-O |
MDA-MB-231 (Breast Adenocarcinoma Cells) (cluster #1 Of 11), Other |
Other |
7600 |
0.27 |
Functional ≤ 10μM
|
|
Z80193-1-O |
L1210 (Lymphocytic Leukemia Cells) (cluster #1 Of 4), Other |
Other |
9000 |
0.26 |
ADME/T ≤ 10μM
|
|
Z80874-1-O |
CEM (T-cell Leukemia) (cluster #1 Of 4), Other |
Other |
8700 |
0.26 |
ADME/T ≤ 10μM
|
Physical Representations
|
Type
pH range
|
xlogP
|
Des A‑Pol
Apolar desolvation
(kcal/mol)
|
Des Pol
Polar desolvation
(kcal/mol)
|
H Don
H-bond donors
|
H Acc
H-bond acceptors
|
Chg
Net charge
|
tPSA
(Ų)
|
MWT
Molecular weight
(g/mol)
|
RB
Rotatable bonds
|
DL |
|
Ref
Reference (pH 7)
|
2.30 |
7.14 |
-22.28 |
2 |
6 |
0 |
93 |
368.385 |
8 |
↓
|
|
Hi
High (pH 8-9.5)
|
3.05 |
5.47 |
-58.07 |
2 |
6 |
-1 |
99 |
367.377 |
7 |
↓
|
|
|
|
Analogs
Draw
Identity
99%
90%
80%
70%
Vendors
Clustered Target Annotations
| Code |
Organism Class |
Affinity (nM) |
LE (kcal/mol/atom) |
Type |
|
Z80418-3-O |
RAW264.7 (Monocytic-macrophage Leukemia Cells) (cluster #3 Of 9), Other |
Other |
100 |
0.54 |
Functional ≤ 10μM
|
Physical Representations
|
Type
pH range
|
xlogP
|
Des A‑Pol
Apolar desolvation
(kcal/mol)
|
Des Pol
Polar desolvation
(kcal/mol)
|
H Don
H-bond donors
|
H Acc
H-bond acceptors
|
Chg
Net charge
|
tPSA
(Ų)
|
MWT
Molecular weight
(g/mol)
|
RB
Rotatable bonds
|
DL |
|
Ref
Reference (pH 7)
|
1.47 |
5.22 |
-8.91 |
1 |
3 |
0 |
47 |
250.338 |
0 |
↓
|
|
|
|
|
|
|
|
|
|
Analogs
Draw
Identity
99%
90%
80%
70%
Vendors
Clustered Target Annotations
| Code |
Organism Class |
Affinity (nM) |
LE (kcal/mol/atom) |
Type |
|
Z80418-3-O |
RAW264.7 (Monocytic-macrophage Leukemia Cells) (cluster #3 Of 9), Other |
Other |
5000 |
0.31 |
Functional ≤ 10μM
|
Physical Representations
|
Type
pH range
|
xlogP
|
Des A‑Pol
Apolar desolvation
(kcal/mol)
|
Des Pol
Polar desolvation
(kcal/mol)
|
H Don
H-bond donors
|
H Acc
H-bond acceptors
|
Chg
Net charge
|
tPSA
(Ų)
|
MWT
Molecular weight
(g/mol)
|
RB
Rotatable bonds
|
DL |
|
Ref
Reference (pH 7)
|
5.05 |
2.46 |
-4.76 |
1 |
3 |
0 |
46 |
338.532 |
6 |
↓
|
|
|
|
Analogs
Draw
Identity
99%
90%
80%
70%
Vendors
Clustered Target Annotations
| Code |
Organism Class |
Affinity (nM) |
LE (kcal/mol/atom) |
Type |
|
Z80418-2-O |
RAW264.7 (Monocytic-macrophage Leukemia Cells) (cluster #2 Of 9), Other |
Other |
1800 |
0.42 |
Functional ≤ 10μM |
Physical Representations
|
Type
pH range
|
xlogP
|
Des A‑Pol
Apolar desolvation
(kcal/mol)
|
Des Pol
Polar desolvation
(kcal/mol)
|
H Don
H-bond donors
|
H Acc
H-bond acceptors
|
Chg
Net charge
|
tPSA
(Ų)
|
MWT
Molecular weight
(g/mol)
|
RB
Rotatable bonds
|
DL |
|
Ref
Reference (pH 7)
|
2.67 |
2.85 |
-9.68 |
2 |
4 |
0 |
71 |
254.241 |
1 |
↓
|
|
Hi
High (pH 8-9.5)
|
2.67 |
3.62 |
-41.89 |
1 |
4 |
-1 |
73 |
253.233 |
1 |
↓
|
|
|
|
|
|
|
Analogs
-
15446576
-
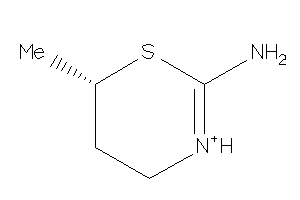
Draw
Identity
99%
90%
80%
70%
Vendors
And 2 More
Clustered Target Annotations
| Code |
Organism Class |
Affinity (nM) |
LE (kcal/mol/atom) |
Type |
|
Z80418-4-O |
RAW264.7 (Monocytic-macrophage Leukemia Cells) (cluster #4 Of 9), Other |
Other |
22 |
1.34 |
Functional ≤ 10μM
|
Physical Representations
|
Type
pH range
|
xlogP
|
Des A‑Pol
Apolar desolvation
(kcal/mol)
|
Des Pol
Polar desolvation
(kcal/mol)
|
H Don
H-bond donors
|
H Acc
H-bond acceptors
|
Chg
Net charge
|
tPSA
(Ų)
|
MWT
Molecular weight
(g/mol)
|
RB
Rotatable bonds
|
DL |
|
Ref
Reference (pH 7)
|
0.65 |
1.94 |
-26.22 |
3 |
2 |
1 |
40 |
131.224 |
0 |
↓
|
|
|
|
Analogs
-
15446575
-
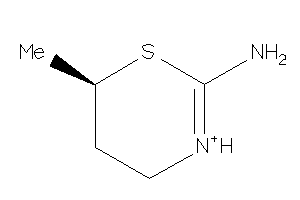
Draw
Identity
99%
90%
80%
70%
Vendors
And 2 More
Clustered Target Annotations
| Code |
Organism Class |
Affinity (nM) |
LE (kcal/mol/atom) |
Type |
|
Z80418-4-O |
RAW264.7 (Monocytic-macrophage Leukemia Cells) (cluster #4 Of 9), Other |
Other |
22 |
1.34 |
Functional ≤ 10μM
|
Physical Representations
|
Type
pH range
|
xlogP
|
Des A‑Pol
Apolar desolvation
(kcal/mol)
|
Des Pol
Polar desolvation
(kcal/mol)
|
H Don
H-bond donors
|
H Acc
H-bond acceptors
|
Chg
Net charge
|
tPSA
(Ų)
|
MWT
Molecular weight
(g/mol)
|
RB
Rotatable bonds
|
DL |
|
Ref
Reference (pH 7)
|
0.65 |
1.94 |
-26.23 |
3 |
2 |
1 |
40 |
131.224 |
0 |
↓
|
|
|
|
Analogs
Draw
Identity
99%
90%
80%
70%
Vendors
Clustered Target Annotations
| Code |
Organism Class |
Affinity (nM) |
LE (kcal/mol/atom) |
Type |
|
Z80418-9-O |
RAW264.7 (Monocytic-macrophage Leukemia Cells) (cluster #9 Of 9), Other |
Other |
5580 |
0.33 |
Functional ≤ 10μM |
Physical Representations
|
Type
pH range
|
xlogP
|
Des A‑Pol
Apolar desolvation
(kcal/mol)
|
Des Pol
Polar desolvation
(kcal/mol)
|
H Don
H-bond donors
|
H Acc
H-bond acceptors
|
Chg
Net charge
|
tPSA
(Ų)
|
MWT
Molecular weight
(g/mol)
|
RB
Rotatable bonds
|
DL |
|
Ref
Reference (pH 7)
|
3.94 |
7.09 |
-10.08 |
2 |
3 |
0 |
58 |
298.382 |
8 |
↓
|
|
|
|
Analogs
Draw
Identity
99%
90%
80%
70%
Vendors
Clustered Target Annotations
| Code |
Organism Class |
Affinity (nM) |
LE (kcal/mol/atom) |
Type |
|
Z80418-1-O |
RAW264.7 (Monocytic-macrophage Leukemia Cells) (cluster #1 Of 9), Other |
Other |
9830 |
0.32 |
Functional ≤ 10μM |
Physical Representations
|
Type
pH range
|
xlogP
|
Des A‑Pol
Apolar desolvation
(kcal/mol)
|
Des Pol
Polar desolvation
(kcal/mol)
|
H Don
H-bond donors
|
H Acc
H-bond acceptors
|
Chg
Net charge
|
tPSA
(Ų)
|
MWT
Molecular weight
(g/mol)
|
RB
Rotatable bonds
|
DL |
|
Ref
Reference (pH 7)
|
4.16 |
4.44 |
-13.44 |
3 |
3 |
0 |
61 |
298.382 |
7 |
↓
|
|
|
|
Analogs
Draw
Identity
99%
90%
80%
70%
Vendors
Physical Representations
|
Type
pH range
|
xlogP
|
Des A‑Pol
Apolar desolvation
(kcal/mol)
|
Des Pol
Polar desolvation
(kcal/mol)
|
H Don
H-bond donors
|
H Acc
H-bond acceptors
|
Chg
Net charge
|
tPSA
(Ų)
|
MWT
Molecular weight
(g/mol)
|
RB
Rotatable bonds
|
DL |
|
Ref
Reference (pH 7)
|
3.15 |
-0.78 |
-10.13 |
2 |
4 |
0 |
66 |
270.284 |
5 |
↓
|
|
|
|
Analogs
Draw
Identity
99%
90%
80%
70%
Vendors
And 49 More
Clustered Target Annotations
| Code |
Organism Class |
Affinity (nM) |
LE (kcal/mol/atom) |
Type |
|
FABI-1-B |
Enoyl-[acyl-carrier-protein] Reductase (cluster #1 Of 2), Bacterial |
Bacteria |
7050 |
0.34 |
Binding ≤ 10μM
|
|
NANH-1-B |
Sialidase (cluster #1 Of 1), Bacterial |
Bacteria |
4300 |
0.36 |
Binding ≤ 10μM
|
|
AA1R-2-E |
Adenosine A1 Receptor (cluster #2 Of 4), Eukaryotic |
Eukaryotes |
1660 |
0.39 |
Binding ≤ 10μM
|
|
ABCG2-1-E |
ATP-binding Cassette Sub-family G Member 2 (cluster #1 Of 2), Eukaryotic |
Eukaryotes |
8900 |
0.34 |
Binding ≤ 10μM
|
|
ALDR-1-E |
Aldose Reductase (cluster #1 Of 5), Eukaryotic |
Eukaryotes |
9570 |
0.33 |
Binding ≤ 10μM
|
|
AOFA-4-E |
Monoamine Oxidase A (cluster #4 Of 8), Eukaryotic |
Eukaryotes |
4900 |
0.35 |
Binding ≤ 10μM
|
|
CCNB1-1-E |
G2/mitotic-specific Cyclin B1 (cluster #1 Of 2), Eukaryotic |
Eukaryotes |
6200 |
0.35 |
Binding ≤ 10μM
|
|
CCNB2-1-E |
G2/mitotic-specific Cyclin B2 (cluster #1 Of 2), Eukaryotic |
Eukaryotes |
6200 |
0.35 |
Binding ≤ 10μM
|
|
CCNB3-1-E |
G2/mitotic-specific Cyclin B3 (cluster #1 Of 2), Eukaryotic |
Eukaryotes |
6200 |
0.35 |
Binding ≤ 10μM
|
|
CD38-1-E |
Lymphocyte Differentiation Antigen CD38 (cluster #1 Of 1), Eukaryotic |
Eukaryotes |
8200 |
0.34 |
Binding ≤ 10μM |
|
CDK1-1-E |
Cyclin-dependent Kinase 1 (cluster #1 Of 4), Eukaryotic |
Eukaryotes |
6200 |
0.35 |
Binding ≤ 10μM
|
|
CP1B1-1-E |
Cytochrome P450 1B1 (cluster #1 Of 1), Eukaryotic |
Eukaryotes |
79 |
0.47 |
Binding ≤ 10μM
|
|
GSK3A-1-E |
Glycogen Synthase Kinase-3 Alpha (cluster #1 Of 3), Eukaryotic |
Eukaryotes |
800 |
0.41 |
Binding ≤ 10μM
|
|
GSK3B-7-E |
Glycogen Synthase Kinase-3 Beta (cluster #7 Of 7), Eukaryotic |
Eukaryotes |
800 |
0.41 |
Binding ≤ 10μM
|
|
LGUL-2-E |
Glyoxalase I (cluster #2 Of 2), Eukaryotic |
Eukaryotes |
7700 |
0.34 |
Binding ≤ 10μM
|
|
LOX1-1-E |
Seed Lipoxygenase-1 (cluster #1 Of 3), Eukaryotic |
Eukaryotes |
3200 |
0.37 |
Binding ≤ 10μM
|
|
NOX4-1-E |
NADPH Oxidase 4 (cluster #1 Of 1), Eukaryotic |
Eukaryotes |
850 |
0.40 |
Binding ≤ 10μM
|
|
Q965D5-1-E |
Enoyl-acyl-carrier Protein Reductase (cluster #1 Of 1), Eukaryotic |
Eukaryotes |
2100 |
0.38 |
Binding ≤ 10μM
|
|
Q965D6-1-E |
3-oxoacyl-acyl-carrier Protein Reductase (cluster #1 Of 2), Eukaryotic |
Eukaryotes |
800 |
0.41 |
Binding ≤ 10μM
|
|
Q965D7-2-E |
Fatty Acid Synthase (cluster #2 Of 2), Eukaryotic |
Eukaryotes |
5000 |
0.35 |
Binding ≤ 10μM
|
|
TOP1-1-E |
DNA Topoisomerase 1 (cluster #1 Of 2), Eukaryotic |
Eukaryotes |
660 |
0.41 |
Binding ≤ 10μM
|
|
XDH-2-E |
Xanthine Dehydrogenase (cluster #2 Of 2), Eukaryotic |
Eukaryotes |
1900 |
0.38 |
Binding ≤ 10μM
|
|
SC6A3-1-E |
Dopamine Transporter (cluster #1 Of 1), Eukaryotic |
Eukaryotes |
1450 |
0.39 |
Functional ≤ 10μM
|
|
CP1A1-1-E |
Cytochrome P450 1A1 (cluster #1 Of 3), Eukaryotic |
Eukaryotes |
890 |
0.40 |
ADME/T ≤ 10μM
|
|
CP1A2-1-E |
Cytochrome P450 1A2 (cluster #1 Of 3), Eukaryotic |
Eukaryotes |
3370 |
0.36 |
ADME/T ≤ 10μM
|
|
CP1B1-1-E |
Cytochrome P450 1B1 (cluster #1 Of 3), Eukaryotic |
Eukaryotes |
56 |
0.48 |
ADME/T ≤ 10μM
|
|
Z104294-2-O |
Cyclin-dependent Kinase 5/CDK5 Activator 1 (cluster #2 Of 2), Other |
Other |
3800 |
0.36 |
Binding ≤ 10μM
|
|
Z50425-11-O |
Plasmodium Falciparum (cluster #11 Of 22), Other |
Other |
9600 |
0.33 |
Functional ≤ 10μM
|
|
Z50607-4-O |
Human Immunodeficiency Virus 1 (cluster #4 Of 10), Other |
Other |
10000 |
0.33 |
Functional ≤ 10μM |
|
Z50652-3-O |
Influenza A Virus (cluster #3 Of 4), Other |
Other |
6820 |
0.34 |
Functional ≤ 10μM
|
|
Z80150-2-O |
H9c2 (Cardiomyoblast Cells) (cluster #2 Of 2), Other |
Other |
5530 |
0.35 |
Functional ≤ 10μM
|
|
Z80418-2-O |
RAW264.7 (Monocytic-macrophage Leukemia Cells) (cluster #2 Of 9), Other |
Other |
7500 |
0.34 |
Functional ≤ 10μM
|
|
Z80420-1-O |
RBL-2H3 (Basophilic Leukemia Cells) (cluster #1 Of 2), Other |
Other |
5800 |
0.35 |
Functional ≤ 10μM
|
Physical Representations
|
Type
pH range
|
xlogP
|
Des A‑Pol
Apolar desolvation
(kcal/mol)
|
Des Pol
Polar desolvation
(kcal/mol)
|
H Don
H-bond donors
|
H Acc
H-bond acceptors
|
Chg
Net charge
|
tPSA
(Ų)
|
MWT
Molecular weight
(g/mol)
|
RB
Rotatable bonds
|
DL |
|
Ref
Reference (pH 7)
|
1.97 |
-0.94 |
-14.61 |
4 |
6 |
0 |
111 |
286.239 |
1 |
↓
|
|
|
|
Analogs
Draw
Identity
99%
90%
80%
70%
Vendors
And 11 More
Physical Representations
|
Type
pH range
|
xlogP
|
Des A‑Pol
Apolar desolvation
(kcal/mol)
|
Des Pol
Polar desolvation
(kcal/mol)
|
H Don
H-bond donors
|
H Acc
H-bond acceptors
|
Chg
Net charge
|
tPSA
(Ų)
|
MWT
Molecular weight
(g/mol)
|
RB
Rotatable bonds
|
DL |
|
Ref
Reference (pH 7)
|
2.96 |
-0.37 |
-11.78 |
2 |
5 |
0 |
79 |
284.267 |
2 |
↓
|
|
|
|
Analogs
Draw
Identity
99%
90%
80%
70%
Vendors
And 2 More
Clustered Target Annotations
| Code |
Organism Class |
Affinity (nM) |
LE (kcal/mol/atom) |
Type |
|
Z80418-9-O |
RAW264.7 (Monocytic-macrophage Leukemia Cells) (cluster #9 Of 9), Other |
Other |
1070 |
0.28 |
Functional ≤ 10μM
|
Physical Representations
|
Type
pH range
|
xlogP
|
Des A‑Pol
Apolar desolvation
(kcal/mol)
|
Des Pol
Polar desolvation
(kcal/mol)
|
H Don
H-bond donors
|
H Acc
H-bond acceptors
|
Chg
Net charge
|
tPSA
(Ų)
|
MWT
Molecular weight
(g/mol)
|
RB
Rotatable bonds
|
DL |
|
Ref
Reference (pH 7)
|
6.17 |
15.79 |
-47.75 |
1 |
3 |
0 |
25 |
403.59 |
8 |
↓
|
|
Hi
High (pH 8-9.5)
|
6.17 |
15.68 |
-10.3 |
0 |
3 |
0 |
24 |
402.582 |
8 |
↓
|
|
Mid
Mid (pH 6-8)
|
6.17 |
16 |
-121.42 |
2 |
3 |
0 |
26 |
404.598 |
8 |
↓
|
|
|
|
Analogs
-
12353732
-
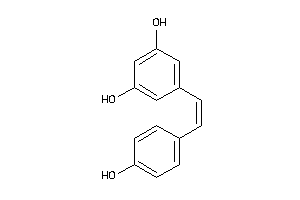
Draw
Identity
99%
90%
80%
70%
Vendors
And 55 More
Clustered Target Annotations
| Code |
Organism Class |
Affinity (nM) |
LE (kcal/mol/atom) |
Type |
|
AHR-1-E |
Aryl Hydrocarbon Receptor (cluster #1 Of 1), Eukaryotic |
Eukaryotes |
169 |
0.56 |
Binding ≤ 10μM
|
|
CAH1-4-E |
Carbonic Anhydrase I (cluster #4 Of 12), Eukaryotic |
Eukaryotes |
2210 |
0.47 |
Binding ≤ 10μM
|
|
CAH12-2-E |
Carbonic Anhydrase XII (cluster #2 Of 9), Eukaryotic |
Eukaryotes |
950 |
0.50 |
Binding ≤ 10μM
|
|
CAH13-7-E |
Carbonic Anhydrase XIII (cluster #7 Of 7), Eukaryotic |
Eukaryotes |
4090 |
0.44 |
Binding ≤ 10μM
|
|
CAH14-4-E |
Carbonic Anhydrase XIV (cluster #4 Of 8), Eukaryotic |
Eukaryotes |
830 |
0.50 |
Binding ≤ 10μM
|
|
CAH15-1-E |
Carbonic Anhydrase 15 (cluster #1 Of 6), Eukaryotic |
Eukaryotes |
9360 |
0.41 |
Binding ≤ 10μM
|
|
CAH2-5-E |
Carbonic Anhydrase II (cluster #5 Of 15), Eukaryotic |
Eukaryotes |
2770 |
0.46 |
Binding ≤ 10μM
|
|
CAH3-1-E |
Carbonic Anhydrase III (cluster #1 Of 6), Eukaryotic |
Eukaryotes |
9090 |
0.42 |
Binding ≤ 10μM
|
|
CAH4-3-E |
Carbonic Anhydrase IV (cluster #3 Of 16), Eukaryotic |
Eukaryotes |
4470 |
0.44 |
Binding ≤ 10μM
|
|
CAH5A-8-E |
Carbonic Anhydrase VA (cluster #8 Of 10), Eukaryotic |
Eukaryotes |
4750 |
0.44 |
Binding ≤ 10μM
|
|
CAH5B-4-E |
Carbonic Anhydrase VB (cluster #4 Of 9), Eukaryotic |
Eukaryotes |
4640 |
0.44 |
Binding ≤ 10μM
|
|
CAH6-2-E |
Carbonic Anhydrase VI (cluster #2 Of 8), Eukaryotic |
Eukaryotes |
8070 |
0.42 |
Binding ≤ 10μM
|
|
CAH7-2-E |
Carbonic Anhydrase VII (cluster #2 Of 8), Eukaryotic |
Eukaryotes |
4350 |
0.44 |
Binding ≤ 10μM
|
|
CAH9-3-E |
Carbonic Anhydrase IX (cluster #3 Of 11), Eukaryotic |
Eukaryotes |
810 |
0.50 |
Binding ≤ 10μM
|
|
ESR1-5-E |
Estrogen Receptor Alpha (cluster #5 Of 5), Eukaryotic |
Eukaryotes |
785 |
0.50 |
Binding ≤ 10μM
|
|
NQO2-4-E |
Quinone Reductase 2 (cluster #4 Of 4), Eukaryotic |
Eukaryotes |
960 |
0.50 |
Binding ≤ 10μM
|
|
PGH1-2-E |
Cyclooxygenase-1 (cluster #2 Of 6), Eukaryotic |
Eukaryotes |
830 |
0.50 |
Binding ≤ 10μM
|
|
PGH2-1-E |
Cyclooxygenase-2 (cluster #1 Of 8), Eukaryotic |
Eukaryotes |
3490 |
0.45 |
Binding ≤ 10μM
|
|
PGH1-1-E |
Cyclooxygenase-1 (cluster #1 Of 2), Eukaryotic |
Eukaryotes |
2840 |
0.46 |
Functional ≤ 10μM
|
|
Z102306-4-O |
Aorta (cluster #4 Of 6), Other |
Other |
6918 |
0.42 |
Functional ≤ 10μM
|
|
Z80156-1-O |
HL-60 (Promyeloblast Leukemia Cells) (cluster #1 Of 12), Other |
Other |
5000 |
0.44 |
Functional ≤ 10μM
|
|
Z80224-12-O |
MCF7 (Breast Carcinoma Cells) (cluster #12 Of 14), Other |
Other |
0 |
0.00 |
Functional ≤ 10μM |
|
Z80418-1-O |
RAW264.7 (Monocytic-macrophage Leukemia Cells) (cluster #1 Of 9), Other |
Other |
4000 |
0.44 |
Functional ≤ 10μM
|
|
Z80492-2-O |
SK-N-SH (Neuroblastoma Cells) (cluster #2 Of 2), Other |
Other |
0 |
0.00 |
Functional ≤ 10μM |
|
Z80682-7-O |
A549 (Lung Carcinoma Cells) (cluster #7 Of 11), Other |
Other |
0 |
0.00 |
Functional ≤ 10μM |
|
Z81247-2-O |
HeLa (Cervical Adenocarcinoma Cells) (cluster #2 Of 9), Other |
Other |
0 |
0.00 |
Functional ≤ 10μM |
Physical Representations
|
Type
pH range
|
xlogP
|
Des A‑Pol
Apolar desolvation
(kcal/mol)
|
Des Pol
Polar desolvation
(kcal/mol)
|
H Don
H-bond donors
|
H Acc
H-bond acceptors
|
Chg
Net charge
|
tPSA
(Ų)
|
MWT
Molecular weight
(g/mol)
|
RB
Rotatable bonds
|
DL |
|
Ref
Reference (pH 7)
|
2.99 |
0.79 |
-8.46 |
3 |
3 |
0 |
61 |
228.247 |
2 |
↓
|
|
|
|
Analogs
Draw
Identity
99%
90%
80%
70%
Vendors
And 27 More
Clustered Target Annotations
| Code |
Organism Class |
Affinity (nM) |
LE (kcal/mol/atom) |
Type |
|
Z80156-1-O |
HL-60 (Promyeloblast Leukemia Cells) (cluster #1 Of 12), Other |
Other |
7500 |
0.51 |
Functional ≤ 10μM
|
|
Z80211-2-O |
LoVo (Colon Adenocarcinoma Cells) (cluster #2 Of 5), Other |
Other |
5800 |
0.52 |
Functional ≤ 10μM
|
|
Z80418-1-O |
RAW264.7 (Monocytic-macrophage Leukemia Cells) (cluster #1 Of 9), Other |
Other |
3199 |
0.55 |
Functional ≤ 10μM
|
Physical Representations
|
Type
pH range
|
xlogP
|
Des A‑Pol
Apolar desolvation
(kcal/mol)
|
Des Pol
Polar desolvation
(kcal/mol)
|
H Don
H-bond donors
|
H Acc
H-bond acceptors
|
Chg
Net charge
|
tPSA
(Ų)
|
MWT
Molecular weight
(g/mol)
|
RB
Rotatable bonds
|
DL |
|
Ref
Reference (pH 7)
|
1.56 |
1.48 |
-8.47 |
2 |
4 |
0 |
67 |
194.186 |
3 |
↓
|
|
|
|
Analogs
Draw
Identity
99%
90%
80%
70%
Vendors
Clustered Target Annotations
| Code |
Organism Class |
Affinity (nM) |
LE (kcal/mol/atom) |
Type |
|
Z50594-7-O |
Mus Musculus (cluster #7 Of 9), Other |
Other |
0 |
0.00 |
Functional ≤ 10μM
|
|
Z80418-3-O |
RAW264.7 (Monocytic-macrophage Leukemia Cells) (cluster #3 Of 9), Other |
Other |
1 |
0.32 |
Functional ≤ 10μM
|
Physical Representations
|
Type
pH range
|
xlogP
|
Des A‑Pol
Apolar desolvation
(kcal/mol)
|
Des Pol
Polar desolvation
(kcal/mol)
|
H Don
H-bond donors
|
H Acc
H-bond acceptors
|
Chg
Net charge
|
tPSA
(Ų)
|
MWT
Molecular weight
(g/mol)
|
RB
Rotatable bonds
|
DL |
|
Ref
Reference (pH 7)
|
5.45 |
14.73 |
-21.64 |
0 |
6 |
0 |
93 |
541.736 |
1 |
↓
|
|
Mid
Mid (pH 6-8)
|
5.45 |
6.83 |
-63.4 |
1 |
6 |
1 |
94 |
542.744 |
1 |
↓
|
|
|
|
Analogs
Draw
Identity
99%
90%
80%
70%
Vendors
And 18 More
Clustered Target Annotations
| Code |
Organism Class |
Affinity (nM) |
LE (kcal/mol/atom) |
Type |
|
LOX5-4-E |
Arachidonate 5-lipoxygenase (cluster #4 Of 6), Eukaryotic |
Eukaryotes |
1150 |
0.55 |
Binding ≤ 10μM |
|
Z80418-2-O |
RAW264.7 (Monocytic-macrophage Leukemia Cells) (cluster #2 Of 9), Other |
Other |
3183 |
0.51 |
Functional ≤ 10μM
|
Physical Representations
|
Type
pH range
|
xlogP
|
Des A‑Pol
Apolar desolvation
(kcal/mol)
|
Des Pol
Polar desolvation
(kcal/mol)
|
H Don
H-bond donors
|
H Acc
H-bond acceptors
|
Chg
Net charge
|
tPSA
(Ų)
|
MWT
Molecular weight
(g/mol)
|
RB
Rotatable bonds
|
DL |
|
Ref
Reference (pH 7)
|
1.93 |
2.41 |
-8.28 |
2 |
4 |
0 |
67 |
208.213 |
4 |
↓
|
|
|
|
Analogs
-
33845151
-
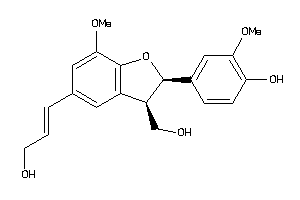
Draw
Identity
99%
90%
80%
70%
Vendors
Clustered Target Annotations
| Code |
Organism Class |
Affinity (nM) |
LE (kcal/mol/atom) |
Type |
|
Z80418-2-O |
RAW264.7 (Monocytic-macrophage Leukemia Cells) (cluster #2 Of 9), Other |
Other |
8500 |
0.27 |
Functional ≤ 10μM
|
Physical Representations
|
Type
pH range
|
xlogP
|
Des A‑Pol
Apolar desolvation
(kcal/mol)
|
Des Pol
Polar desolvation
(kcal/mol)
|
H Don
H-bond donors
|
H Acc
H-bond acceptors
|
Chg
Net charge
|
tPSA
(Ų)
|
MWT
Molecular weight
(g/mol)
|
RB
Rotatable bonds
|
DL |
|
Ref
Reference (pH 7)
|
1.92 |
-5.3 |
-13.93 |
3 |
6 |
0 |
88 |
358.39 |
6 |
↓
|
|
|
|
Analogs
-
490673
-
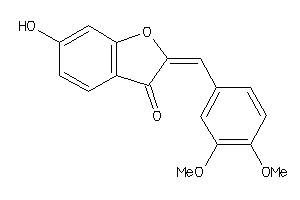
-
10215935
-
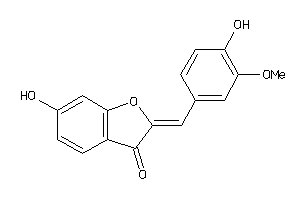
Draw
Identity
99%
90%
80%
70%
Vendors
And 18 More
Clustered Target Annotations
| Code |
Organism Class |
Affinity (nM) |
LE (kcal/mol/atom) |
Type |
|
Z80418-2-O |
RAW264.7 (Monocytic-macrophage Leukemia Cells) (cluster #2 Of 9), Other |
Other |
2900 |
0.35 |
Functional ≤ 10μM |
Physical Representations
|
Type
pH range
|
xlogP
|
Des A‑Pol
Apolar desolvation
(kcal/mol)
|
Des Pol
Polar desolvation
(kcal/mol)
|
H Don
H-bond donors
|
H Acc
H-bond acceptors
|
Chg
Net charge
|
tPSA
(Ų)
|
MWT
Molecular weight
(g/mol)
|
RB
Rotatable bonds
|
DL |
|
Ref
Reference (pH 7)
|
2.38 |
4.83 |
-11.28 |
1 |
5 |
0 |
69 |
298.294 |
3 |
↓
|
|
|
|
Analogs
-
32267239
-
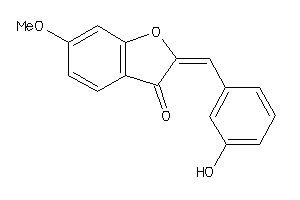
-
5906398
-
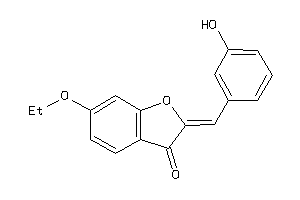
Draw
Identity
99%
90%
80%
70%
Vendors
Clustered Target Annotations
| Code |
Organism Class |
Affinity (nM) |
LE (kcal/mol/atom) |
Type |
|
Z80418-2-O |
RAW264.7 (Monocytic-macrophage Leukemia Cells) (cluster #2 Of 9), Other |
Other |
1670 |
0.37 |
Functional ≤ 10μM |
Physical Representations
|
Type
pH range
|
xlogP
|
Des A‑Pol
Apolar desolvation
(kcal/mol)
|
Des Pol
Polar desolvation
(kcal/mol)
|
H Don
H-bond donors
|
H Acc
H-bond acceptors
|
Chg
Net charge
|
tPSA
(Ų)
|
MWT
Molecular weight
(g/mol)
|
RB
Rotatable bonds
|
DL |
|
Ref
Reference (pH 7)
|
2.77 |
4.22 |
-12.96 |
1 |
5 |
0 |
69 |
298.294 |
3 |
↓
|
|
Mid
Mid (pH 6-8)
|
2.77 |
5.02 |
-44.68 |
0 |
5 |
-1 |
72 |
297.286 |
3 |
↓
|
|
|
|
Analogs
Draw
Identity
99%
90%
80%
70%
Vendors
And 7 More
Clustered Target Annotations
| Code |
Organism Class |
Affinity (nM) |
LE (kcal/mol/atom) |
Type |
|
Z80418-2-O |
RAW264.7 (Monocytic-macrophage Leukemia Cells) (cluster #2 Of 9), Other |
Other |
2220 |
0.40 |
Functional ≤ 10μM |
Physical Representations
|
Type
pH range
|
xlogP
|
Des A‑Pol
Apolar desolvation
(kcal/mol)
|
Des Pol
Polar desolvation
(kcal/mol)
|
H Don
H-bond donors
|
H Acc
H-bond acceptors
|
Chg
Net charge
|
tPSA
(Ų)
|
MWT
Molecular weight
(g/mol)
|
RB
Rotatable bonds
|
DL |
|
Ref
Reference (pH 7)
|
3.21 |
0.23 |
-9.13 |
1 |
4 |
0 |
60 |
268.268 |
2 |
↓
|
|
|
|
|
|
|
Analogs
Draw
Identity
99%
90%
80%
70%
Vendors
Clustered Target Annotations
| Code |
Organism Class |
Affinity (nM) |
LE (kcal/mol/atom) |
Type |
|
Z80418-1-O |
RAW264.7 (Monocytic-macrophage Leukemia Cells) (cluster #1 Of 9), Other |
Other |
3130 |
0.32 |
Functional ≤ 10μM |
Physical Representations
|
Type
pH range
|
xlogP
|
Des A‑Pol
Apolar desolvation
(kcal/mol)
|
Des Pol
Polar desolvation
(kcal/mol)
|
H Don
H-bond donors
|
H Acc
H-bond acceptors
|
Chg
Net charge
|
tPSA
(Ų)
|
MWT
Molecular weight
(g/mol)
|
RB
Rotatable bonds
|
DL |
|
Ref
Reference (pH 7)
|
2.49 |
0.53 |
-11.44 |
5 |
5 |
0 |
101 |
332.396 |
8 |
↓
|
|
|
|
Analogs
Draw
Identity
99%
90%
80%
70%
Vendors
Clustered Target Annotations
| Code |
Organism Class |
Affinity (nM) |
LE (kcal/mol/atom) |
Type |
|
Z80418-2-O |
RAW264.7 (Monocytic-macrophage Leukemia Cells) (cluster #2 Of 9), Other |
Other |
7980 |
0.23 |
Functional ≤ 10μM |
Physical Representations
|
Type
pH range
|
xlogP
|
Des A‑Pol
Apolar desolvation
(kcal/mol)
|
Des Pol
Polar desolvation
(kcal/mol)
|
H Don
H-bond donors
|
H Acc
H-bond acceptors
|
Chg
Net charge
|
tPSA
(Ų)
|
MWT
Molecular weight
(g/mol)
|
RB
Rotatable bonds
|
DL |
|
Ref
Reference (pH 7)
|
3.41 |
5.1 |
-17.06 |
4 |
8 |
0 |
134 |
432.469 |
12 |
↓
|
|
|
|
Analogs
-
4802475
-
Draw
Identity
99%
90%
80%
70%
Vendors
And 8 More
Clustered Target Annotations
| Code |
Organism Class |
Affinity (nM) |
LE (kcal/mol/atom) |
Type |
|
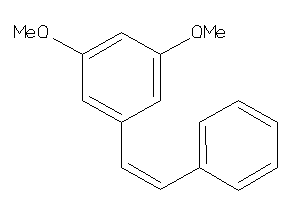
Z80418-2-O |
RAW264.7 (Monocytic-macrophage Leukemia Cells) (cluster #2 Of 9), Other |
Other |
100 |
0.54 |
Functional ≤ 10μM
|
Physical Representations
|
Type
pH range
|
xlogP
|
Des A‑Pol
Apolar desolvation
(kcal/mol)
|
Des Pol
Polar desolvation
(kcal/mol)
|
H Don
H-bond donors
|
H Acc
H-bond acceptors
|
Chg
Net charge
|
tPSA
(Ų)
|
MWT
Molecular weight
(g/mol)
|
RB
Rotatable bonds
|
DL |
|
Ref
Reference (pH 7)
|
4.54 |
2.19 |
-5.96 |
0 |
2 |
0 |
18 |
240.302 |
4 |
↓
|
|
|
|
Analogs
Draw
Identity
99%
90%
80%
70%
Vendors
And 3 More
Clustered Target Annotations
| Code |
Organism Class |
Affinity (nM) |
LE (kcal/mol/atom) |
Type |
|
Z80418-1-O |
RAW264.7 (Monocytic-macrophage Leukemia Cells) (cluster #1 Of 9), Other |
Other |
7611 |
0.33 |
Functional ≤ 10μM
|
Physical Representations
|
Type
pH range
|
xlogP
|
Des A‑Pol
Apolar desolvation
(kcal/mol)
|
Des Pol
Polar desolvation
(kcal/mol)
|
H Don
H-bond donors
|
H Acc
H-bond acceptors
|
Chg
Net charge
|
tPSA
(Ų)
|
MWT
Molecular weight
(g/mol)
|
RB
Rotatable bonds
|
DL |
|
Ref
Reference (pH 7)
|
1.21 |
10.15 |
-28.51 |
0 |
2 |
1 |
16 |
309.458 |
5 |
↓
|
|
|
|
Analogs
Draw
Identity
99%
90%
80%
70%
Vendors
And 1 More
Clustered Target Annotations
| Code |
Organism Class |
Affinity (nM) |
LE (kcal/mol/atom) |
Type |
|
Z80418-2-O |
RAW264.7 (Monocytic-macrophage Leukemia Cells) (cluster #2 Of 9), Other |
Other |
3307 |
0.30 |
Functional ≤ 10μM
|
Physical Representations
|
Type
pH range
|
xlogP
|
Des A‑Pol
Apolar desolvation
(kcal/mol)
|
Des Pol
Polar desolvation
(kcal/mol)
|
H Don
H-bond donors
|
H Acc
H-bond acceptors
|
Chg
Net charge
|
tPSA
(Ų)
|
MWT
Molecular weight
(g/mol)
|
RB
Rotatable bonds
|
DL |
|
Ref
Reference (pH 7)
|
0.99 |
0.62 |
-29.66 |
1 |
4 |
1 |
36 |
366.51 |
5 |
↓
|
|
|
|
|
|
|
Analogs
-
4123268
-
-
20807889
-
Draw
Identity
99%
90%
80%
70%
Vendors
And 1 More
Clustered Target Annotations
| Code |
Organism Class |
Affinity (nM) |
LE (kcal/mol/atom) |
Type |
|
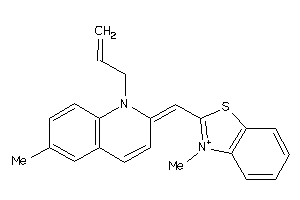
Z80418-2-O |
RAW264.7 (Monocytic-macrophage Leukemia Cells) (cluster #2 Of 9), Other |
Other |
318 |
0.38 |
Functional ≤ 10μM
|
Physical Representations
|
Type
pH range
|
xlogP
|
Des A‑Pol
Apolar desolvation
(kcal/mol)
|
Des Pol
Polar desolvation
(kcal/mol)
|
H Don
H-bond donors
|
H Acc
H-bond acceptors
|
Chg
Net charge
|
tPSA
(Ų)
|
MWT
Molecular weight
(g/mol)
|
RB
Rotatable bonds
|
DL |
|
Ref
Reference (pH 7)
|
1.76 |
12.69 |
-21.66 |
0 |
2 |
1 |
9 |
333.48 |
2 |
↓
|
|
|
|
Analogs
-
5734084
-
Draw
Identity
99%
90%
80%
70%
Vendors
Clustered Target Annotations
| Code |
Organism Class |
Affinity (nM) |
LE (kcal/mol/atom) |
Type |
|
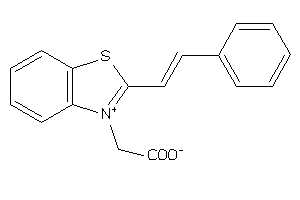
Z80418-2-O |
RAW264.7 (Monocytic-macrophage Leukemia Cells) (cluster #2 Of 9), Other |
Other |
2268 |
0.34 |
Functional ≤ 10μM
|
Physical Representations
|
Type
pH range
|
xlogP
|
Des A‑Pol
Apolar desolvation
(kcal/mol)
|
Des Pol
Polar desolvation
(kcal/mol)
|
H Don
H-bond donors
|
H Acc
H-bond acceptors
|
Chg
Net charge
|
tPSA
(Ų)
|
MWT
Molecular weight
(g/mol)
|
RB
Rotatable bonds
|
DL |
|
Ref
Reference (pH 7)
|
2.22 |
1.95 |
-23.09 |
0 |
2 |
1 |
7 |
323.485 |
4 |
↓
|
|
|
|
Analogs
Draw
Identity
99%
90%
80%
70%
Vendors
Clustered Target Annotations
| Code |
Organism Class |
Affinity (nM) |
LE (kcal/mol/atom) |
Type |
|
Z80418-2-O |
RAW264.7 (Monocytic-macrophage Leukemia Cells) (cluster #2 Of 9), Other |
Other |
741 |
0.30 |
Functional ≤ 10μM
|
Physical Representations
|
Type
pH range
|
xlogP
|
Des A‑Pol
Apolar desolvation
(kcal/mol)
|
Des Pol
Polar desolvation
(kcal/mol)
|
H Don
H-bond donors
|
H Acc
H-bond acceptors
|
Chg
Net charge
|
tPSA
(Ų)
|
MWT
Molecular weight
(g/mol)
|
RB
Rotatable bonds
|
DL |
|
Ref
Reference (pH 7)
|
4.64 |
15.46 |
-23.73 |
0 |
2 |
1 |
9 |
462.491 |
5 |
↓
|
|
|
|
Analogs
Draw
Identity
99%
90%
80%
70%
Vendors
And 1 More
Clustered Target Annotations
| Code |
Organism Class |
Affinity (nM) |
LE (kcal/mol/atom) |
Type |
|
Z80418-2-O |
RAW264.7 (Monocytic-macrophage Leukemia Cells) (cluster #2 Of 9), Other |
Other |
444 |
0.37 |
Functional ≤ 10μM
|
Physical Representations
|
Type
pH range
|
xlogP
|
Des A‑Pol
Apolar desolvation
(kcal/mol)
|
Des Pol
Polar desolvation
(kcal/mol)
|
H Don
H-bond donors
|
H Acc
H-bond acceptors
|
Chg
Net charge
|
tPSA
(Ų)
|
MWT
Molecular weight
(g/mol)
|
RB
Rotatable bonds
|
DL |
|
Ref
Reference (pH 7)
|
1.78 |
2.07 |
-21.47 |
0 |
2 |
1 |
8 |
333.48 |
2 |
↓
|
|
|
|
Analogs
-
16693713
-
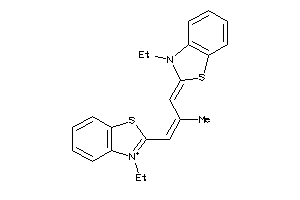
-
25540797
-
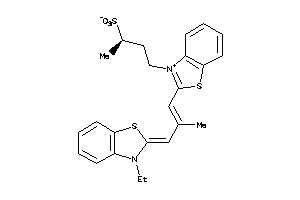
Draw
Identity
99%
90%
80%
70%
Vendors
Clustered Target Annotations
| Code |
Organism Class |
Affinity (nM) |
LE (kcal/mol/atom) |
Type |
|
Z80418-2-O |
RAW264.7 (Monocytic-macrophage Leukemia Cells) (cluster #2 Of 9), Other |
Other |
198 |
0.36 |
Functional ≤ 10μM
|
Physical Representations
|
Type
pH range
|
xlogP
|
Des A‑Pol
Apolar desolvation
(kcal/mol)
|
Des Pol
Polar desolvation
(kcal/mol)
|
H Don
H-bond donors
|
H Acc
H-bond acceptors
|
Chg
Net charge
|
tPSA
(Ų)
|
MWT
Molecular weight
(g/mol)
|
RB
Rotatable bonds
|
DL |
|
Ref
Reference (pH 7)
|
3.07 |
14.69 |
-20.87 |
0 |
2 |
1 |
9 |
379.574 |
4 |
↓
|
|
|
|
Analogs
Draw
Identity
99%
90%
80%
70%
Vendors
And 3 More
Clustered Target Annotations
| Code |
Organism Class |
Affinity (nM) |
LE (kcal/mol/atom) |
Type |
|
Z80418-7-O |
RAW264.7 (Monocytic-macrophage Leukemia Cells) (cluster #7 Of 9), Other |
Other |
3636 |
0.40 |
Functional ≤ 10μM
|
Physical Representations
|
Type
pH range
|
xlogP
|
Des A‑Pol
Apolar desolvation
(kcal/mol)
|
Des Pol
Polar desolvation
(kcal/mol)
|
H Don
H-bond donors
|
H Acc
H-bond acceptors
|
Chg
Net charge
|
tPSA
(Ų)
|
MWT
Molecular weight
(g/mol)
|
RB
Rotatable bonds
|
DL |
|
Ref
Reference (pH 7)
|
1.03 |
2.65 |
-22.71 |
0 |
2 |
1 |
13 |
294.465 |
5 |
↓
|
|
|
|
Analogs
Draw
Identity
99%
90%
80%
70%
Vendors
And 1 More
Clustered Target Annotations
| Code |
Organism Class |
Affinity (nM) |
LE (kcal/mol/atom) |
Type |
|
Z80418-2-O |
RAW264.7 (Monocytic-macrophage Leukemia Cells) (cluster #2 Of 9), Other |
Other |
183 |
0.38 |
Functional ≤ 10μM
|
Physical Representations
|
Type
pH range
|
xlogP
|
Des A‑Pol
Apolar desolvation
(kcal/mol)
|
Des Pol
Polar desolvation
(kcal/mol)
|
H Don
H-bond donors
|
H Acc
H-bond acceptors
|
Chg
Net charge
|
tPSA
(Ų)
|
MWT
Molecular weight
(g/mol)
|
RB
Rotatable bonds
|
DL |
|
Ref
Reference (pH 7)
|
2.16 |
13.88 |
-21.11 |
0 |
2 |
1 |
9 |
347.507 |
3 |
↓
|
|
|
|
Analogs
Draw
Identity
99%
90%
80%
70%
Vendors
Clustered Target Annotations
| Code |
Organism Class |
Affinity (nM) |
LE (kcal/mol/atom) |
Type |
|
Z80418-2-O |
RAW264.7 (Monocytic-macrophage Leukemia Cells) (cluster #2 Of 9), Other |
Other |
215 |
0.36 |
Functional ≤ 10μM
|
Physical Representations
|
Type
pH range
|
xlogP
|
Des A‑Pol
Apolar desolvation
(kcal/mol)
|
Des Pol
Polar desolvation
(kcal/mol)
|
H Don
H-bond donors
|
H Acc
H-bond acceptors
|
Chg
Net charge
|
tPSA
(Ų)
|
MWT
Molecular weight
(g/mol)
|
RB
Rotatable bonds
|
DL |
|
Ref
Reference (pH 7)
|
2.79 |
14.75 |
-21.24 |
0 |
2 |
1 |
9 |
361.534 |
5 |
↓
|
|