|
|
Analogs
-
5932901
-
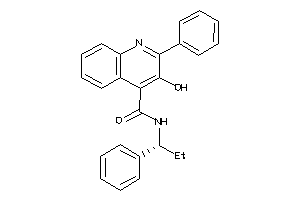
Draw
Identity
99%
90%
80%
70%
Vendors
Clustered Target Annotations
| Code |
Organism Class |
Affinity (nM) |
LE (kcal/mol/atom) |
Type |
|
NK2R-1-E |
Neurokinin 2 Receptor (cluster #1 Of 1), Eukaryotic |
Eukaryotes |
3700 |
0.26 |
Binding ≤ 10μM
|
|
NK3R-1-E |
Neurokinin 3 Receptor (cluster #1 Of 1), Eukaryotic |
Eukaryotes |
3 |
0.41 |
Binding ≤ 10μM
|
|
NK3R-1-E |
Neurokinin 3 Receptor (cluster #1 Of 1), Eukaryotic |
Eukaryotes |
5 |
0.40 |
Binding ≤ 10μM
|
|
OPRM-1-E |
Mu-type Opioid Receptor (cluster #1 Of 4), Eukaryotic |
Eukaryotes |
1860 |
0.28 |
Binding ≤ 10μM
|
|
NK3R-1-E |
Neurokinin 3 Receptor (cluster #1 Of 1), Eukaryotic |
Eukaryotes |
6 |
0.40 |
Functional ≤ 10μM
|
|
CP1A2-1-E |
Cytochrome P450 1A2 (cluster #1 Of 3), Eukaryotic |
Eukaryotes |
5000 |
0.26 |
ADME/T ≤ 10μM
|
|
CP2C9-1-E |
Cytochrome P450 2C9 (cluster #1 Of 3), Eukaryotic |
Eukaryotes |
2000 |
0.28 |
ADME/T ≤ 10μM
|
|
CP2CJ-1-E |
Cytochrome P450 2C19 (cluster #1 Of 3), Eukaryotic |
Eukaryotes |
9000 |
0.24 |
ADME/T ≤ 10μM
|
|
CP3A4-2-E |
Cytochrome P450 3A4 (cluster #2 Of 4), Eukaryotic |
Eukaryotes |
4000 |
0.26 |
ADME/T ≤ 10μM
|
|
Z50593-1-O |
Gerbillinae (cluster #1 Of 1), Other |
Other |
20 |
0.37 |
Functional ≤ 10μM
|
Physical Representations
|
Type
pH range
|
xlogP
|
Des A‑Pol
Apolar desolvation
(kcal/mol)
|
Des Pol
Polar desolvation
(kcal/mol)
|
H Don
H-bond donors
|
H Acc
H-bond acceptors
|
Chg
Net charge
|
tPSA
(Ų)
|
MWT
Molecular weight
(g/mol)
|
RB
Rotatable bonds
|
DL |
|
Ref
Reference (pH 7)
|
4.53 |
-2.05 |
-11.14 |
2 |
4 |
0 |
62 |
382.463 |
5 |
↓
|
|
|
|
Analogs
-
120294
-
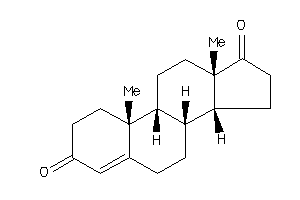
-
2046798
-
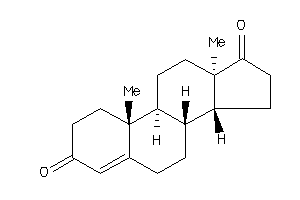
Draw
Identity
99%
90%
80%
70%
Vendors
And 26 More
Clustered Target Annotations
| Code |
Organism Class |
Affinity (nM) |
LE (kcal/mol/atom) |
Type |
|
ANDR-2-E |
Androgen Receptor (cluster #2 Of 4), Eukaryotic |
Eukaryotes |
37 |
0.45 |
Binding ≤ 10μM
|
|
ESR1-2-E |
Estrogen Receptor Alpha (cluster #2 Of 5), Eukaryotic |
Eukaryotes |
4 |
0.51 |
Binding ≤ 10μM
|
|
ESR2-2-E |
Estrogen Receptor Beta (cluster #2 Of 4), Eukaryotic |
Eukaryotes |
4 |
0.51 |
Binding ≤ 10μM
|
|
FABPL-1-E |
Fatty Acid-binding Protein, Liver (cluster #1 Of 4), Eukaryotic |
Eukaryotes |
27 |
0.46 |
Binding ≤ 10μM
|
|
GCR-2-E |
Glucocorticoid Receptor (cluster #2 Of 2), Eukaryotic |
Eukaryotes |
31 |
0.46 |
Binding ≤ 10μM
|
|
MCR-1-E |
Mineralocorticoid Receptor (cluster #1 Of 2), Eukaryotic |
Eukaryotes |
14 |
0.48 |
Binding ≤ 10μM
|
|
PRGR-1-E |
Progesterone Receptor (cluster #1 Of 3), Eukaryotic |
Eukaryotes |
3 |
0.52 |
Binding ≤ 10μM
|
|
S5A1-1-E |
Steroid 5-alpha-reductase 1 (cluster #1 Of 2), Eukaryotic |
Eukaryotes |
2600 |
0.34 |
Binding ≤ 10μM
|
|
S5A2-1-E |
Steroid 5-alpha-reductase 2 (cluster #1 Of 2), Eukaryotic |
Eukaryotes |
2600 |
0.34 |
Binding ≤ 10μM
|
|
SGMR1-2-E |
Sigma Opioid Receptor (cluster #2 Of 6), Eukaryotic |
Eukaryotes |
260 |
0.40 |
Binding ≤ 10μM
|
|
ANDR-2-E |
Androgen Receptor (cluster #2 Of 3), Eukaryotic |
Eukaryotes |
37 |
0.45 |
Functional ≤ 10μM
|
|
ESR1-2-E |
Estrogen Receptor Alpha (cluster #2 Of 3), Eukaryotic |
Eukaryotes |
10000 |
0.30 |
Functional ≤ 10μM
|
|
ESR2-1-E |
Estrogen Receptor Beta (cluster #1 Of 2), Eukaryotic |
Eukaryotes |
10000 |
0.30 |
Functional ≤ 10μM
|
|
GPBAR-2-E |
G-protein Coupled Bile Acid Receptor 1 (cluster #2 Of 2), Eukaryotic |
Eukaryotes |
2770 |
0.34 |
Functional ≤ 10μM
|
|
MCR-2-E |
Mineralocorticoid Receptor (cluster #2 Of 2), Eukaryotic |
Eukaryotes |
30 |
0.46 |
Functional ≤ 10μM
|
|
PRGR-2-E |
Progesterone Receptor (cluster #2 Of 2), Eukaryotic |
Eukaryotes |
3 |
0.52 |
Functional ≤ 10μM
|
|
CP2C9-2-E |
Cytochrome P450 2C9 (cluster #2 Of 3), Eukaryotic |
Eukaryotes |
5500 |
0.32 |
ADME/T ≤ 10μM
|
|
ERG2-1-F |
C-8 Sterol Isomerase (cluster #1 Of 2), Fungal |
Fungi |
4430 |
0.33 |
Binding ≤ 10μM
|
|
Z50425-4-O |
Plasmodium Falciparum (cluster #4 Of 22), Other |
Other |
6310 |
0.32 |
Functional ≤ 10μM
|
|
Z80712-1-O |
T47D (Breast Carcinoma Cells) (cluster #1 Of 7), Other |
Other |
1 |
0.55 |
Functional ≤ 10μM
|
Physical Representations
|
Type
pH range
|
xlogP
|
Des A‑Pol
Apolar desolvation
(kcal/mol)
|
Des Pol
Polar desolvation
(kcal/mol)
|
H Don
H-bond donors
|
H Acc
H-bond acceptors
|
Chg
Net charge
|
tPSA
(Ų)
|
MWT
Molecular weight
(g/mol)
|
RB
Rotatable bonds
|
DL |
|
Ref
Reference (pH 7)
|
3.81 |
10.64 |
-9.9 |
0 |
2 |
0 |
34 |
314.469 |
1 |
↓
|
|
|
|
Analogs
Draw
Identity
99%
90%
80%
70%
Vendors
Clustered Target Annotations
| Code |
Organism Class |
Affinity (nM) |
LE (kcal/mol/atom) |
Type |
|
CP2C9-1-E |
Cytochrome P450 2C9 (cluster #1 Of 3), Eukaryotic |
Eukaryotes |
7350 |
0.28 |
ADME/T ≤ 10μM |
|
Z50425-3-O |
Plasmodium Falciparum (cluster #3 Of 22), Other |
Other |
0 |
0.00 |
Functional ≤ 10μM |
Physical Representations
|
Type
pH range
|
xlogP
|
Des A‑Pol
Apolar desolvation
(kcal/mol)
|
Des Pol
Polar desolvation
(kcal/mol)
|
H Don
H-bond donors
|
H Acc
H-bond acceptors
|
Chg
Net charge
|
tPSA
(Ų)
|
MWT
Molecular weight
(g/mol)
|
RB
Rotatable bonds
|
DL |
|
Ref
Reference (pH 7)
|
3.01 |
5.77 |
-9.23 |
3 |
4 |
0 |
57 |
373.79 |
0 |
↓
|
|
|
|
Analogs
Draw
Identity
99%
90%
80%
70%
Vendors
Clustered Target Annotations
| Code |
Organism Class |
Affinity (nM) |
LE (kcal/mol/atom) |
Type |
|
CP2C9-1-E |
Cytochrome P450 2C9 (cluster #1 Of 3), Eukaryotic |
Eukaryotes |
1510 |
0.34 |
ADME/T ≤ 10μM |
|
Z50425-3-O |
Plasmodium Falciparum (cluster #3 Of 22), Other |
Other |
9 |
0.47 |
Functional ≤ 10μM |
|
Z50425-3-O |
Plasmodium Falciparum (cluster #3 Of 22), Other |
Other |
27 |
0.44 |
Functional ≤ 10μM |
|
Z50426-6-O |
Plasmodium Falciparum (isolate K1 / Thailand) (cluster #6 Of 9), Other |
Other |
9 |
0.47 |
Functional ≤ 10μM |
|
Z50426-6-O |
Plasmodium Falciparum (isolate K1 / Thailand) (cluster #6 Of 9), Other |
Other |
21 |
0.45 |
Functional ≤ 10μM |
Physical Representations
|
Type
pH range
|
xlogP
|
Des A‑Pol
Apolar desolvation
(kcal/mol)
|
Des Pol
Polar desolvation
(kcal/mol)
|
H Don
H-bond donors
|
H Acc
H-bond acceptors
|
Chg
Net charge
|
tPSA
(Ų)
|
MWT
Molecular weight
(g/mol)
|
RB
Rotatable bonds
|
DL |
|
Ref
Reference (pH 7)
|
3.75 |
5.64 |
-9.04 |
3 |
4 |
0 |
57 |
337.81 |
0 |
↓
|
|
|
|
|
|
|
Analogs
Draw
Identity
99%
90%
80%
70%
Vendors
And 28 More
Clustered Target Annotations
| Code |
Organism Class |
Affinity (nM) |
LE (kcal/mol/atom) |
Type |
|
CP2C9-1-E |
Cytochrome P450 2C9 (cluster #1 Of 3), Eukaryotic |
Eukaryotes |
600 |
0.40 |
ADME/T ≤ 10μM
|
Physical Representations
|
Type
pH range
|
xlogP
|
Des A‑Pol
Apolar desolvation
(kcal/mol)
|
Des Pol
Polar desolvation
(kcal/mol)
|
H Don
H-bond donors
|
H Acc
H-bond acceptors
|
Chg
Net charge
|
tPSA
(Ų)
|
MWT
Molecular weight
(g/mol)
|
RB
Rotatable bonds
|
DL |
|
Ref
Reference (pH 7)
|
1.63 |
4.47 |
-50.87 |
2 |
6 |
-1 |
92 |
313.362 |
4 |
↓
|
|
Mid
Mid (pH 6-8)
|
1.63 |
4.24 |
-12.71 |
3 |
6 |
0 |
90 |
314.37 |
4 |
↓
|
|
|
|
Analogs
Draw
Identity
99%
90%
80%
70%
Vendors
And 50 More
Physical Representations
|
Type
pH range
|
xlogP
|
Des A‑Pol
Apolar desolvation
(kcal/mol)
|
Des Pol
Polar desolvation
(kcal/mol)
|
H Don
H-bond donors
|
H Acc
H-bond acceptors
|
Chg
Net charge
|
tPSA
(Ų)
|
MWT
Molecular weight
(g/mol)
|
RB
Rotatable bonds
|
DL |
|
Ref
Reference (pH 7)
|
5.22 |
12.29 |
-7.95 |
1 |
5 |
0 |
50 |
463.796 |
4 |
↓
|
|
|
|
Analogs
Draw
Identity
99%
90%
80%
70%
Vendors
And 21 More
Physical Representations
|
Type
pH range
|
xlogP
|
Des A‑Pol
Apolar desolvation
(kcal/mol)
|
Des Pol
Polar desolvation
(kcal/mol)
|
H Don
H-bond donors
|
H Acc
H-bond acceptors
|
Chg
Net charge
|
tPSA
(Ų)
|
MWT
Molecular weight
(g/mol)
|
RB
Rotatable bonds
|
DL |
|
Ref
Reference (pH 7)
|
1.25 |
8.94 |
-44.5 |
2 |
5 |
1 |
55 |
295.366 |
2 |
↓
|
|
Ref
Reference (pH 7)
|
1.25 |
8.94 |
-43.84 |
2 |
5 |
1 |
55 |
295.366 |
2 |
↓
|
|
Mid
Mid (pH 6-8)
|
1.25 |
8.47 |
-18.57 |
1 |
5 |
0 |
54 |
294.358 |
2 |
↓
|
|
|
|
Analogs
-
33799539
-
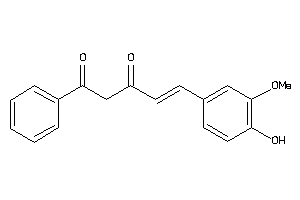
-
44608728
-
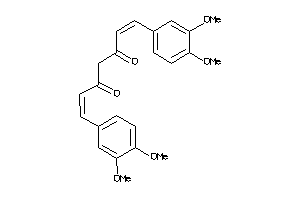
Draw
Identity
99%
90%
80%
70%
Vendors
And 53 More
Clustered Target Annotations
| Code |
Organism Class |
Affinity (nM) |
LE (kcal/mol/atom) |
Type |
|
MTSI-1-B |
CpG DNA Methylase (cluster #1 Of 2), Bacterial |
Bacteria |
30 |
0.39 |
Binding ≤ 10μM
|
|
A4-1-E |
Beta Amyloid A4 Protein (cluster #1 Of 5), Eukaryotic |
Eukaryotes |
800 |
0.32 |
Binding ≤ 10μM
|
|
CAH1-1-E |
Carbonic Anhydrase I (cluster #1 Of 12), Eukaryotic |
Eukaryotes |
2410 |
0.29 |
Binding ≤ 10μM
|
|
CAH12-2-E |
Carbonic Anhydrase XII (cluster #2 Of 9), Eukaryotic |
Eukaryotes |
3480 |
0.28 |
Binding ≤ 10μM
|
|
CAH13-1-E |
Carbonic Anhydrase XIII (cluster #1 Of 7), Eukaryotic |
Eukaryotes |
6850 |
0.27 |
Binding ≤ 10μM
|
|
CAH15-4-E |
Carbonic Anhydrase 15 (cluster #4 Of 6), Eukaryotic |
Eukaryotes |
5090 |
0.27 |
Binding ≤ 10μM
|
|
CAH2-1-E |
Carbonic Anhydrase II (cluster #1 Of 15), Eukaryotic |
Eukaryotes |
380 |
0.33 |
Binding ≤ 10μM
|
|
CAH4-3-E |
Carbonic Anhydrase IV (cluster #3 Of 16), Eukaryotic |
Eukaryotes |
4970 |
0.28 |
Binding ≤ 10μM
|
|
CAH5B-4-E |
Carbonic Anhydrase VB (cluster #4 Of 9), Eukaryotic |
Eukaryotes |
9460 |
0.26 |
Binding ≤ 10μM
|
|
CAH6-8-E |
Carbonic Anhydrase VI (cluster #8 Of 8), Eukaryotic |
Eukaryotes |
9940 |
0.26 |
Binding ≤ 10μM
|
|
CAH7-2-E |
Carbonic Anhydrase VII (cluster #2 Of 8), Eukaryotic |
Eukaryotes |
9300 |
0.26 |
Binding ≤ 10μM
|
|
CAH9-3-E |
Carbonic Anhydrase IX (cluster #3 Of 11), Eukaryotic |
Eukaryotes |
4050 |
0.28 |
Binding ≤ 10μM
|
|
DHB3-1-E |
Estradiol 17-beta-dehydrogenase 3 (cluster #1 Of 4), Eukaryotic |
Eukaryotes |
9000 |
0.26 |
Binding ≤ 10μM
|
|
KPCE-5-E |
Protein Kinase C Epsilon (cluster #5 Of 5), Eukaryotic |
Eukaryotes |
8810 |
0.26 |
Binding ≤ 10μM
|
|
LGUL-2-E |
Glyoxalase I (cluster #2 Of 2), Eukaryotic |
Eukaryotes |
10000 |
0.26 |
Binding ≤ 10μM
|
|
LOX5-4-E |
Arachidonate 5-lipoxygenase (cluster #4 Of 6), Eukaryotic |
Eukaryotes |
8000 |
0.26 |
Binding ≤ 10μM
|
|
MMP9-1-E |
Matrix Metalloproteinase 9 (cluster #1 Of 3), Eukaryotic |
Eukaryotes |
8500 |
0.26 |
Binding ≤ 10μM
|
|
NOS2-4-E |
Nitric Oxide Synthase, Inducible (cluster #4 Of 9), Eukaryotic |
Eukaryotes |
6000 |
0.27 |
Binding ≤ 10μM
|
|
PGH1-6-E |
Cyclooxygenase-1 (cluster #6 Of 6), Eukaryotic |
Eukaryotes |
8800 |
0.26 |
Binding ≤ 10μM
|
|
Q8HY88-1-E |
Potassium Channel Subfamily K Member 2 (cluster #1 Of 1), Eukaryotic |
Eukaryotes |
930 |
0.31 |
Binding ≤ 10μM
|
|
CP2C9-1-E |
Cytochrome P450 2C9 (cluster #1 Of 3), Eukaryotic |
Eukaryotes |
4300 |
0.28 |
ADME/T ≤ 10μM
|
|
Z103192-1-O |
Trypanosoma Evansi (cluster #1 Of 2), Other |
Other |
2000 |
0.30 |
Functional ≤ 10μM
|
|
Z50420-1-O |
Trypanosoma Brucei Brucei (cluster #1 Of 7), Other |
Other |
4800 |
0.28 |
Functional ≤ 10μM
|
|
Z50425-11-O |
Plasmodium Falciparum (cluster #11 Of 22), Other |
Other |
4210 |
0.28 |
Functional ≤ 10μM
|
|
Z50515-1-O |
Human Herpesvirus 2 (cluster #1 Of 2), Other |
Other |
10 |
0.41 |
Functional ≤ 10μM
|
|
Z50518-1-O |
Human Herpesvirus 4 (cluster #1 Of 5), Other |
Other |
10 |
0.41 |
Functional ≤ 10μM
|
|
Z50600-2-O |
Vaccinia Virus (cluster #2 Of 2), Other |
Other |
10 |
0.41 |
Functional ≤ 10μM
|
|
Z50602-1-O |
Human Herpesvirus 1 (cluster #1 Of 5), Other |
Other |
10 |
0.41 |
Functional ≤ 10μM
|
|
Z50607-3-O |
Human Immunodeficiency Virus 1 (cluster #3 Of 10), Other |
Other |
37 |
0.39 |
Functional ≤ 10μM
|
|
Z50651-2-O |
Vesicular Stomatitis Virus (cluster #2 Of 2), Other |
Other |
10 |
0.41 |
Functional ≤ 10μM
|
|
Z50658-4-O |
Human Immunodeficiency Virus 2 (cluster #4 Of 4), Other |
Other |
37 |
0.39 |
Functional ≤ 10μM
|
|
Z80186-2-O |
K562 (Erythroleukemia Cells) (cluster #2 Of 11), Other |
Other |
6810 |
0.27 |
Functional ≤ 10μM
|
|
Z80224-1-O |
MCF7 (Breast Carcinoma Cells) (cluster #1 Of 14), Other |
Other |
5580 |
0.27 |
Functional ≤ 10μM
|
|
Z80244-4-O |
MDA-MB-468 (Breast Adenocarcinoma) (cluster #4 Of 7), Other |
Other |
9700 |
0.26 |
Functional ≤ 10μM
|
|
Z80390-1-O |
PC-3 (Prostate Carcinoma Cells) (cluster #1 Of 10), Other |
Other |
7700 |
0.27 |
Functional ≤ 10μM
|
|
Z80418-2-O |
RAW264.7 (Monocytic-macrophage Leukemia Cells) (cluster #2 Of 9), Other |
Other |
8300 |
0.26 |
Functional ≤ 10μM
|
|
Z80548-3-O |
THP-1 (Acute Monocytic Leukemia Cells) (cluster #3 Of 5), Other |
Other |
1210 |
0.31 |
Functional ≤ 10μM |
|
Z80612-1-O |
2008 (Ovarian Carcinoma Cells) (cluster #1 Of 2), Other |
Other |
5000 |
0.27 |
Functional ≤ 10μM
|
|
Z81170-1-O |
LNCaP (Prostate Carcinoma) (cluster #1 Of 5), Other |
Other |
8500 |
0.26 |
Functional ≤ 10μM
|
|
Z81186-1-O |
LS174T (Colon Adencocarcinoma Cells) (cluster #1 Of 2), Other |
Other |
6500 |
0.27 |
Functional ≤ 10μM
|
|
Z81252-1-O |
MDA-MB-231 (Breast Adenocarcinoma Cells) (cluster #1 Of 11), Other |
Other |
7600 |
0.27 |
Functional ≤ 10μM
|
|
Z80193-1-O |
L1210 (Lymphocytic Leukemia Cells) (cluster #1 Of 4), Other |
Other |
9000 |
0.26 |
ADME/T ≤ 10μM
|
|
Z80874-1-O |
CEM (T-cell Leukemia) (cluster #1 Of 4), Other |
Other |
8700 |
0.26 |
ADME/T ≤ 10μM
|
Physical Representations
|
Type
pH range
|
xlogP
|
Des A‑Pol
Apolar desolvation
(kcal/mol)
|
Des Pol
Polar desolvation
(kcal/mol)
|
H Don
H-bond donors
|
H Acc
H-bond acceptors
|
Chg
Net charge
|
tPSA
(Ų)
|
MWT
Molecular weight
(g/mol)
|
RB
Rotatable bonds
|
DL |
|
Ref
Reference (pH 7)
|
2.30 |
7.14 |
-22.28 |
2 |
6 |
0 |
93 |
368.385 |
8 |
↓
|
|
Hi
High (pH 8-9.5)
|
3.05 |
5.47 |
-58.07 |
2 |
6 |
-1 |
99 |
367.377 |
7 |
↓
|
|
|
|
Analogs
Draw
Identity
99%
90%
80%
70%
Vendors
And 45 More
Clustered Target Annotations
| Code |
Organism Class |
Affinity (nM) |
LE (kcal/mol/atom) |
Type |
|
ABCG2-1-E |
ATP-binding Cassette Sub-family G Member 2 (cluster #1 Of 2), Eukaryotic |
Eukaryotes |
2600 |
0.41 |
Binding ≤ 10μM
|
|
ALDR-1-E |
Aldose Reductase (cluster #1 Of 5), Eukaryotic |
Eukaryotes |
7790 |
0.38 |
Binding ≤ 10μM
|
|
AOFA-4-E |
Monoamine Oxidase A (cluster #4 Of 8), Eukaryotic |
Eukaryotes |
1600 |
0.43 |
Binding ≤ 10μM
|
|
AOFB-4-E |
Monoamine Oxidase B (cluster #4 Of 8), Eukaryotic |
Eukaryotes |
1600 |
0.43 |
Binding ≤ 10μM
|
|
CBR1-1-E |
Carbonyl Reductase [NADPH] 1 (cluster #1 Of 2), Eukaryotic |
Eukaryotes |
670 |
0.45 |
Binding ≤ 10μM
|
|
CCNB1-1-E |
G2/mitotic-specific Cyclin B1 (cluster #1 Of 2), Eukaryotic |
Eukaryotes |
6200 |
0.38 |
Binding ≤ 10μM
|
|
CCNB2-1-E |
G2/mitotic-specific Cyclin B2 (cluster #1 Of 2), Eukaryotic |
Eukaryotes |
6200 |
0.38 |
Binding ≤ 10μM
|
|
CCNB3-1-E |
G2/mitotic-specific Cyclin B3 (cluster #1 Of 2), Eukaryotic |
Eukaryotes |
6200 |
0.38 |
Binding ≤ 10μM
|
|
CDK1-1-E |
Cyclin-dependent Kinase 1 (cluster #1 Of 4), Eukaryotic |
Eukaryotes |
6200 |
0.38 |
Binding ≤ 10μM
|
|
CDK6-1-E |
Cyclin-dependent Kinase 6 (cluster #1 Of 1), Eukaryotic |
Eukaryotes |
6000 |
0.38 |
Binding ≤ 10μM
|
|
CP19A-3-E |
Cytochrome P450 19A1 (cluster #3 Of 3), Eukaryotic |
Eukaryotes |
2600 |
0.41 |
Binding ≤ 10μM
|
|
CP1B1-1-E |
Cytochrome P450 1B1 (cluster #1 Of 1), Eukaryotic |
Eukaryotes |
24 |
0.56 |
Binding ≤ 10μM
|
|
GBRA1-1-E |
GABA Receptor Alpha-1 Subunit (cluster #1 Of 8), Eukaryotic |
Eukaryotes |
3020 |
0.41 |
Binding ≤ 10μM
|
|
GBRA2-1-E |
GABA Receptor Alpha-2 Subunit (cluster #1 Of 8), Eukaryotic |
Eukaryotes |
3020 |
0.41 |
Binding ≤ 10μM
|
|
GBRA3-1-E |
GABA Receptor Alpha-3 Subunit (cluster #1 Of 8), Eukaryotic |
Eukaryotes |
3020 |
0.41 |
Binding ≤ 10μM
|
|
GBRA4-1-E |
GABA Receptor Alpha-4 Subunit (cluster #1 Of 7), Eukaryotic |
Eukaryotes |
3020 |
0.41 |
Binding ≤ 10μM
|
|
GBRA5-1-E |
GABA Receptor Alpha-5 Subunit (cluster #1 Of 8), Eukaryotic |
Eukaryotes |
3020 |
0.41 |
Binding ≤ 10μM
|
|
GBRA6-6-E |
GABA Receptor Alpha-6 Subunit (cluster #6 Of 8), Eukaryotic |
Eukaryotes |
3020 |
0.41 |
Binding ≤ 10μM
|
|
GSK3A-2-E |
Glycogen Synthase Kinase-3 Alpha (cluster #2 Of 3), Eukaryotic |
Eukaryotes |
7200 |
0.38 |
Binding ≤ 10μM
|
|
GSK3B-7-E |
Glycogen Synthase Kinase-3 Beta (cluster #7 Of 7), Eukaryotic |
Eukaryotes |
7200 |
0.38 |
Binding ≤ 10μM
|
|
Q965D6-1-E |
3-oxoacyl-acyl-carrier Protein Reductase (cluster #1 Of 2), Eukaryotic |
Eukaryotes |
10000 |
0.37 |
Binding ≤ 10μM
|
|
XDH-2-E |
Xanthine Dehydrogenase (cluster #2 Of 2), Eukaryotic |
Eukaryotes |
840 |
0.45 |
Binding ≤ 10μM
|
|
CP1A1-1-E |
Cytochrome P450 1A1 (cluster #1 Of 3), Eukaryotic |
Eukaryotes |
42 |
0.54 |
ADME/T ≤ 10μM
|
|
CP1A2-1-E |
Cytochrome P450 1A2 (cluster #1 Of 3), Eukaryotic |
Eukaryotes |
84 |
0.52 |
ADME/T ≤ 10μM
|
|
CP1B1-1-E |
Cytochrome P450 1B1 (cluster #1 Of 3), Eukaryotic |
Eukaryotes |
16 |
0.57 |
ADME/T ≤ 10μM
|
|
CP2C9-1-E |
Cytochrome P450 2C9 (cluster #1 Of 3), Eukaryotic |
Eukaryotes |
5225 |
0.39 |
ADME/T ≤ 10μM
|
|
Z104294-2-O |
Cyclin-dependent Kinase 5/CDK5 Activator 1 (cluster #2 Of 2), Other |
Other |
3100 |
0.41 |
Binding ≤ 10μM
|
|
Z104301-4-O |
GABA-A Receptor; Anion Channel (cluster #4 Of 8), Other |
Other |
920 |
0.44 |
Binding ≤ 10μM
|
|
Z50607-3-O |
Human Immunodeficiency Virus 1 (cluster #3 Of 10), Other |
Other |
5000 |
0.39 |
Functional ≤ 10μM |
|
Z80166-1-O |
HT-29 (Colon Adenocarcinoma Cells) (cluster #1 Of 12), Other |
Other |
3100 |
0.41 |
Functional ≤ 10μM
|
|
Z80470-1-O |
SGC-7901 (Gastric Carcinoma Cells) (cluster #1 Of 2), Other |
Other |
5800 |
0.39 |
Functional ≤ 10μM
|
Physical Representations
|
Type
pH range
|
xlogP
|
Des A‑Pol
Apolar desolvation
(kcal/mol)
|
Des Pol
Polar desolvation
(kcal/mol)
|
H Don
H-bond donors
|
H Acc
H-bond acceptors
|
Chg
Net charge
|
tPSA
(Ų)
|
MWT
Molecular weight
(g/mol)
|
RB
Rotatable bonds
|
DL |
|
Ref
Reference (pH 7)
|
2.94 |
3.96 |
-11.62 |
2 |
4 |
0 |
71 |
254.241 |
1 |
↓
|
|
Hi
High (pH 8-9.5)
|
2.94 |
4.94 |
-56.85 |
1 |
4 |
-1 |
73 |
253.233 |
1 |
↓
|
|
Mid
Mid (pH 6-8)
|
3.20 |
4.26 |
-45.71 |
1 |
4 |
-1 |
73 |
253.233 |
1 |
↓
|
|
|
|
Analogs
Draw
Identity
99%
90%
80%
70%
Vendors
And 34 More
Clustered Target Annotations
| Code |
Organism Class |
Affinity (nM) |
LE (kcal/mol/atom) |
Type |
|
CAH-1-A |
Carbonic Anhydrase (cluster #1 Of 2), Archaea |
Archaea |
140 |
0.37 |
Binding ≤ 10μM
|
|
CYNT-1-B |
Carbonic Anhydrase (cluster #1 Of 3), Bacterial |
Bacteria |
713 |
0.33 |
Binding ≤ 10μM
|
|
B5SU02-2-E |
Alpha Carbonic Anhydrase (cluster #2 Of 6), Eukaryotic |
Eukaryotes |
34 |
0.40 |
Binding ≤ 10μM
|
|
C0IX24-1-E |
Carbonic Anhydrase (cluster #1 Of 5), Eukaryotic |
Eukaryotes |
690 |
0.33 |
Binding ≤ 10μM
|
|
CAH12-1-E |
Carbonic Anhydrase XII (cluster #1 Of 9), Eukaryotic |
Eukaryotes |
18 |
0.42 |
Binding ≤ 10μM |
|
CAH13-1-E |
Carbonic Anhydrase XIII (cluster #1 Of 7), Eukaryotic |
Eukaryotes |
98 |
0.38 |
Binding ≤ 10μM
|
|
CAH14-1-E |
Carbonic Anhydrase XIV (cluster #1 Of 8), Eukaryotic |
Eukaryotes |
689 |
0.33 |
Binding ≤ 10μM
|
|
CAH15-2-E |
Carbonic Anhydrase 15 (cluster #2 Of 6), Eukaryotic |
Eukaryotes |
45 |
0.40 |
Binding ≤ 10μM
|
|
CAH2-1-E |
Carbonic Anhydrase II (cluster #1 Of 15), Eukaryotic |
Eukaryotes |
21 |
0.41 |
Binding ≤ 10μM |
|
CAH4-1-E |
Carbonic Anhydrase IV (cluster #1 Of 16), Eukaryotic |
Eukaryotes |
290 |
0.35 |
Binding ≤ 10μM
|
|
CAH5A-1-E |
Carbonic Anhydrase VA (cluster #1 Of 10), Eukaryotic |
Eukaryotes |
794 |
0.33 |
Binding ≤ 10μM
|
|
CAH5B-1-E |
Carbonic Anhydrase VB (cluster #1 Of 9), Eukaryotic |
Eukaryotes |
93 |
0.38 |
Binding ≤ 10μM
|
|
CAH6-2-E |
Carbonic Anhydrase VI (cluster #2 Of 8), Eukaryotic |
Eukaryotes |
94 |
0.38 |
Binding ≤ 10μM
|
|
CAH7-1-E |
Carbonic Anhydrase VII (cluster #1 Of 8), Eukaryotic |
Eukaryotes |
2170 |
0.30 |
Binding ≤ 10μM
|
|
CAH9-1-E |
Carbonic Anhydrase IX (cluster #1 Of 11), Eukaryotic |
Eukaryotes |
16 |
0.42 |
Binding ≤ 10μM |
|
COX2-1-E |
Cytochrome C Oxidase Subunit 2 (cluster #1 Of 1), Eukaryotic |
Eukaryotes |
60 |
0.39 |
Binding ≤ 10μM
|
|
MK14-1-E |
MAP Kinase P38 Alpha (cluster #1 Of 3), Eukaryotic |
Eukaryotes |
810 |
0.33 |
Binding ≤ 10μM
|
|
PGH1-1-E |
Cyclooxygenase-1 (cluster #1 Of 6), Eukaryotic |
Eukaryotes |
9730 |
0.27 |
Binding ≤ 10μM
|
|
PGH2-4-E |
Cyclooxygenase-2 (cluster #4 Of 8), Eukaryotic |
Eukaryotes |
9 |
0.43 |
Binding ≤ 10μM
|
|
Q8HZR1-1-E |
Cyclooxygenase-1 (cluster #1 Of 1), Eukaryotic |
Eukaryotes |
5570 |
0.28 |
Binding ≤ 10μM
|
|
Q8SPQ9-2-E |
Cyclooxygenase-2 (cluster #2 Of 2), Eukaryotic |
Eukaryotes |
900 |
0.33 |
Binding ≤ 10μM
|
|
CAH2-1-E |
Carbonic Anhydrase II (cluster #1 Of 2), Eukaryotic |
Eukaryotes |
21 |
0.41 |
Functional ≤ 10μM
|
|
CAH4-1-E |
Carbonic Anhydrase IV (cluster #1 Of 2), Eukaryotic |
Eukaryotes |
290 |
0.35 |
Functional ≤ 10μM
|
|
PGH1-1-E |
Cyclooxygenase-1 (cluster #1 Of 2), Eukaryotic |
Eukaryotes |
2000 |
0.31 |
Functional ≤ 10μM
|
|
PGH2-1-E |
Cyclooxygenase-2 (cluster #1 Of 1), Eukaryotic |
Eukaryotes |
3600 |
0.29 |
Functional ≤ 10μM
|
|
CP2C9-1-E |
Cytochrome P450 2C9 (cluster #1 Of 3), Eukaryotic |
Eukaryotes |
10000 |
0.27 |
ADME/T ≤ 10μM
|
|
CAN-1-F |
Carbonic Anhydrase (cluster #1 Of 3), Fungal |
Fungi |
108 |
0.38 |
Binding ≤ 10μM
|
|
Q5AJ71-1-F |
Carbonic Anhydrase (cluster #1 Of 4), Fungal |
Fungi |
21 |
0.41 |
Binding ≤ 10μM
|
|
Z100741-1-O |
MC9 (Mast Cells) (cluster #1 Of 2), Other |
Other |
400 |
0.34 |
Functional ≤ 10μM
|
|
Z50587-1-O |
Homo Sapiens (cluster #1 Of 9), Other |
Other |
6670 |
0.28 |
Functional ≤ 10μM
|
|
Z80548-1-O |
THP-1 (Acute Monocytic Leukemia Cells) (cluster #1 Of 5), Other |
Other |
5000 |
0.29 |
Functional ≤ 10μM
|
Physical Representations
|
Type
pH range
|
xlogP
|
Des A‑Pol
Apolar desolvation
(kcal/mol)
|
Des Pol
Polar desolvation
(kcal/mol)
|
H Don
H-bond donors
|
H Acc
H-bond acceptors
|
Chg
Net charge
|
tPSA
(Ų)
|
MWT
Molecular weight
(g/mol)
|
RB
Rotatable bonds
|
DL |
|
Ref
Reference (pH 7)
|
3.61 |
5.33 |
-11.94 |
2 |
5 |
0 |
78 |
381.379 |
4 |
↓
|
|
|
|
Analogs
Draw
Identity
99%
90%
80%
70%
Vendors
Clustered Target Annotations
| Code |
Organism Class |
Affinity (nM) |
LE (kcal/mol/atom) |
Type |
|
SCN9A-1-E |
Sodium Channel Protein Type IX Alpha Subunit (cluster #1 Of 1), Eukaryotic |
Eukaryotes |
426 |
0.31 |
Binding ≤ 10μM
|
|
CP2C9-1-E |
Cytochrome P450 2C9 (cluster #1 Of 3), Eukaryotic |
Eukaryotes |
9000 |
0.24 |
ADME/T ≤ 10μM
|
Physical Representations
|
Type
pH range
|
xlogP
|
Des A‑Pol
Apolar desolvation
(kcal/mol)
|
Des Pol
Polar desolvation
(kcal/mol)
|
H Don
H-bond donors
|
H Acc
H-bond acceptors
|
Chg
Net charge
|
tPSA
(Ų)
|
MWT
Molecular weight
(g/mol)
|
RB
Rotatable bonds
|
DL |
|
Ref
Reference (pH 7)
|
4.64 |
8.16 |
-11.02 |
2 |
4 |
0 |
61 |
413.321 |
5 |
↓
|
|
|
|
Analogs
-
34606256
-
Draw
Identity
99%
90%
80%
70%
Vendors
And 4 More
Physical Representations
|
Type
pH range
|
xlogP
|
Des A‑Pol
Apolar desolvation
(kcal/mol)
|
Des Pol
Polar desolvation
(kcal/mol)
|
H Don
H-bond donors
|
H Acc
H-bond acceptors
|
Chg
Net charge
|
tPSA
(Ų)
|
MWT
Molecular weight
(g/mol)
|
RB
Rotatable bonds
|
DL |
|
Ref
Reference (pH 7)
|
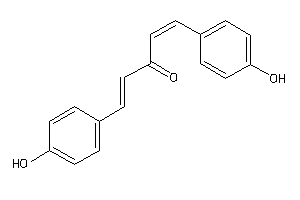
3.23 |
4.99 |
-10.19 |
2 |
3 |
0 |
58 |
266.296 |
4 |
↓
|
|
|
|
Analogs
-
19796087
-
Draw
Identity
99%
90%
80%
70%
Vendors
And 19 More
Clustered Target Annotations
| Code |
Organism Class |
Affinity (nM) |
LE (kcal/mol/atom) |
Type |
|
AA3R-1-E |
Adenosine Receptor A3 (cluster #1 Of 6), Eukaryotic |
Eukaryotes |
3250 |
0.22 |
Binding ≤ 10μM
|
|
ADA2A-1-E |
Alpha-2a Adrenergic Receptor (cluster #1 Of 4), Eukaryotic |
Eukaryotes |
1400 |
0.23 |
Binding ≤ 10μM
|
|
ADA2B-1-E |
Alpha-2b Adrenergic Receptor (cluster #1 Of 4), Eukaryotic |
Eukaryotes |
1400 |
0.23 |
Binding ≤ 10μM
|
|
ADA2C-1-E |
Alpha-2c Adrenergic Receptor (cluster #1 Of 4), Eukaryotic |
Eukaryotes |
1400 |
0.23 |
Binding ≤ 10μM
|
|
CAC1C-1-E |
Voltage-gated L-type Calcium Channel Alpha-1C Subunit (cluster #1 Of 1), Eukaryotic |
Eukaryotes |
7 |
0.33 |
Binding ≤ 10μM
|
|
CAC1D-1-E |
Voltage-gated L-type Calcium Channel Alpha-1D Subunit (cluster #1 Of 2), Eukaryotic |
Eukaryotes |
7 |
0.33 |
Binding ≤ 10μM
|
|
CTRA-1-E |
Alpha-chymotrypsin (cluster #1 Of 4), Eukaryotic |
Eukaryotes |
3 |
0.34 |
Binding ≤ 10μM
|
|
MDHM-1-E |
Malate Dehydrogenase, Mitochondrial (cluster #1 Of 2), Eukaryotic |
Eukaryotes |
49 |
0.29 |
Binding ≤ 10μM
|
|
S29A1-1-E |
Equilibrative Nucleoside Transporter 1 (cluster #1 Of 1), Eukaryotic |
Eukaryotes |
5360 |
0.21 |
Binding ≤ 10μM
|
|
CAC1C-1-E |
Voltage-gated L-type Calcium Channel Alpha-1C Subunit (cluster #1 Of 1), Eukaryotic |
Eukaryotes |
3 |
0.34 |
Functional ≤ 10μM
|
|
CAC1D-1-E |
Voltage-gated L-type Calcium Channel Alpha-1D Subunit (cluster #1 Of 1), Eukaryotic |
Eukaryotes |
3 |
0.34 |
Functional ≤ 10μM
|
|
MDR1-1-E |
P-glycoprotein 1 (cluster #1 Of 2), Eukaryotic |
Eukaryotes |
950 |
0.24 |
Functional ≤ 10μM
|
|
MDR3-1-E |
P-glycoprotein 3 (cluster #1 Of 2), Eukaryotic |
Eukaryotes |
2500 |
0.22 |
Functional ≤ 10μM
|
|
TRPA1-4-E |
Transient Receptor Potential Cation Channel Subfamily A Member 1 (cluster #4 Of 6), Eukaryotic |
Eukaryotes |
500 |
0.25 |
Functional ≤ 10μM |
|
CP2C9-1-E |
Cytochrome P450 2C9 (cluster #1 Of 3), Eukaryotic |
Eukaryotes |
280 |
0.26 |
ADME/T ≤ 10μM
|
|
CP3A4-2-E |
Cytochrome P450 3A4 (cluster #2 Of 4), Eukaryotic |
Eukaryotes |
420 |
0.26 |
ADME/T ≤ 10μM
|
|
Z104304-1-O |
Adrenergic Receptor Alpha-1 (cluster #1 Of 3), Other |
Other |
3600 |
0.22 |
Binding ≤ 10μM
|
|
Z50597-1-O |
Rattus Norvegicus (cluster #1 Of 5), Other |
Other |
0 |
0.00 |
Binding ≤ 10μM
|
|
Z50425-3-O |
Plasmodium Falciparum (cluster #3 Of 22), Other |
Other |
1995 |
0.23 |
Functional ≤ 10μM
|
|
Z50590-1-O |
Sus Scrofa (cluster #1 Of 1), Other |
Other |
0 |
0.00 |
Functional ≤ 10μM
|
|
Z50597-1-O |
Rattus Norvegicus (cluster #1 Of 12), Other |
Other |
1400 |
0.23 |
Functional ≤ 10μM
|
Physical Representations
|
Type
pH range
|
xlogP
|
Des A‑Pol
Apolar desolvation
(kcal/mol)
|
Des Pol
Polar desolvation
(kcal/mol)
|
H Don
H-bond donors
|
H Acc
H-bond acceptors
|
Chg
Net charge
|
tPSA
(Ų)
|
MWT
Molecular weight
(g/mol)
|
RB
Rotatable bonds
|
DL |
|
Ref
Reference (pH 7)
|
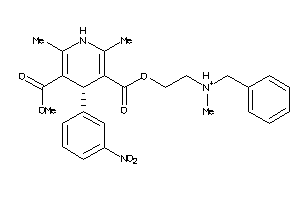
4.25 |
14.38 |
-38.25 |
1 |
9 |
0 |
121 |
479.533 |
10 |
↓
|
|
Hi
High (pH 8-9.5)
|
5.00 |
13.02 |
-15.82 |
1 |
9 |
0 |
114 |
479.533 |
11 |
↓
|
|
Mid
Mid (pH 6-8)
|
4.25 |
11.97 |
-39.15 |
0 |
9 |
-1 |
120 |
478.525 |
10 |
↓
|
|
|
|
Analogs
-
601265
-
Draw
Identity
99%
90%
80%
70%
Vendors
And 26 More
Clustered Target Annotations
| Code |
Organism Class |
Affinity (nM) |
LE (kcal/mol/atom) |
Type |
|
AA3R-1-E |
Adenosine Receptor A3 (cluster #1 Of 6), Eukaryotic |
Eukaryotes |
3250 |
0.22 |
Binding ≤ 10μM
|
|
ADA2A-1-E |
Alpha-2a Adrenergic Receptor (cluster #1 Of 4), Eukaryotic |
Eukaryotes |
1400 |
0.23 |
Binding ≤ 10μM
|
|
ADA2B-1-E |
Alpha-2b Adrenergic Receptor (cluster #1 Of 4), Eukaryotic |
Eukaryotes |
1400 |
0.23 |
Binding ≤ 10μM
|
|
ADA2C-1-E |
Alpha-2c Adrenergic Receptor (cluster #1 Of 4), Eukaryotic |
Eukaryotes |
1400 |
0.23 |
Binding ≤ 10μM
|
|
CAC1C-1-E |
Voltage-gated L-type Calcium Channel Alpha-1C Subunit (cluster #1 Of 1), Eukaryotic |
Eukaryotes |
7 |
0.33 |
Binding ≤ 10μM
|
|
CAC1D-1-E |
Voltage-gated L-type Calcium Channel Alpha-1D Subunit (cluster #1 Of 2), Eukaryotic |
Eukaryotes |
7 |
0.33 |
Binding ≤ 10μM
|
|
CTRA-1-E |
Alpha-chymotrypsin (cluster #1 Of 4), Eukaryotic |
Eukaryotes |
3 |
0.34 |
Binding ≤ 10μM
|
|
MDHM-1-E |
Malate Dehydrogenase, Mitochondrial (cluster #1 Of 2), Eukaryotic |
Eukaryotes |
49 |
0.29 |
Binding ≤ 10μM
|
|
S29A1-1-E |
Equilibrative Nucleoside Transporter 1 (cluster #1 Of 1), Eukaryotic |
Eukaryotes |
5360 |
0.21 |
Binding ≤ 10μM
|
|
CAC1C-1-E |
Voltage-gated L-type Calcium Channel Alpha-1C Subunit (cluster #1 Of 1), Eukaryotic |
Eukaryotes |
3 |
0.34 |
Functional ≤ 10μM
|
|
CAC1D-1-E |
Voltage-gated L-type Calcium Channel Alpha-1D Subunit (cluster #1 Of 1), Eukaryotic |
Eukaryotes |
3 |
0.34 |
Functional ≤ 10μM
|
|
MDR1-1-E |
P-glycoprotein 1 (cluster #1 Of 2), Eukaryotic |
Eukaryotes |
950 |
0.24 |
Functional ≤ 10μM
|
|
MDR3-1-E |
P-glycoprotein 3 (cluster #1 Of 2), Eukaryotic |
Eukaryotes |
2500 |
0.22 |
Functional ≤ 10μM
|
|
TRPA1-4-E |
Transient Receptor Potential Cation Channel Subfamily A Member 1 (cluster #4 Of 6), Eukaryotic |
Eukaryotes |
500 |
0.25 |
Functional ≤ 10μM |
|
CP2C9-1-E |
Cytochrome P450 2C9 (cluster #1 Of 3), Eukaryotic |
Eukaryotes |
280 |
0.26 |
ADME/T ≤ 10μM
|
|
CP3A4-2-E |
Cytochrome P450 3A4 (cluster #2 Of 4), Eukaryotic |
Eukaryotes |
420 |
0.26 |
ADME/T ≤ 10μM
|
|
Z104304-1-O |
Adrenergic Receptor Alpha-1 (cluster #1 Of 3), Other |
Other |
3600 |
0.22 |
Binding ≤ 10μM
|
|
Z50597-1-O |
Rattus Norvegicus (cluster #1 Of 5), Other |
Other |
0 |
0.00 |
Binding ≤ 10μM
|
|
Z50425-3-O |
Plasmodium Falciparum (cluster #3 Of 22), Other |
Other |
1995 |
0.23 |
Functional ≤ 10μM
|
|
Z50590-1-O |
Sus Scrofa (cluster #1 Of 1), Other |
Other |
0 |
0.00 |
Functional ≤ 10μM
|
|
Z50597-1-O |
Rattus Norvegicus (cluster #1 Of 12), Other |
Other |
1400 |
0.23 |
Functional ≤ 10μM
|
Physical Representations
|
Type
pH range
|
xlogP
|
Des A‑Pol
Apolar desolvation
(kcal/mol)
|
Des Pol
Polar desolvation
(kcal/mol)
|
H Don
H-bond donors
|
H Acc
H-bond acceptors
|
Chg
Net charge
|
tPSA
(Ų)
|
MWT
Molecular weight
(g/mol)
|
RB
Rotatable bonds
|
DL |
|
Ref
Reference (pH 7)
|
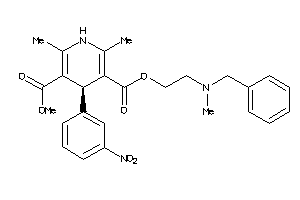
5.00 |
15.39 |
-55.91 |
2 |
9 |
1 |
115 |
480.541 |
11 |
↓
|
|
Hi
High (pH 8-9.5)
|
5.00 |
13.13 |
-16.47 |
1 |
9 |
0 |
114 |
479.533 |
11 |
↓
|
|
Mid
Mid (pH 6-8)
|
4.25 |
11.42 |
-38.29 |
0 |
9 |
-1 |
120 |
478.525 |
10 |
↓
|
|
|
|
Analogs
Draw
Identity
99%
90%
80%
70%
Vendors
Clustered Target Annotations
| Code |
Organism Class |
Affinity (nM) |
LE (kcal/mol/atom) |
Type |
|
CP2A6-1-E |
Cytochrome P450 2A6 (cluster #1 Of 5), Eukaryotic |
Eukaryotes |
890 |
0.77 |
ADME/T ≤ 10μM
|
|
CP2C9-3-E |
Cytochrome P450 2C9 (cluster #3 Of 3), Eukaryotic |
Eukaryotes |
6300 |
0.66 |
ADME/T ≤ 10μM
|
|
Z104283-2-O |
Neuronal Acetylcholine Receptor; Alpha4/beta2 (cluster #2 Of 4), Other |
Other |
2285 |
0.72 |
Binding ≤ 10μM
|
Physical Representations
|
Type
pH range
|
xlogP
|
Des A‑Pol
Apolar desolvation
(kcal/mol)
|
Des Pol
Polar desolvation
(kcal/mol)
|
H Don
H-bond donors
|
H Acc
H-bond acceptors
|
Chg
Net charge
|
tPSA
(Ų)
|
MWT
Molecular weight
(g/mol)
|
RB
Rotatable bonds
|
DL |
|
Ref
Reference (pH 7)
|
0.69 |
4.13 |
-43.52 |
2 |
2 |
1 |
29 |
147.201 |
1 |
↓
|
|
Lo
Low (pH 4.5-6)
|
0.69 |
4.41 |
-86.78 |
3 |
2 |
2 |
31 |
148.209 |
1 |
↓
|
|
|
|
Analogs
Draw
Identity
99%
90%
80%
70%
Vendors
And 30 More
Clustered Target Annotations
| Code |
Organism Class |
Affinity (nM) |
LE (kcal/mol/atom) |
Type |
|
NANH-1-B |
Sialidase (cluster #1 Of 1), Bacterial |
Bacteria |
8000 |
0.34 |
Binding ≤ 10μM
|
|
ABCG2-1-E |
ATP-binding Cassette Sub-family G Member 2 (cluster #1 Of 2), Eukaryotic |
Eukaryotes |
6200 |
0.35 |
Binding ≤ 10μM
|
|
AHR-1-E |
Aryl Hydrocarbon Receptor (cluster #1 Of 1), Eukaryotic |
Eukaryotes |
28 |
0.50 |
Binding ≤ 10μM
|
|
ALDR-1-E |
Aldose Reductase (cluster #1 Of 5), Eukaryotic |
Eukaryotes |
1330 |
0.39 |
Binding ≤ 10μM
|
|
CP1B1-1-E |
Cytochrome P450 1B1 (cluster #1 Of 1), Eukaryotic |
Eukaryotes |
47 |
0.49 |
Binding ≤ 10μM
|
|
DHB1-1-E |
Estradiol 17-beta-dehydrogenase 1 (cluster #1 Of 1), Eukaryotic |
Eukaryotes |
1050 |
0.40 |
Binding ≤ 10μM
|
|
DHB2-1-E |
Estradiol 17-beta-dehydrogenase 2 (cluster #1 Of 2), Eukaryotic |
Eukaryotes |
360 |
0.43 |
Binding ≤ 10μM
|
|
GSK3A-1-E |
Glycogen Synthase Kinase-3 Alpha (cluster #1 Of 3), Eukaryotic |
Eukaryotes |
3500 |
0.36 |
Binding ≤ 10μM
|
|
GSK3B-7-E |
Glycogen Synthase Kinase-3 Beta (cluster #7 Of 7), Eukaryotic |
Eukaryotes |
3500 |
0.36 |
Binding ≤ 10μM
|
|
LOX15-1-E |
Arachidonate 15-lipoxygenase (cluster #1 Of 5), Eukaryotic |
Eukaryotes |
2200 |
0.38 |
Binding ≤ 10μM
|
|
LOX5-1-E |
Arachidonate 5-lipoxygenase (cluster #1 Of 6), Eukaryotic |
Eukaryotes |
2700 |
0.37 |
Binding ≤ 10μM
|
|
MDR3-1-E |
P-glycoprotein 3 (cluster #1 Of 2), Eukaryotic |
Eukaryotes |
6700 |
0.34 |
Binding ≤ 10μM
|
|
MRP1-1-E |
Multidrug Resistance-associated Protein 1 (cluster #1 Of 1), Eukaryotic |
Eukaryotes |
2400 |
0.37 |
Binding ≤ 10μM
|
|
NOX4-1-E |
NADPH Oxidase 4 (cluster #1 Of 1), Eukaryotic |
Eukaryotes |
1200 |
0.39 |
Binding ≤ 10μM
|
|
Q965D6-1-E |
3-oxoacyl-acyl-carrier Protein Reductase (cluster #1 Of 2), Eukaryotic |
Eukaryotes |
4000 |
0.36 |
Binding ≤ 10μM
|
|
XDH-2-E |
Xanthine Dehydrogenase (cluster #2 Of 2), Eukaryotic |
Eukaryotes |
1060 |
0.40 |
Binding ≤ 10μM
|
|
ANDR-1-E |
Androgen Receptor (cluster #1 Of 3), Eukaryotic |
Eukaryotes |
9700 |
0.33 |
Functional ≤ 10μM
|
|
CP1A1-1-E |
Cytochrome P450 1A1 (cluster #1 Of 3), Eukaryotic |
Eukaryotes |
750 |
0.41 |
ADME/T ≤ 10μM
|
|
CP1A2-1-E |
Cytochrome P450 1A2 (cluster #1 Of 3), Eukaryotic |
Eukaryotes |
716 |
0.41 |
ADME/T ≤ 10μM
|
|
CP1B1-1-E |
Cytochrome P450 1B1 (cluster #1 Of 3), Eukaryotic |
Eukaryotes |
43 |
0.49 |
ADME/T ≤ 10μM
|
|
CP2C9-1-E |
Cytochrome P450 2C9 (cluster #1 Of 3), Eukaryotic |
Eukaryotes |
6000 |
0.35 |
ADME/T ≤ 10μM
|
Physical Representations
|
Type
pH range
|
xlogP
|
Des A‑Pol
Apolar desolvation
(kcal/mol)
|
Des Pol
Polar desolvation
(kcal/mol)
|
H Don
H-bond donors
|
H Acc
H-bond acceptors
|
Chg
Net charge
|
tPSA
(Ų)
|
MWT
Molecular weight
(g/mol)
|
RB
Rotatable bonds
|
DL |
|
Ref
Reference (pH 7)
|
2.17 |
-0.82 |
-11.52 |
4 |
6 |
0 |
111 |
286.239 |
1 |
↓
|
|
Mid
Mid (pH 6-8)
|
2.43 |
-0.55 |
-41.88 |
3 |
6 |
-1 |
114 |
285.231 |
1 |
↓
|
|
|
|
Analogs
Draw
Identity
99%
90%
80%
70%
Vendors
And 75 More
Clustered Target Annotations
| Code |
Organism Class |
Affinity (nM) |
LE (kcal/mol/atom) |
Type |
|
CP2C9-1-E |
Cytochrome P450 2C9 (cluster #1 Of 3), Eukaryotic |
Eukaryotes |
6000 |
0.38 |
ADME/T ≤ 10μM
|
Physical Representations
|
Type
pH range
|
xlogP
|
Des A‑Pol
Apolar desolvation
(kcal/mol)
|
Des Pol
Polar desolvation
(kcal/mol)
|
H Don
H-bond donors
|
H Acc
H-bond acceptors
|
Chg
Net charge
|
tPSA
(Ų)
|
MWT
Molecular weight
(g/mol)
|
RB
Rotatable bonds
|
DL |
|
Ref
Reference (pH 7)
|
2.18 |
4.66 |
-7.46 |
2 |
4 |
0 |
58 |
252.273 |
2 |
↓
|
|
Mid
Mid (pH 6-8)
|
2.36 |
2.13 |
-45.39 |
1 |
4 |
-1 |
65 |
251.265 |
2 |
↓
|
|
|
|
Analogs
Draw
Identity
99%
90%
80%
70%
Vendors
Physical Representations
|
Type
pH range
|
xlogP
|
Des A‑Pol
Apolar desolvation
(kcal/mol)
|
Des Pol
Polar desolvation
(kcal/mol)
|
H Don
H-bond donors
|
H Acc
H-bond acceptors
|
Chg
Net charge
|
tPSA
(Ų)
|
MWT
Molecular weight
(g/mol)
|
RB
Rotatable bonds
|
DL |
|
Ref
Reference (pH 7)
|
1.08 |
-2.03 |
-62.97 |
3 |
5 |
1 |
66 |
304.395 |
2 |
↓
|
|
|
|
Analogs
Draw
Identity
99%
90%
80%
70%
Vendors
Clustered Target Annotations
| Code |
Organism Class |
Affinity (nM) |
LE (kcal/mol/atom) |
Type |
|
AL5AP-1-E |
5-lipoxygenase Activating Protein (cluster #1 Of 1), Eukaryotic |
Eukaryotes |
2 |
0.30 |
Binding ≤ 10μM |
|
LOX5-1-E |
Arachidonate 5-lipoxygenase (cluster #1 Of 6), Eukaryotic |
Eukaryotes |
5000 |
0.18 |
Binding ≤ 10μM
|
|
AL5AP-1-E |
5-lipoxygenase Activating Protein (cluster #1 Of 1), Eukaryotic |
Eukaryotes |
8000 |
0.17 |
Functional ≤ 10μM |
|
LOX5-1-E |
Arachidonate 5-lipoxygenase (cluster #1 Of 7), Eukaryotic |
Eukaryotes |
8 |
0.28 |
Functional ≤ 10μM
|
|
LOX5-1-E |
Arachidonate 5-lipoxygenase (cluster #1 Of 7), Eukaryotic |
Eukaryotes |
8000 |
0.17 |
Functional ≤ 10μM |
|
CP2C9-1-E |
Cytochrome P450 2C9 (cluster #1 Of 3), Eukaryotic |
Eukaryotes |
500 |
0.22 |
ADME/T ≤ 10μM
|
|
CP2D6-1-E |
Cytochrome P450 2D6 (cluster #1 Of 3), Eukaryotic |
Eukaryotes |
11 |
0.27 |
ADME/T ≤ 10μM
|
|
CP3A4-2-E |
Cytochrome P450 3A4 (cluster #2 Of 4), Eukaryotic |
Eukaryotes |
5200 |
0.18 |
ADME/T ≤ 10μM
|
|
Z102213-1-O |
Blood (cluster #1 Of 2), Other |
Other |
510 |
0.21 |
Functional ≤ 10μM
|
|
Z50587-1-O |
Homo Sapiens (cluster #1 Of 9), Other |
Other |
500 |
0.22 |
Functional ≤ 10μM
|
|
Z50587-1-O |
Homo Sapiens (cluster #1 Of 9), Other |
Other |
510 |
0.21 |
Functional ≤ 10μM
|
|
Z50597-1-O |
Rattus Norvegicus (cluster #1 Of 12), Other |
Other |
2 |
0.30 |
Functional ≤ 10μM
|
|
Z80419-1-O |
RBL-1 (Basophilic Leukemia Cells) (cluster #1 Of 2), Other |
Other |
6 |
0.28 |
Functional ≤ 10μM
|
Physical Representations
|
Type
pH range
|
xlogP
|
Des A‑Pol
Apolar desolvation
(kcal/mol)
|
Des Pol
Polar desolvation
(kcal/mol)
|
H Don
H-bond donors
|
H Acc
H-bond acceptors
|
Chg
Net charge
|
tPSA
(Ų)
|
MWT
Molecular weight
(g/mol)
|
RB
Rotatable bonds
|
DL |
|
Ref
Reference (pH 7)
|
8.57 |
1.77 |
-52.69 |
0 |
5 |
-1 |
67 |
586.177 |
10 |
↓
|
|
|
|
Analogs
Draw
Identity
99%
90%
80%
70%
Vendors
And 1 More
Clustered Target Annotations
| Code |
Organism Class |
Affinity (nM) |
LE (kcal/mol/atom) |
Type |
|
CP2C9-1-E |
Cytochrome P450 2C9 (cluster #1 Of 3), Eukaryotic |
Eukaryotes |
500 |
0.42 |
ADME/T ≤ 10μM
|
|
Q72874-1-V |
Human Immunodeficiency Virus Type 1 Protease (cluster #1 Of 3), Viral |
Viruses |
800 |
0.41 |
Binding ≤ 10μM
|
Physical Representations
|
Type
pH range
|
xlogP
|
Des A‑Pol
Apolar desolvation
(kcal/mol)
|
Des Pol
Polar desolvation
(kcal/mol)
|
H Don
H-bond donors
|
H Acc
H-bond acceptors
|
Chg
Net charge
|
tPSA
(Ų)
|
MWT
Molecular weight
(g/mol)
|
RB
Rotatable bonds
|
DL |
|
Ref
Reference (pH 7)
|
4.09 |
9.85 |
-43.2 |
0 |
3 |
-1 |
53 |
279.315 |
3 |
↓
|
|
Ref
Reference (pH 7)
|
4.09 |
9.71 |
-44.08 |
0 |
3 |
-1 |
53 |
279.315 |
3 |
↓
|
|
Mid
Mid (pH 6-8)
|
4.09 |
9.25 |
-15.87 |
1 |
3 |
0 |
50 |
280.323 |
3 |
↓
|
|
|
|
Analogs
Draw
Identity
99%
90%
80%
70%
Vendors
And 1 More
Clustered Target Annotations
| Code |
Organism Class |
Affinity (nM) |
LE (kcal/mol/atom) |
Type |
|
CP2C9-1-E |
Cytochrome P450 2C9 (cluster #1 Of 3), Eukaryotic |
Eukaryotes |
500 |
0.42 |
ADME/T ≤ 10μM
|
|
Q72874-1-V |
Human Immunodeficiency Virus Type 1 Protease (cluster #1 Of 3), Viral |
Viruses |
800 |
0.41 |
Binding ≤ 10μM
|
Physical Representations
|
Type
pH range
|
xlogP
|
Des A‑Pol
Apolar desolvation
(kcal/mol)
|
Des Pol
Polar desolvation
(kcal/mol)
|
H Don
H-bond donors
|
H Acc
H-bond acceptors
|
Chg
Net charge
|
tPSA
(Ų)
|
MWT
Molecular weight
(g/mol)
|
RB
Rotatable bonds
|
DL |
|
Ref
Reference (pH 7)
|
4.09 |
9.84 |
-41.39 |
0 |
3 |
-1 |
53 |
279.315 |
3 |
↓
|
|
Ref
Reference (pH 7)
|
4.09 |
9.65 |
-42.02 |
0 |
3 |
-1 |
53 |
279.315 |
3 |
↓
|
|
Mid
Mid (pH 6-8)
|
4.09 |
9.24 |
-16.11 |
1 |
3 |
0 |
50 |
280.323 |
3 |
↓
|
|
|
|
|
|
|
|
|
|
Analogs
-
643055
-
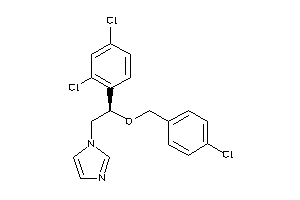
-
896740
-
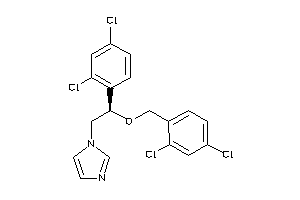
-
3872945
-
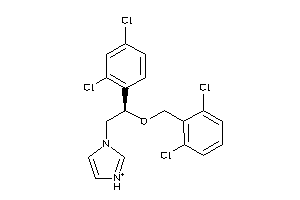
-
3944782
-
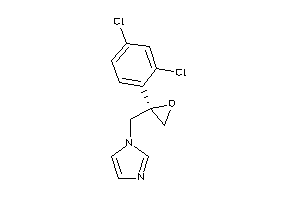
-
596881
-
Draw
Identity
99%
90%
80%
70%
Vendors
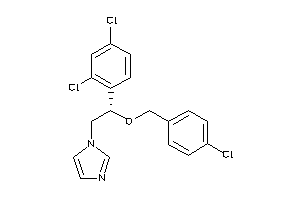
And 52 More
Clustered Target Annotations
| Code |
Organism Class |
Affinity (nM) |
LE (kcal/mol/atom) |
Type |
|
AMPC-1-B |
Beta-lactamase (cluster #1 Of 6), Bacterial |
Bacteria |
5 |
0.46 |
Binding ≤ 10μM
|
|
CP51-1-B |
Sterol 14-alpha Demethylase (cluster #1 Of 2), Bacterial |
Bacteria |
200 |
0.38 |
Binding ≤ 10μM
|
|
CP17A-1-E |
Cytochrome P450 17A1 (cluster #1 Of 2), Eukaryotic |
Eukaryotes |
243 |
0.37 |
Binding ≤ 10μM
|
|
CP19A-3-E |
Cytochrome P450 19A1 (cluster #3 Of 3), Eukaryotic |
Eukaryotes |
400 |
0.36 |
Binding ≤ 10μM
|
|
CP51A-1-E |
Cytochrome P450 51 (cluster #1 Of 2), Eukaryotic |
Eukaryotes |
200 |
0.38 |
Binding ≤ 10μM
|
|
GRM6-2-E |
Metabotropic Glutamate Receptor 6 (cluster #2 Of 2), Eukaryotic |
Eukaryotes |
6500 |
0.29 |
Functional ≤ 10μM
|
|
MDR1-1-E |
P-glycoprotein 1 (cluster #1 Of 2), Eukaryotic |
Eukaryotes |
3500 |
0.31 |
Functional ≤ 10μM
|
|
MDR3-1-E |
P-glycoprotein 3 (cluster #1 Of 2), Eukaryotic |
Eukaryotes |
7800 |
0.29 |
Functional ≤ 10μM
|
|
CP2C9-1-E |
Cytochrome P450 2C9 (cluster #1 Of 3), Eukaryotic |
Eukaryotes |
6000 |
0.29 |
ADME/T ≤ 10μM
|
|
CP3A4-2-E |
Cytochrome P450 3A4 (cluster #2 Of 4), Eukaryotic |
Eukaryotes |
851 |
0.34 |
ADME/T ≤ 10μM
|
|
Z102121-2-O |
Trichophyton Mentagrophytes (cluster #2 Of 3), Other |
Other |
400 |
0.36 |
Functional ≤ 10μM
|
|
Z50038-1-O |
Plasmodium Yoelii Yoelii (cluster #1 Of 2), Other |
Other |
2 |
0.49 |
Functional ≤ 10μM
|
|
Z50046-1-O |
Trichophyton Quinckeanum (cluster #1 Of 2), Other |
Other |
790 |
0.34 |
Functional ≤ 10μM
|
|
Z50408-1-O |
Issatchenkia Orientalis (cluster #1 Of 2), Other |
Other |
1400 |
0.33 |
Functional ≤ 10μM
|
|
Z50409-1-O |
Kluyveromyces Marxianus (cluster #1 Of 2), Other |
Other |
30 |
0.42 |
Functional ≤ 10μM
|
|
Z50416-1-O |
Aspergillus Fumigatus (cluster #1 Of 3), Other |
Other |
1900 |
0.32 |
Functional ≤ 10μM
|
|
Z50442-1-O |
Candida Albicans (cluster #1 Of 4), Other |
Other |
300 |
0.37 |
Functional ≤ 10μM
|
|
Z50443-1-O |
Candida Glabrata (cluster #1 Of 1), Other |
Other |
120 |
0.39 |
Functional ≤ 10μM
|
|
Z50452-1-O |
Trichophyton Rubrum (cluster #1 Of 2), Other |
Other |
330 |
0.36 |
Functional ≤ 10μM
|
|
Z50459-2-O |
Leishmania Donovani (cluster #2 Of 8), Other |
Other |
6000 |
0.29 |
Functional ≤ 10μM
|
Physical Representations
|
Type
pH range
|
xlogP
|
Des A‑Pol
Apolar desolvation
(kcal/mol)
|
Des Pol
Polar desolvation
(kcal/mol)
|
H Don
H-bond donors
|
H Acc
H-bond acceptors
|
Chg
Net charge
|
tPSA
(Ų)
|
MWT
Molecular weight
(g/mol)
|
RB
Rotatable bonds
|
DL |
|
Ref
Reference (pH 7)
|
5.72 |
14.15 |
-35.65 |
1 |
3 |
1 |
28 |
417.143 |
6 |
↓
|
|
Mid
Mid (pH 6-8)
|
5.72 |
13.63 |
-6.4 |
0 |
3 |
0 |
27 |
416.135 |
6 |
↓
|
|
|
|
Analogs
Draw
Identity
99%
90%
80%
70%
Vendors
And 2 More
Physical Representations
|
Type
pH range
|
xlogP
|
Des A‑Pol
Apolar desolvation
(kcal/mol)
|
Des Pol
Polar desolvation
(kcal/mol)
|
H Don
H-bond donors
|
H Acc
H-bond acceptors
|
Chg
Net charge
|
tPSA
(Ų)
|
MWT
Molecular weight
(g/mol)
|
RB
Rotatable bonds
|
DL |
|
Ref
Reference (pH 7)
|
4.01 |
10.12 |
-9.25 |
0 |
6 |
0 |
51 |
410.905 |
4 |
↓
|
|
|
|
Analogs
Draw
Identity
99%
90%
80%
70%
Vendors
And 2 More
Physical Representations
|
Type
pH range
|
xlogP
|
Des A‑Pol
Apolar desolvation
(kcal/mol)
|
Des Pol
Polar desolvation
(kcal/mol)
|
H Don
H-bond donors
|
H Acc
H-bond acceptors
|
Chg
Net charge
|
tPSA
(Ų)
|
MWT
Molecular weight
(g/mol)
|
RB
Rotatable bonds
|
DL |
|
Ref
Reference (pH 7)
|
3.94 |
9.22 |
-9.92 |
1 |
6 |
0 |
61 |
396.878 |
4 |
↓
|
|
Ref
Reference (pH 7)
|
3.94 |
9.38 |
-10.69 |
1 |
6 |
0 |
61 |
396.878 |
4 |
↓
|
|
|
|
Analogs
Draw
Identity
99%
90%
80%
70%
Vendors
Clustered Target Annotations
| Code |
Organism Class |
Affinity (nM) |
LE (kcal/mol/atom) |
Type |
|
KCNH2-1-E |
HERG (cluster #1 Of 5), Eukaryotic |
Eukaryotes |
3000 |
0.23 |
Binding ≤ 10μM
|
|
GP119-1-E |
Glucose-dependent Insulinotropic Receptor (cluster #1 Of 1), Eukaryotic |
Eukaryotes |
23 |
0.32 |
Functional ≤ 10μM
|
|
CP2C9-1-E |
Cytochrome P450 2C9 (cluster #1 Of 3), Eukaryotic |
Eukaryotes |
100 |
0.30 |
ADME/T ≤ 10μM
|
Physical Representations
|
Type
pH range
|
xlogP
|
Des A‑Pol
Apolar desolvation
(kcal/mol)
|
Des Pol
Polar desolvation
(kcal/mol)
|
H Don
H-bond donors
|
H Acc
H-bond acceptors
|
Chg
Net charge
|
tPSA
(Ų)
|
MWT
Molecular weight
(g/mol)
|
RB
Rotatable bonds
|
DL |
|
Ref
Reference (pH 7)
|
0.99 |
7.48 |
-21.41 |
0 |
10 |
0 |
117 |
477.518 |
6 |
↓
|
|
|
|
Analogs
Draw
Identity
99%
90%
80%
70%
Vendors
Clustered Target Annotations
| Code |
Organism Class |
Affinity (nM) |
LE (kcal/mol/atom) |
Type |
|
CP2A6-4-E |
Cytochrome P450 2A6 (cluster #4 Of 5), Eukaryotic |
Eukaryotes |
40 |
0.80 |
ADME/T ≤ 10μM
|
|
CP2C9-3-E |
Cytochrome P450 2C9 (cluster #3 Of 3), Eukaryotic |
Eukaryotes |
5900 |
0.56 |
ADME/T ≤ 10μM
|
|
CP2D6-2-E |
Cytochrome P450 2D6 (cluster #2 Of 3), Eukaryotic |
Eukaryotes |
5700 |
0.56 |
ADME/T ≤ 10μM
|
Physical Representations
|
Type
pH range
|
xlogP
|
Des A‑Pol
Apolar desolvation
(kcal/mol)
|
Des Pol
Polar desolvation
(kcal/mol)
|
H Don
H-bond donors
|
H Acc
H-bond acceptors
|
Chg
Net charge
|
tPSA
(Ų)
|
MWT
Molecular weight
(g/mol)
|
RB
Rotatable bonds
|
DL |
|
Ref
Reference (pH 7)
|
1.23 |
2.65 |
-48.73 |
3 |
3 |
1 |
54 |
175.211 |
2 |
↓
|
|
Lo
Low (pH 4.5-6)
|
1.23 |
2.93 |
-89.93 |
4 |
3 |
2 |
55 |
176.219 |
2 |
↓
|
|
|
|
Analogs
Draw
Identity
99%
90%
80%
70%
Vendors
And 1 More
Clustered Target Annotations
| Code |
Organism Class |
Affinity (nM) |
LE (kcal/mol/atom) |
Type |
|
ABL1-1-E |
Tyrosine-protein Kinase ABL (cluster #1 Of 1), Eukaryotic |
Eukaryotes |
7800 |
0.20 |
Binding ≤ 10μM |
|
AURKA-2-E |
Serine/threonine-protein Kinase Aurora-A (cluster #2 Of 3), Eukaryotic |
Eukaryotes |
290 |
0.26 |
Binding ≤ 10μM |
|
FGFR1-1-E |
Fibroblast Growth Factor Receptor 1 (cluster #1 Of 1), Eukaryotic |
Eukaryotes |
65 |
0.29 |
Binding ≤ 10μM |
|
FGFR2-1-E |
Fibroblast Growth Factor Receptor 2 (cluster #1 Of 1), Eukaryotic |
Eukaryotes |
39 |
0.30 |
Binding ≤ 10μM |
|
FGFR3-1-E |
Fibroblast Growth Factor Receptor 3 (cluster #1 Of 1), Eukaryotic |
Eukaryotes |
50 |
0.29 |
Binding ≤ 10μM |
|
FLT3-1-E |
Tyrosine-protein Kinase Receptor FLT3 (cluster #1 Of 1), Eukaryotic |
Eukaryotes |
22 |
0.31 |
Binding ≤ 10μM |
|
JAK2-1-E |
Tyrosine-protein Kinase JAK2 (cluster #1 Of 1), Eukaryotic |
Eukaryotes |
230 |
0.27 |
Binding ≤ 10μM |
|
MERTK-1-E |
Proto-oncogene Tyrosine-protein Kinase MER (cluster #1 Of 1), Eukaryotic |
Eukaryotes |
24 |
0.30 |
Binding ≤ 10μM |
|
MET-1-E |
Hepatocyte Growth Factor Receptor (cluster #1 Of 1), Eukaryotic |
Eukaryotes |
2 |
0.35 |
Binding ≤ 10μM |
|
NTRK1-1-E |
Nerve Growth Factor Receptor Trk-A (cluster #1 Of 1), Eukaryotic |
Eukaryotes |
46 |
0.29 |
Binding ≤ 10μM |
|
NTRK2-1-E |
Neurotrophic Tyrosine Kinase Receptor Type 2 (cluster #1 Of 1), Eukaryotic |
Eukaryotes |
61 |
0.29 |
Binding ≤ 10μM |
|
PGFRA-1-E |
Platelet-derived Growth Factor Receptor Alpha (cluster #1 Of 2), Eukaryotic |
Eukaryotes |
100 |
0.28 |
Binding ≤ 10μM |
|
RET-1-E |
Tyrosine-protein Kinase Receptor RET (cluster #1 Of 1), Eukaryotic |
Eukaryotes |
640 |
0.25 |
Binding ≤ 10μM |
|
RON-1-E |
Macrophage-stimulating Protein Receptor (cluster #1 Of 1), Eukaryotic |
Eukaryotes |
7 |
0.33 |
Binding ≤ 10μM |
|
VGFR1-1-E |
Vascular Endothelial Growth Factor Receptor 1 (cluster #1 Of 1), Eukaryotic |
Eukaryotes |
10 |
0.32 |
Binding ≤ 10μM |
|
VGFR2-1-E |
Vascular Endothelial Growth Factor Receptor 2 (cluster #1 Of 2), Eukaryotic |
Eukaryotes |
44 |
0.29 |
Binding ≤ 10μM |
|
VGFR3-1-E |
Vascular Endothelial Growth Factor Receptor 3 (cluster #1 Of 2), Eukaryotic |
Eukaryotes |
78 |
0.28 |
Binding ≤ 10μM |
|
CP2C9-1-E |
Cytochrome P450 2C9 (cluster #1 Of 3), Eukaryotic |
Eukaryotes |
1200 |
0.24 |
ADME/T ≤ 10μM |
|
CP3A4-2-E |
Cytochrome P450 3A4 (cluster #2 Of 4), Eukaryotic |
Eukaryotes |
7100 |
0.21 |
ADME/T ≤ 10μM |
|
Z50594-1-O |
Mus Musculus (cluster #1 Of 9), Other |
Other |
1000 |
0.24 |
Functional ≤ 10μM |
Physical Representations
|
Type
pH range
|
xlogP
|
Des A‑Pol
Apolar desolvation
(kcal/mol)
|
Des Pol
Polar desolvation
(kcal/mol)
|
H Don
H-bond donors
|
H Acc
H-bond acceptors
|
Chg
Net charge
|
tPSA
(Ų)
|
MWT
Molecular weight
(g/mol)
|
RB
Rotatable bonds
|
DL |
|
Ref
Reference (pH 7)
|
1.72 |
5.04 |
-16.82 |
1 |
10 |
0 |
116 |
495.561 |
6 |
↓
|
|
Mid
Mid (pH 6-8)
|
1.72 |
5.56 |
-53.48 |
0 |
10 |
-1 |
118 |
494.553 |
6 |
↓
|
|
|
|
Analogs
Draw
Identity
99%
90%
80%
70%
Vendors
And 11 More
Clustered Target Annotations
| Code |
Organism Class |
Affinity (nM) |
LE (kcal/mol/atom) |
Type |
|
IKKB-1-E |
Inhibitor Of Nuclear Factor Kappa B Kinase Beta Subunit (cluster #1 Of 1), Eukaryotic |
Eukaryotes |
5000 |
0.46 |
Binding ≤ 10μM |
|
CP2C9-1-E |
Cytochrome P450 2C9 (cluster #1 Of 3), Eukaryotic |
Eukaryotes |
7000 |
0.45 |
ADME/T ≤ 10μM
|
|
CP2CJ-1-E |
Cytochrome P450 2C19 (cluster #1 Of 3), Eukaryotic |
Eukaryotes |
4000 |
0.47 |
ADME/T ≤ 10μM
|
|
CP3A4-2-E |
Cytochrome P450 3A4 (cluster #2 Of 4), Eukaryotic |
Eukaryotes |
2000 |
0.50 |
ADME/T ≤ 10μM
|
Physical Representations
|
Type
pH range
|
xlogP
|
Des A‑Pol
Apolar desolvation
(kcal/mol)
|
Des Pol
Polar desolvation
(kcal/mol)
|
H Don
H-bond donors
|
H Acc
H-bond acceptors
|
Chg
Net charge
|
tPSA
(Ų)
|
MWT
Molecular weight
(g/mol)
|
RB
Rotatable bonds
|
DL |
|
Ref
Reference (pH 7)
|
2.15 |
-3.32 |
-7.82 |
4 |
3 |
0 |
69 |
236.271 |
2 |
↓
|
|
|
|
Analogs
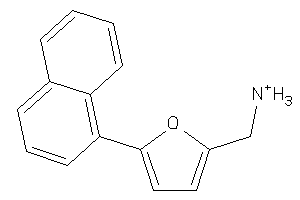
-
34975325
-
-
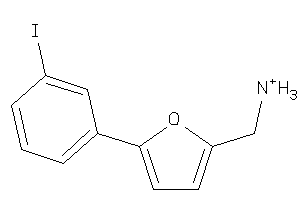
34975333
-
-
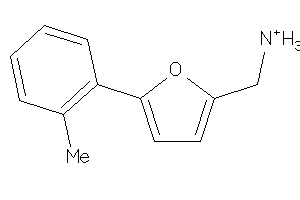
36984526
-
Draw
Identity
99%
90%
80%
70%
Vendors
And 10 More
Clustered Target Annotations
| Code |
Organism Class |
Affinity (nM) |
LE (kcal/mol/atom) |
Type |
|
CP2A6-1-E |
Cytochrome P450 2A6 (cluster #1 Of 5), Eukaryotic |
Eukaryotes |
600 |
0.67 |
ADME/T ≤ 10μM
|
|
CP2B6-3-E |
Cytochrome P450 2B6 (cluster #3 Of 4), Eukaryotic |
Eukaryotes |
3800 |
0.58 |
ADME/T ≤ 10μM
|
|
CP2C9-1-E |
Cytochrome P450 2C9 (cluster #1 Of 3), Eukaryotic |
Eukaryotes |
900 |
0.65 |
ADME/T ≤ 10μM
|
|
CP2E1-2-E |
Cytochrome P450 2E1 (cluster #2 Of 3), Eukaryotic |
Eukaryotes |
800 |
0.66 |
ADME/T ≤ 10μM
|
Physical Representations
|
Type
pH range
|
xlogP
|
Des A‑Pol
Apolar desolvation
(kcal/mol)
|
Des Pol
Polar desolvation
(kcal/mol)
|
H Don
H-bond donors
|
H Acc
H-bond acceptors
|
Chg
Net charge
|
tPSA
(Ų)
|
MWT
Molecular weight
(g/mol)
|
RB
Rotatable bonds
|
DL |
|
Ref
Reference (pH 7)
|
2.30 |
4.42 |
-45.89 |
3 |
2 |
1 |
41 |
174.223 |
2 |
↓
|
|
|
|
|
|
|
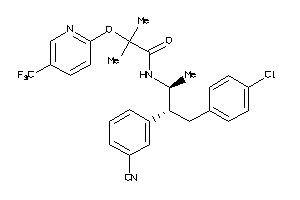
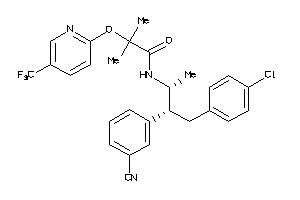
Analogs
-
34326985
-
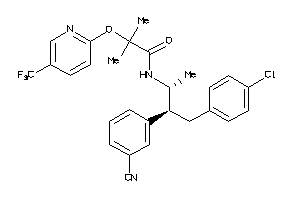
-
34326988
-
-
34326990
-
Draw
Identity
99%
90%
80%
70%
Vendors
And 1 More
Physical Representations
|
Type
pH range
|
xlogP
|
Des A‑Pol
Apolar desolvation
(kcal/mol)
|
Des Pol
Polar desolvation
(kcal/mol)
|
H Don
H-bond donors
|
H Acc
H-bond acceptors
|
Chg
Net charge
|
tPSA
(Ų)
|
MWT
Molecular weight
(g/mol)
|
RB
Rotatable bonds
|
DL |
|
Ref
Reference (pH 7)
|
6.52 |
14.96 |
-18.07 |
1 |
5 |
0 |
75 |
515.963 |
9 |
↓
|
|
|
|
Analogs
-
3995475
-
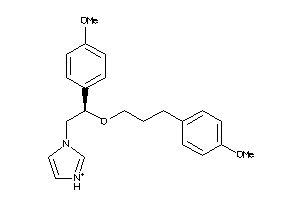
Draw
Identity
99%
90%
80%
70%
Vendors
And 7 More
Clustered Target Annotations
| Code |
Organism Class |
Affinity (nM) |
LE (kcal/mol/atom) |
Type |
|
CP2C9-1-E |
Cytochrome P450 2C9 (cluster #1 Of 3), Eukaryotic |
Eukaryotes |
220 |
0.35 |
ADME/T ≤ 10μM
|
|
CP3A4-2-E |
Cytochrome P450 3A4 (cluster #2 Of 4), Eukaryotic |
Eukaryotes |
45 |
0.38 |
ADME/T ≤ 10μM
|
|
Z50425-3-O |
Plasmodium Falciparum (cluster #3 Of 22), Other |
Other |
1995 |
0.30 |
Functional ≤ 10μM
|
Physical Representations
|
Type
pH range
|
xlogP
|
Des A‑Pol
Apolar desolvation
(kcal/mol)
|
Des Pol
Polar desolvation
(kcal/mol)
|
H Don
H-bond donors
|
H Acc
H-bond acceptors
|
Chg
Net charge
|
tPSA
(Ų)
|
MWT
Molecular weight
(g/mol)
|
RB
Rotatable bonds
|
DL |
|
Ref
Reference (pH 7)
|
4.00 |
12.14 |
-43.58 |
1 |
5 |
1 |
47 |
367.469 |
10 |
↓
|
|
Mid
Mid (pH 6-8)
|
4.00 |
11.63 |
-10.16 |
0 |
5 |
0 |
46 |
366.461 |
10 |
↓
|
|
|
|
Analogs
-
2560257
-
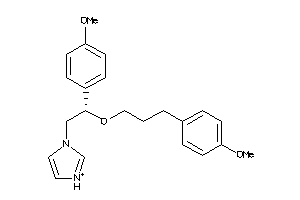
Draw
Identity
99%
90%
80%
70%
Vendors
And 7 More
Clustered Target Annotations
| Code |
Organism Class |
Affinity (nM) |
LE (kcal/mol/atom) |
Type |
|
CP2C9-1-E |
Cytochrome P450 2C9 (cluster #1 Of 3), Eukaryotic |
Eukaryotes |
220 |
0.35 |
ADME/T ≤ 10μM
|
|
CP3A4-2-E |
Cytochrome P450 3A4 (cluster #2 Of 4), Eukaryotic |
Eukaryotes |
45 |
0.38 |
ADME/T ≤ 10μM
|
|
Z50425-3-O |
Plasmodium Falciparum (cluster #3 Of 22), Other |
Other |
1995 |
0.30 |
Functional ≤ 10μM
|
Physical Representations
|
Type
pH range
|
xlogP
|
Des A‑Pol
Apolar desolvation
(kcal/mol)
|
Des Pol
Polar desolvation
(kcal/mol)
|
H Don
H-bond donors
|
H Acc
H-bond acceptors
|
Chg
Net charge
|
tPSA
(Ų)
|
MWT
Molecular weight
(g/mol)
|
RB
Rotatable bonds
|
DL |
|
Ref
Reference (pH 7)
|
4.00 |
11.63 |
-42.4 |
1 |
5 |
1 |
47 |
367.469 |
10 |
↓
|
|
Mid
Mid (pH 6-8)
|
4.00 |
11.12 |
-9.76 |
0 |
5 |
0 |
46 |
366.461 |
10 |
↓
|
|
|
|
Analogs
Draw
Identity
99%
90%
80%
70%
Vendors
And 2 More
Clustered Target Annotations
| Code |
Organism Class |
Affinity (nM) |
LE (kcal/mol/atom) |
Type |
|
AKT1-2-E |
RAC-alpha Serine/threonine-protein Kinase (cluster #2 Of 3), Eukaryotic |
Eukaryotes |
3 |
0.50 |
Binding ≤ 10μM
|
|
AKT2-2-E |
Serine/threonine-protein Kinase AKT2 (cluster #2 Of 2), Eukaryotic |
Eukaryotes |
6 |
0.48 |
Binding ≤ 10μM
|
|
GSK3B-1-E |
Glycogen Synthase Kinase-3 Beta (cluster #1 Of 7), Eukaryotic |
Eukaryotes |
660 |
0.36 |
Binding ≤ 10μM
|
|
KS6B1-1-E |
Ribosomal Protein S6 Kinase 1 (cluster #1 Of 2), Eukaryotic |
Eukaryotes |
120 |
0.40 |
Binding ≤ 10μM
|
|
CP2C9-1-E |
Cytochrome P450 2C9 (cluster #1 Of 3), Eukaryotic |
Eukaryotes |
10000 |
0.29 |
ADME/T ≤ 10μM
|
|
CP2D6-1-E |
Cytochrome P450 2D6 (cluster #1 Of 3), Eukaryotic |
Eukaryotes |
660 |
0.36 |
ADME/T ≤ 10μM
|
Physical Representations
|
Type
pH range
|
xlogP
|
Des A‑Pol
Apolar desolvation
(kcal/mol)
|
Des Pol
Polar desolvation
(kcal/mol)
|
H Don
H-bond donors
|
H Acc
H-bond acceptors
|
Chg
Net charge
|
tPSA
(Ų)
|
MWT
Molecular weight
(g/mol)
|
RB
Rotatable bonds
|
DL |
|
Ref
Reference (pH 7)
|
3.13 |
7.97 |
-51.16 |
4 |
5 |
1 |
72 |
342.854 |
3 |
↓
|
|
|
|
Analogs
Draw
Identity
99%
90%
80%
70%
Vendors
And 8 More
Clustered Target Annotations
| Code |
Organism Class |
Affinity (nM) |
LE (kcal/mol/atom) |
Type |
|
CP2C9-1-E |
Cytochrome P450 2C9 (cluster #1 Of 3), Eukaryotic |
Eukaryotes |
4300 |
0.38 |
ADME/T ≤ 10μM
|
Physical Representations
|
Type
pH range
|
xlogP
|
Des A‑Pol
Apolar desolvation
(kcal/mol)
|
Des Pol
Polar desolvation
(kcal/mol)
|
H Don
H-bond donors
|
H Acc
H-bond acceptors
|
Chg
Net charge
|
tPSA
(Ų)
|
MWT
Molecular weight
(g/mol)
|
RB
Rotatable bonds
|
DL |
|
Ref
Reference (pH 7)
|
3.81 |
8.51 |
-46.08 |
0 |
4 |
-1 |
66 |
330.168 |
5 |
↓
|
|
|
|
Analogs
-
1550212
-
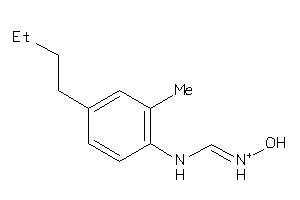
Draw
Identity
99%
90%
80%
70%
Vendors
And 3 More
Physical Representations
|
Type
pH range
|
xlogP
|
Des A‑Pol
Apolar desolvation
(kcal/mol)
|
Des Pol
Polar desolvation
(kcal/mol)
|
H Don
H-bond donors
|
H Acc
H-bond acceptors
|
Chg
Net charge
|
tPSA
(Ų)
|
MWT
Molecular weight
(g/mol)
|
RB
Rotatable bonds
|
DL |
|
Ref
Reference (pH 7)
|
3.57 |
6.95 |
-6.04 |
2 |
3 |
0 |
45 |
206.289 |
5 |
↓
|
|
|
|
Analogs
-
59594697
-
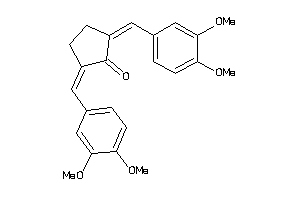
-
4547063
-
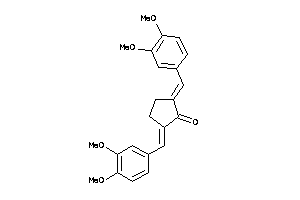
-
1024616
-
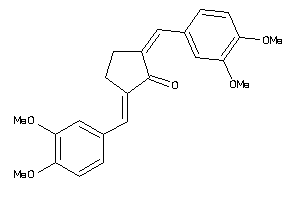
Draw
Identity
99%
90%
80%
70%
Vendors
And 1 More
Clustered Target Annotations
| Code |
Organism Class |
Affinity (nM) |
LE (kcal/mol/atom) |
Type |
|
CP2C9-2-E |
Cytochrome P450 2C9 (cluster #2 Of 3), Eukaryotic |
Eukaryotes |
2800 |
0.30 |
ADME/T ≤ 10μM
|
Physical Representations
|
Type
pH range
|
xlogP
|
Des A‑Pol
Apolar desolvation
(kcal/mol)
|
Des Pol
Polar desolvation
(kcal/mol)
|
H Don
H-bond donors
|
H Acc
H-bond acceptors
|
Chg
Net charge
|
tPSA
(Ų)
|
MWT
Molecular weight
(g/mol)
|
RB
Rotatable bonds
|
DL |
|
Ref
Reference (pH 7)
|
3.14 |
5.56 |
-15.55 |
2 |
5 |
0 |
76 |
352.386 |
4 |
↓
|
|
|
|
|
|
|
Analogs
-
2383073
-

Draw
Identity
99%
90%
80%
70%
Vendors
Clustered Target Annotations
| Code |
Organism Class |
Affinity (nM) |
LE (kcal/mol/atom) |
Type |
|
CP2C9-1-E |
Cytochrome P450 2C9 (cluster #1 Of 3), Eukaryotic |
Eukaryotes |
8100 |
0.36 |
ADME/T ≤ 10μM
|
|
CP3A4-4-E |
Cytochrome P450 3A4 (cluster #4 Of 4), Eukaryotic |
Eukaryotes |
130 |
0.48 |
ADME/T ≤ 10μM
|
Physical Representations
|
Type
pH range
|
xlogP
|
Des A‑Pol
Apolar desolvation
(kcal/mol)
|
Des Pol
Polar desolvation
(kcal/mol)
|
H Don
H-bond donors
|
H Acc
H-bond acceptors
|
Chg
Net charge
|
tPSA
(Ų)
|
MWT
Molecular weight
(g/mol)
|
RB
Rotatable bonds
|
DL |
|
Ref
Reference (pH 7)
|
3.24 |
10.03 |
-7.95 |
0 |
4 |
0 |
40 |
377.069 |
3 |
↓
|
|
|
|
Analogs
-
2383073
-

Draw
Identity
99%
90%
80%
70%
Vendors
Clustered Target Annotations
| Code |
Organism Class |
Affinity (nM) |
LE (kcal/mol/atom) |
Type |
|
CP2C9-1-E |
Cytochrome P450 2C9 (cluster #1 Of 3), Eukaryotic |
Eukaryotes |
8100 |
0.36 |
ADME/T ≤ 10μM
|
|
CP3A4-4-E |
Cytochrome P450 3A4 (cluster #4 Of 4), Eukaryotic |
Eukaryotes |
130 |
0.48 |
ADME/T ≤ 10μM
|
Physical Representations
|
Type
pH range
|
xlogP
|
Des A‑Pol
Apolar desolvation
(kcal/mol)
|
Des Pol
Polar desolvation
(kcal/mol)
|
H Don
H-bond donors
|
H Acc
H-bond acceptors
|
Chg
Net charge
|
tPSA
(Ų)
|
MWT
Molecular weight
(g/mol)
|
RB
Rotatable bonds
|
DL |
|
Ref
Reference (pH 7)
|
3.24 |
10.16 |
-6.26 |
0 |
4 |
0 |
40 |
377.069 |
3 |
↓
|
|
|
|
Analogs
-
2383073
-

Draw
Identity
99%
90%
80%
70%
Vendors
Clustered Target Annotations
| Code |
Organism Class |
Affinity (nM) |
LE (kcal/mol/atom) |
Type |
|
CP2C9-1-E |
Cytochrome P450 2C9 (cluster #1 Of 3), Eukaryotic |
Eukaryotes |
8100 |
0.36 |
ADME/T ≤ 10μM
|
|
CP3A4-4-E |
Cytochrome P450 3A4 (cluster #4 Of 4), Eukaryotic |
Eukaryotes |
130 |
0.48 |
ADME/T ≤ 10μM
|
Physical Representations
|
Type
pH range
|
xlogP
|
Des A‑Pol
Apolar desolvation
(kcal/mol)
|
Des Pol
Polar desolvation
(kcal/mol)
|
H Don
H-bond donors
|
H Acc
H-bond acceptors
|
Chg
Net charge
|
tPSA
(Ų)
|
MWT
Molecular weight
(g/mol)
|
RB
Rotatable bonds
|
DL |
|
Ref
Reference (pH 7)
|
3.24 |
10.16 |
-8.34 |
0 |
4 |
0 |
40 |
377.069 |
3 |
↓
|
|
|
|
Analogs
Draw
Identity
99%
90%
80%
70%
Vendors
Physical Representations
|
Type
pH range
|
xlogP
|
Des A‑Pol
Apolar desolvation
(kcal/mol)
|
Des Pol
Polar desolvation
(kcal/mol)
|
H Don
H-bond donors
|
H Acc
H-bond acceptors
|
Chg
Net charge
|
tPSA
(Ų)
|
MWT
Molecular weight
(g/mol)
|
RB
Rotatable bonds
|
DL |
|
Ref
Reference (pH 7)
|
4.50 |
0.51 |
-59.9 |
3 |
10 |
1 |
112 |
647.752 |
11 |
↓
|
|
|
|
Analogs
Draw
Identity
99%
90%
80%
70%
Vendors
And 4 More
Clustered Target Annotations
| Code |
Organism Class |
Affinity (nM) |
LE (kcal/mol/atom) |
Type |
|
CP2A6-4-E |
Cytochrome P450 2A6 (cluster #4 Of 5), Eukaryotic |
Eukaryotes |
80 |
0.76 |
ADME/T ≤ 10μM
|
|
CP2C9-3-E |
Cytochrome P450 2C9 (cluster #3 Of 3), Eukaryotic |
Eukaryotes |
8900 |
0.54 |
ADME/T ≤ 10μM
|
|
CP2CJ-1-E |
Cytochrome P450 2C19 (cluster #1 Of 3), Eukaryotic |
Eukaryotes |
2000 |
0.61 |
ADME/T ≤ 10μM
|
Physical Representations
|
Type
pH range
|
xlogP
|
Des A‑Pol
Apolar desolvation
(kcal/mol)
|
Des Pol
Polar desolvation
(kcal/mol)
|
H Don
H-bond donors
|
H Acc
H-bond acceptors
|
Chg
Net charge
|
tPSA
(Ų)
|
MWT
Molecular weight
(g/mol)
|
RB
Rotatable bonds
|
DL |
|
Ref
Reference (pH 7)
|
1.87 |
3.65 |
-48.44 |
3 |
2 |
1 |
41 |
191.279 |
2 |
↓
|
|
Lo
Low (pH 4.5-6)
|
1.87 |
3.92 |
-87.82 |
4 |
2 |
2 |
42 |
192.287 |
2 |
↓
|
|
|
|
Analogs
Draw
Identity
99%
90%
80%
70%
Vendors
And 6 More
Clustered Target Annotations
| Code |
Organism Class |
Affinity (nM) |
LE (kcal/mol/atom) |
Type |
|
CP2A6-1-E |
Cytochrome P450 2A6 (cluster #1 Of 5), Eukaryotic |
Eukaryotes |
90 |
0.99 |
ADME/T ≤ 10μM
|
|
CP2C9-3-E |
Cytochrome P450 2C9 (cluster #3 Of 3), Eukaryotic |
Eukaryotes |
1200 |
0.83 |
ADME/T ≤ 10μM
|
Physical Representations
|
Type
pH range
|
xlogP
|
Des A‑Pol
Apolar desolvation
(kcal/mol)
|
Des Pol
Polar desolvation
(kcal/mol)
|
H Don
H-bond donors
|
H Acc
H-bond acceptors
|
Chg
Net charge
|
tPSA
(Ų)
|
MWT
Molecular weight
(g/mol)
|
RB
Rotatable bonds
|
DL |
|
Ref
Reference (pH 7)
|
-0.29 |
2.25 |
-48.3 |
3 |
2 |
1 |
41 |
133.174 |
0 |
↓
|
|
Lo
Low (pH 4.5-6)
|
-0.29 |
2.53 |
-92.62 |
4 |
2 |
2 |
42 |
134.182 |
0 |
↓
|
|
|
|
Analogs
-
3944782
-

-
596881
-

Draw
Identity
99%
90%
80%
70%
Vendors
And 50 More
Clustered Target Annotations
| Code |
Organism Class |
Affinity (nM) |
LE (kcal/mol/atom) |
Type |
|
AMPC-1-B |
Beta-lactamase (cluster #1 Of 6), Bacterial |
Bacteria |
5 |
0.46 |
Binding ≤ 10μM
|
|
CP51-1-B |
Sterol 14-alpha Demethylase (cluster #1 Of 2), Bacterial |
Bacteria |
200 |
0.38 |
Binding ≤ 10μM
|
|
CP17A-1-E |
Cytochrome P450 17A1 (cluster #1 Of 2), Eukaryotic |
Eukaryotes |
243 |
0.37 |
Binding ≤ 10μM
|
|
CP19A-3-E |
Cytochrome P450 19A1 (cluster #3 Of 3), Eukaryotic |
Eukaryotes |
400 |
0.36 |
Binding ≤ 10μM
|
|
CP51A-1-E |
Cytochrome P450 51 (cluster #1 Of 2), Eukaryotic |
Eukaryotes |
200 |
0.38 |
Binding ≤ 10μM
|
|
GRM6-2-E |
Metabotropic Glutamate Receptor 6 (cluster #2 Of 2), Eukaryotic |
Eukaryotes |
6500 |
0.29 |
Functional ≤ 10μM
|
|
MDR1-1-E |
P-glycoprotein 1 (cluster #1 Of 2), Eukaryotic |
Eukaryotes |
3500 |
0.31 |
Functional ≤ 10μM
|
|
MDR3-1-E |
P-glycoprotein 3 (cluster #1 Of 2), Eukaryotic |
Eukaryotes |
7800 |
0.29 |
Functional ≤ 10μM
|
|
CP2C9-1-E |
Cytochrome P450 2C9 (cluster #1 Of 3), Eukaryotic |
Eukaryotes |
6000 |
0.29 |
ADME/T ≤ 10μM
|
|
CP3A4-2-E |
Cytochrome P450 3A4 (cluster #2 Of 4), Eukaryotic |
Eukaryotes |
851 |
0.34 |
ADME/T ≤ 10μM
|
|
Z102121-2-O |
Trichophyton Mentagrophytes (cluster #2 Of 3), Other |
Other |
400 |
0.36 |
Functional ≤ 10μM
|
|
Z50038-1-O |
Plasmodium Yoelii Yoelii (cluster #1 Of 2), Other |
Other |
2 |
0.49 |
Functional ≤ 10μM
|
|
Z50046-1-O |
Trichophyton Quinckeanum (cluster #1 Of 2), Other |
Other |
790 |
0.34 |
Functional ≤ 10μM
|
|
Z50408-1-O |
Issatchenkia Orientalis (cluster #1 Of 2), Other |
Other |
1400 |
0.33 |
Functional ≤ 10μM
|
|
Z50409-1-O |
Kluyveromyces Marxianus (cluster #1 Of 2), Other |
Other |
30 |
0.42 |
Functional ≤ 10μM
|
|
Z50416-1-O |
Aspergillus Fumigatus (cluster #1 Of 3), Other |
Other |
1900 |
0.32 |
Functional ≤ 10μM
|
|
Z50442-1-O |
Candida Albicans (cluster #1 Of 4), Other |
Other |
300 |
0.37 |
Functional ≤ 10μM
|
|
Z50443-1-O |
Candida Glabrata (cluster #1 Of 1), Other |
Other |
120 |
0.39 |
Functional ≤ 10μM
|
|
Z50452-1-O |
Trichophyton Rubrum (cluster #1 Of 2), Other |
Other |
330 |
0.36 |
Functional ≤ 10μM
|
|
Z50459-2-O |
Leishmania Donovani (cluster #2 Of 8), Other |
Other |
6000 |
0.29 |
Functional ≤ 10μM
|
Physical Representations
|
Type
pH range
|
xlogP
|
Des A‑Pol
Apolar desolvation
(kcal/mol)
|
Des Pol
Polar desolvation
(kcal/mol)
|
H Don
H-bond donors
|
H Acc
H-bond acceptors
|
Chg
Net charge
|
tPSA
(Ų)
|
MWT
Molecular weight
(g/mol)
|
RB
Rotatable bonds
|
DL |
|
Ref
Reference (pH 7)
|
5.72 |
13.6 |
-35.01 |
1 |
3 |
1 |
28 |
417.143 |
6 |
↓
|
|
Mid
Mid (pH 6-8)
|
5.72 |
13.09 |
-6.46 |
0 |
3 |
0 |
27 |
416.135 |
6 |
↓
|
|
|
|
Analogs
Draw
Identity
99%
90%
80%
70%
Vendors
Physical Representations
|
Type
pH range
|
xlogP
|
Des A‑Pol
Apolar desolvation
(kcal/mol)
|
Des Pol
Polar desolvation
(kcal/mol)
|
H Don
H-bond donors
|
H Acc
H-bond acceptors
|
Chg
Net charge
|
tPSA
(Ų)
|
MWT
Molecular weight
(g/mol)
|
RB
Rotatable bonds
|
DL |
|
Ref
Reference (pH 7)
|
3.40 |
8.83 |
-13.65 |
2 |
6 |
0 |
80 |
407.783 |
6 |
↓
|
|
Lo
Low (pH 4.5-6)
|
3.40 |
9.27 |
-51.17 |
3 |
6 |
1 |
81 |
408.791 |
6 |
↓
|
|
|
|
Analogs
Draw
Identity
99%
90%
80%
70%
Vendors
And 12 More
Clustered Target Annotations
| Code |
Organism Class |
Affinity (nM) |
LE (kcal/mol/atom) |
Type |
|
CP1A2-1-E |
Cytochrome P450 1A2 (cluster #1 Of 3), Eukaryotic |
Eukaryotes |
10000 |
0.28 |
ADME/T ≤ 10μM
|
|
CP2C9-1-E |
Cytochrome P450 2C9 (cluster #1 Of 3), Eukaryotic |
Eukaryotes |
10000 |
0.28 |
ADME/T ≤ 10μM
|
|
CP2CJ-1-E |
Cytochrome P450 2C19 (cluster #1 Of 3), Eukaryotic |
Eukaryotes |
10000 |
0.28 |
ADME/T ≤ 10μM
|
|
CP2D6-1-E |
Cytochrome P450 2D6 (cluster #1 Of 3), Eukaryotic |
Eukaryotes |
10000 |
0.28 |
ADME/T ≤ 10μM
|
|
CP3A4-2-E |
Cytochrome P450 3A4 (cluster #2 Of 4), Eukaryotic |
Eukaryotes |
10000 |
0.28 |
ADME/T ≤ 10μM
|
Physical Representations
|
Type
pH range
|
xlogP
|
Des A‑Pol
Apolar desolvation
(kcal/mol)
|
Des Pol
Polar desolvation
(kcal/mol)
|
H Don
H-bond donors
|
H Acc
H-bond acceptors
|
Chg
Net charge
|
tPSA
(Ų)
|
MWT
Molecular weight
(g/mol)
|
RB
Rotatable bonds
|
DL |
|
Ref
Reference (pH 7)
|
0.25 |
6.96 |
-72.97 |
3 |
7 |
1 |
99 |
340.407 |
3 |
↓
|
|
Hi
High (pH 8-9.5)
|
8.62 |
18.14 |
-52.22 |
0 |
0 |
-1 |
0 |
421.61 |
5 |
↓
|
|