|
|
Analogs
Draw
Identity
99%
90%
80%
70%
Vendors
And 1 More
Clustered Target Annotations
| Code |
Organism Class |
Affinity (nM) |
LE (kcal/mol/atom) |
Type |
|
CP19A-3-E |
Cytochrome P450 19A1 (cluster #3 Of 3), Eukaryotic |
Eukaryotes |
160 |
0.59 |
Binding ≤ 10μM
|
Physical Representations
|
Type
pH range
|
xlogP
|
Des A‑Pol
Apolar desolvation
(kcal/mol)
|
Des Pol
Polar desolvation
(kcal/mol)
|
H Don
H-bond donors
|
H Acc
H-bond acceptors
|
Chg
Net charge
|
tPSA
(Ų)
|
MWT
Molecular weight
(g/mol)
|
RB
Rotatable bonds
|
DL |
|
Ref
Reference (pH 7)
|
1.76 |
9.75 |
-45.29 |
1 |
5 |
1 |
65 |
218.236 |
4 |
↓
|
|
Mid
Mid (pH 6-8)
|
1.76 |
9.24 |
-12.89 |
0 |
5 |
0 |
64 |
217.228 |
4 |
↓
|
|
|
|
Analogs
Draw
Identity
99%
90%
80%
70%
Vendors
And 45 More
Clustered Target Annotations
| Code |
Organism Class |
Affinity (nM) |
LE (kcal/mol/atom) |
Type |
|
ABCG2-1-E |
ATP-binding Cassette Sub-family G Member 2 (cluster #1 Of 2), Eukaryotic |
Eukaryotes |
2600 |
0.41 |
Binding ≤ 10μM
|
|
ALDR-1-E |
Aldose Reductase (cluster #1 Of 5), Eukaryotic |
Eukaryotes |
7790 |
0.38 |
Binding ≤ 10μM
|
|
AOFA-4-E |
Monoamine Oxidase A (cluster #4 Of 8), Eukaryotic |
Eukaryotes |
1600 |
0.43 |
Binding ≤ 10μM
|
|
AOFB-4-E |
Monoamine Oxidase B (cluster #4 Of 8), Eukaryotic |
Eukaryotes |
1600 |
0.43 |
Binding ≤ 10μM
|
|
CBR1-1-E |
Carbonyl Reductase [NADPH] 1 (cluster #1 Of 2), Eukaryotic |
Eukaryotes |
670 |
0.45 |
Binding ≤ 10μM
|
|
CCNB1-1-E |
G2/mitotic-specific Cyclin B1 (cluster #1 Of 2), Eukaryotic |
Eukaryotes |
6200 |
0.38 |
Binding ≤ 10μM
|
|
CCNB2-1-E |
G2/mitotic-specific Cyclin B2 (cluster #1 Of 2), Eukaryotic |
Eukaryotes |
6200 |
0.38 |
Binding ≤ 10μM
|
|
CCNB3-1-E |
G2/mitotic-specific Cyclin B3 (cluster #1 Of 2), Eukaryotic |
Eukaryotes |
6200 |
0.38 |
Binding ≤ 10μM
|
|
CDK1-1-E |
Cyclin-dependent Kinase 1 (cluster #1 Of 4), Eukaryotic |
Eukaryotes |
6200 |
0.38 |
Binding ≤ 10μM
|
|
CDK6-1-E |
Cyclin-dependent Kinase 6 (cluster #1 Of 1), Eukaryotic |
Eukaryotes |
6000 |
0.38 |
Binding ≤ 10μM
|
|
CP19A-3-E |
Cytochrome P450 19A1 (cluster #3 Of 3), Eukaryotic |
Eukaryotes |
2600 |
0.41 |
Binding ≤ 10μM
|
|
CP1B1-1-E |
Cytochrome P450 1B1 (cluster #1 Of 1), Eukaryotic |
Eukaryotes |
24 |
0.56 |
Binding ≤ 10μM
|
|
GBRA1-1-E |
GABA Receptor Alpha-1 Subunit (cluster #1 Of 8), Eukaryotic |
Eukaryotes |
3020 |
0.41 |
Binding ≤ 10μM
|
|
GBRA2-1-E |
GABA Receptor Alpha-2 Subunit (cluster #1 Of 8), Eukaryotic |
Eukaryotes |
3020 |
0.41 |
Binding ≤ 10μM
|
|
GBRA3-1-E |
GABA Receptor Alpha-3 Subunit (cluster #1 Of 8), Eukaryotic |
Eukaryotes |
3020 |
0.41 |
Binding ≤ 10μM
|
|
GBRA4-1-E |
GABA Receptor Alpha-4 Subunit (cluster #1 Of 7), Eukaryotic |
Eukaryotes |
3020 |
0.41 |
Binding ≤ 10μM
|
|
GBRA5-1-E |
GABA Receptor Alpha-5 Subunit (cluster #1 Of 8), Eukaryotic |
Eukaryotes |
3020 |
0.41 |
Binding ≤ 10μM
|
|
GBRA6-6-E |
GABA Receptor Alpha-6 Subunit (cluster #6 Of 8), Eukaryotic |
Eukaryotes |
3020 |
0.41 |
Binding ≤ 10μM
|
|
GSK3A-2-E |
Glycogen Synthase Kinase-3 Alpha (cluster #2 Of 3), Eukaryotic |
Eukaryotes |
7200 |
0.38 |
Binding ≤ 10μM
|
|
GSK3B-7-E |
Glycogen Synthase Kinase-3 Beta (cluster #7 Of 7), Eukaryotic |
Eukaryotes |
7200 |
0.38 |
Binding ≤ 10μM
|
|
Q965D6-1-E |
3-oxoacyl-acyl-carrier Protein Reductase (cluster #1 Of 2), Eukaryotic |
Eukaryotes |
10000 |
0.37 |
Binding ≤ 10μM
|
|
XDH-2-E |
Xanthine Dehydrogenase (cluster #2 Of 2), Eukaryotic |
Eukaryotes |
840 |
0.45 |
Binding ≤ 10μM
|
|
CP1A1-1-E |
Cytochrome P450 1A1 (cluster #1 Of 3), Eukaryotic |
Eukaryotes |
42 |
0.54 |
ADME/T ≤ 10μM
|
|
CP1A2-1-E |
Cytochrome P450 1A2 (cluster #1 Of 3), Eukaryotic |
Eukaryotes |
84 |
0.52 |
ADME/T ≤ 10μM
|
|
CP1B1-1-E |
Cytochrome P450 1B1 (cluster #1 Of 3), Eukaryotic |
Eukaryotes |
16 |
0.57 |
ADME/T ≤ 10μM
|
|
CP2C9-1-E |
Cytochrome P450 2C9 (cluster #1 Of 3), Eukaryotic |
Eukaryotes |
5225 |
0.39 |
ADME/T ≤ 10μM
|
|
Z104294-2-O |
Cyclin-dependent Kinase 5/CDK5 Activator 1 (cluster #2 Of 2), Other |
Other |
3100 |
0.41 |
Binding ≤ 10μM
|
|
Z104301-4-O |
GABA-A Receptor; Anion Channel (cluster #4 Of 8), Other |
Other |
920 |
0.44 |
Binding ≤ 10μM
|
|
Z50607-3-O |
Human Immunodeficiency Virus 1 (cluster #3 Of 10), Other |
Other |
5000 |
0.39 |
Functional ≤ 10μM |
|
Z80166-1-O |
HT-29 (Colon Adenocarcinoma Cells) (cluster #1 Of 12), Other |
Other |
3100 |
0.41 |
Functional ≤ 10μM
|
|
Z80470-1-O |
SGC-7901 (Gastric Carcinoma Cells) (cluster #1 Of 2), Other |
Other |
5800 |
0.39 |
Functional ≤ 10μM
|
Physical Representations
|
Type
pH range
|
xlogP
|
Des A‑Pol
Apolar desolvation
(kcal/mol)
|
Des Pol
Polar desolvation
(kcal/mol)
|
H Don
H-bond donors
|
H Acc
H-bond acceptors
|
Chg
Net charge
|
tPSA
(Ų)
|
MWT
Molecular weight
(g/mol)
|
RB
Rotatable bonds
|
DL |
|
Ref
Reference (pH 7)
|
2.94 |
3.96 |
-11.62 |
2 |
4 |
0 |
71 |
254.241 |
1 |
↓
|
|
Hi
High (pH 8-9.5)
|
2.94 |
4.94 |
-56.85 |
1 |
4 |
-1 |
73 |
253.233 |
1 |
↓
|
|
Mid
Mid (pH 6-8)
|
3.20 |
4.26 |
-45.71 |
1 |
4 |
-1 |
73 |
253.233 |
1 |
↓
|
|
|
|
Analogs
-
5162286
-
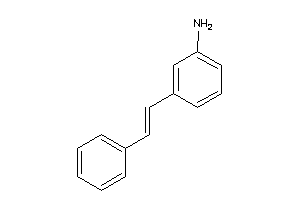
-
13404237
-
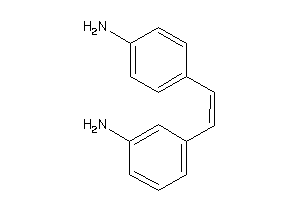
Draw
Identity
99%
90%
80%
70%
Vendors
Clustered Target Annotations
| Code |
Organism Class |
Affinity (nM) |
LE (kcal/mol/atom) |
Type |
|
CP19A-3-E |
Cytochrome P450 19A1 (cluster #3 Of 3), Eukaryotic |
Eukaryotes |
7470 |
0.45 |
Binding ≤ 10μM |
Physical Representations
|
Type
pH range
|
xlogP
|
Des A‑Pol
Apolar desolvation
(kcal/mol)
|
Des Pol
Polar desolvation
(kcal/mol)
|
H Don
H-bond donors
|
H Acc
H-bond acceptors
|
Chg
Net charge
|
tPSA
(Ų)
|
MWT
Molecular weight
(g/mol)
|
RB
Rotatable bonds
|
DL |
|
Ref
Reference (pH 7)
|
2.62 |
-1.95 |
-5.17 |
4 |
2 |
0 |
52 |
210.28 |
2 |
↓
|
|
|
|
Analogs
-
37054127
-
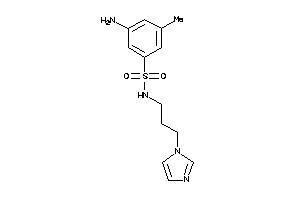
Draw
Identity
99%
90%
80%
70%
Vendors
And 8 More
Clustered Target Annotations
| Code |
Organism Class |
Affinity (nM) |
LE (kcal/mol/atom) |
Type |
|
CP19A-3-E |
Cytochrome P450 19A1 (cluster #3 Of 3), Eukaryotic |
Eukaryotes |
172 |
0.45 |
Binding ≤ 10μM
|
Physical Representations
|
Type
pH range
|
xlogP
|
Des A‑Pol
Apolar desolvation
(kcal/mol)
|
Des Pol
Polar desolvation
(kcal/mol)
|
H Don
H-bond donors
|
H Acc
H-bond acceptors
|
Chg
Net charge
|
tPSA
(Ų)
|
MWT
Molecular weight
(g/mol)
|
RB
Rotatable bonds
|
DL |
|
Ref
Reference (pH 7)
|
2.16 |
6.88 |
-14.98 |
1 |
5 |
0 |
64 |
307.419 |
6 |
↓
|
|
Mid
Mid (pH 6-8)
|
2.16 |
7.4 |
-42.47 |
2 |
5 |
1 |
65 |
308.427 |
6 |
↓
|
|
|
|
Analogs
Draw
Identity
99%
90%
80%
70%
Vendors
And 4 More
Clustered Target Annotations
| Code |
Organism Class |
Affinity (nM) |
LE (kcal/mol/atom) |
Type |
|
CP19A-3-E |
Cytochrome P450 19A1 (cluster #3 Of 3), Eukaryotic |
Eukaryotes |
64 |
0.46 |
Binding ≤ 10μM
|
Physical Representations
|
Type
pH range
|
xlogP
|
Des A‑Pol
Apolar desolvation
(kcal/mol)
|
Des Pol
Polar desolvation
(kcal/mol)
|
H Don
H-bond donors
|
H Acc
H-bond acceptors
|
Chg
Net charge
|
tPSA
(Ų)
|
MWT
Molecular weight
(g/mol)
|
RB
Rotatable bonds
|
DL |
|
Ref
Reference (pH 7)
|
2.23 |
4.78 |
-14.62 |
1 |
6 |
0 |
73 |
364.254 |
7 |
↓
|
|
Mid
Mid (pH 6-8)
|
2.23 |
5.28 |
-42.82 |
2 |
6 |
1 |
74 |
365.262 |
7 |
↓
|
|
|
|
Analogs
Draw
Identity
99%
90%
80%
70%
Vendors
And 30 More
Clustered Target Annotations
| Code |
Organism Class |
Affinity (nM) |
LE (kcal/mol/atom) |
Type |
|
CP17A-1-E |
Cytochrome P450 17A1 (cluster #1 Of 2), Eukaryotic |
Eukaryotes |
7170 |
0.48 |
Binding ≤ 10μM
|
|
CP19A-3-E |
Cytochrome P450 19A1 (cluster #3 Of 3), Eukaryotic |
Eukaryotes |
130 |
0.64 |
Binding ≤ 10μM
|
Physical Representations
|
Type
pH range
|
xlogP
|
Des A‑Pol
Apolar desolvation
(kcal/mol)
|
Des Pol
Polar desolvation
(kcal/mol)
|
H Don
H-bond donors
|
H Acc
H-bond acceptors
|
Chg
Net charge
|
tPSA
(Ų)
|
MWT
Molecular weight
(g/mol)
|
RB
Rotatable bonds
|
DL |
|
Ref
Reference (pH 7)
|
1.55 |
8.43 |
-13.79 |
0 |
5 |
0 |
64 |
203.201 |
3 |
↓
|
|
Mid
Mid (pH 6-8)
|
1.55 |
8.94 |
-46.96 |
1 |
5 |
1 |
65 |
204.209 |
3 |
↓
|
|
|
|
Analogs
-
44699428
-
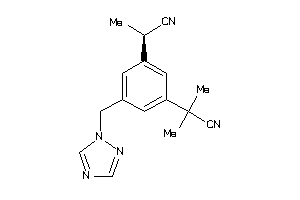
-
44699430
-
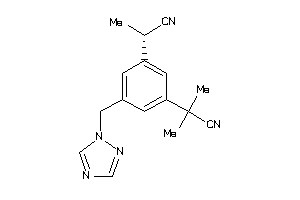
Draw
Identity
99%
90%
80%
70%
Vendors
And 24 More
Clustered Target Annotations
| Code |
Organism Class |
Affinity (nM) |
LE (kcal/mol/atom) |
Type |
|
CP19A-3-E |
Cytochrome P450 19A1 (cluster #3 Of 3), Eukaryotic |
Eukaryotes |
600 |
0.40 |
Binding ≤ 10μM
|
Physical Representations
|
Type
pH range
|
xlogP
|
Des A‑Pol
Apolar desolvation
(kcal/mol)
|
Des Pol
Polar desolvation
(kcal/mol)
|
H Don
H-bond donors
|
H Acc
H-bond acceptors
|
Chg
Net charge
|
tPSA
(Ų)
|
MWT
Molecular weight
(g/mol)
|
RB
Rotatable bonds
|
DL |
|
Ref
Reference (pH 7)
|
2.85 |
11.46 |
-17.13 |
0 |
5 |
0 |
78 |
293.374 |
4 |
↓
|
|
|
|
Analogs
-
39378571
-
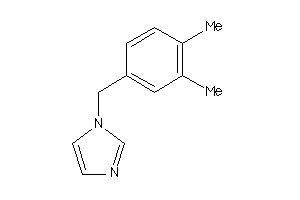
Draw
Identity
99%
90%
80%
70%
Vendors
And 43 More
Clustered Target Annotations
| Code |
Organism Class |
Affinity (nM) |
LE (kcal/mol/atom) |
Type |
|
C11B1-2-E |
Cytochrome P450 11B1 (cluster #2 Of 2), Eukaryotic |
Eukaryotes |
709 |
0.72 |
Binding ≤ 10μM
|
|
C11B2-1-E |
Cytochrome P450 11B2 (cluster #1 Of 2), Eukaryotic |
Eukaryotes |
456 |
0.74 |
Binding ≤ 10μM |
|
CP19A-3-E |
Cytochrome P450 19A1 (cluster #3 Of 3), Eukaryotic |
Eukaryotes |
150 |
0.80 |
Binding ≤ 10μM |
Physical Representations
|
Type
pH range
|
xlogP
|
Des A‑Pol
Apolar desolvation
(kcal/mol)
|
Des Pol
Polar desolvation
(kcal/mol)
|
H Don
H-bond donors
|
H Acc
H-bond acceptors
|
Chg
Net charge
|
tPSA
(Ų)
|
MWT
Molecular weight
(g/mol)
|
RB
Rotatable bonds
|
DL |
|
Ref
Reference (pH 7)
|
1.59 |
7.76 |
-7.27 |
0 |
2 |
0 |
18 |
158.204 |
2 |
↓
|
|
Mid
Mid (pH 6-8)
|
1.59 |
8.27 |
-32.69 |
1 |
2 |
1 |
19 |
159.212 |
2 |
↓
|
|
|
|
Analogs
Draw
Identity
99%
90%
80%
70%
Vendors
And 35 More
Clustered Target Annotations
| Code |
Organism Class |
Affinity (nM) |
LE (kcal/mol/atom) |
Type |
|
CP19A-3-E |
Cytochrome P450 19A1 (cluster #3 Of 3), Eukaryotic |
Eukaryotes |
8 |
0.52 |
Binding ≤ 10μM |
Physical Representations
|
Type
pH range
|
xlogP
|
Des A‑Pol
Apolar desolvation
(kcal/mol)
|
Des Pol
Polar desolvation
(kcal/mol)
|
H Don
H-bond donors
|
H Acc
H-bond acceptors
|
Chg
Net charge
|
tPSA
(Ų)
|
MWT
Molecular weight
(g/mol)
|
RB
Rotatable bonds
|
DL |
|
Ref
Reference (pH 7)
|
2.15 |
10.78 |
-13.32 |
0 |
5 |
0 |
78 |
285.31 |
3 |
↓
|
|
|
|
Analogs
Draw
Identity
99%
90%
80%
70%
Notice: Undefined index: field_name in /domains/zinc12/htdocs/lib/zinc/reporter/ZincAuxiliaryInfoReports.php on line 244
Notice: Undefined index: synonym in /domains/zinc12/htdocs/lib/zinc/reporter/ZincAuxiliaryInfoReports.php on line 245
Vendors
And 12 More
Clustered Target Annotations
| Code |
Organism Class |
Affinity (nM) |
LE (kcal/mol/atom) |
Type |
|
CP19A-3-E |
Cytochrome P450 19A1 (cluster #3 Of 3), Eukaryotic |
Eukaryotes |
1000 |
0.40 |
Binding ≤ 10μM
|
Physical Representations
|
Type
pH range
|
xlogP
|
Des A‑Pol
Apolar desolvation
(kcal/mol)
|
Des Pol
Polar desolvation
(kcal/mol)
|
H Don
H-bond donors
|
H Acc
H-bond acceptors
|
Chg
Net charge
|
tPSA
(Ų)
|
MWT
Molecular weight
(g/mol)
|
RB
Rotatable bonds
|
DL |
|
Ref
Reference (pH 7)
|
1.42 |
8.8 |
-50.17 |
2 |
7 |
1 |
94 |
289.315 |
6 |
↓
|
|
Mid
Mid (pH 6-8)
|
1.42 |
8.29 |
-19.7 |
1 |
7 |
0 |
93 |
288.307 |
6 |
↓
|
|
|
|
Analogs
Draw
Identity
99%
90%
80%
70%
Vendors
And 5 More
Clustered Target Annotations
| Code |
Organism Class |
Affinity (nM) |
LE (kcal/mol/atom) |
Type |
|
CP19A-3-E |
Cytochrome P450 19A1 (cluster #3 Of 3), Eukaryotic |
Eukaryotes |
2500 |
0.31 |
Binding ≤ 10μM
|
Physical Representations
|
Type
pH range
|
xlogP
|
Des A‑Pol
Apolar desolvation
(kcal/mol)
|
Des Pol
Polar desolvation
(kcal/mol)
|
H Don
H-bond donors
|
H Acc
H-bond acceptors
|
Chg
Net charge
|
tPSA
(Ų)
|
MWT
Molecular weight
(g/mol)
|
RB
Rotatable bonds
|
DL |
|
Ref
Reference (pH 7)
|
1.21 |
6.82 |
-48.14 |
2 |
7 |
1 |
86 |
363.463 |
9 |
↓
|
|
Mid
Mid (pH 6-8)
|
1.21 |
6.31 |
-20.85 |
1 |
7 |
0 |
84 |
362.455 |
9 |
↓
|
|
|
|
Analogs
Draw
Identity
99%
90%
80%
70%
Vendors
And 5 More
Clustered Target Annotations
| Code |
Organism Class |
Affinity (nM) |
LE (kcal/mol/atom) |
Type |
|
CP19A-3-E |
Cytochrome P450 19A1 (cluster #3 Of 3), Eukaryotic |
Eukaryotes |
190 |
0.55 |
Binding ≤ 10μM |
Physical Representations
|
Type
pH range
|
xlogP
|
Des A‑Pol
Apolar desolvation
(kcal/mol)
|
Des Pol
Polar desolvation
(kcal/mol)
|
H Don
H-bond donors
|
H Acc
H-bond acceptors
|
Chg
Net charge
|
tPSA
(Ų)
|
MWT
Molecular weight
(g/mol)
|
RB
Rotatable bonds
|
DL |
|
Ref
Reference (pH 7)
|
1.10 |
8.43 |
-18.59 |
0 |
6 |
0 |
81 |
231.211 |
4 |
↓
|
|
Mid
Mid (pH 6-8)
|
1.10 |
8.91 |
-48.84 |
1 |
6 |
1 |
82 |
232.219 |
4 |
↓
|
|
|
|
Analogs
Draw
Identity
99%
90%
80%
70%
Vendors
And 2 More
Clustered Target Annotations
| Code |
Organism Class |
Affinity (nM) |
LE (kcal/mol/atom) |
Type |
|
CP19A-3-E |
Cytochrome P450 19A1 (cluster #3 Of 3), Eukaryotic |
Eukaryotes |
119 |
0.44 |
Binding ≤ 10μM
|
Physical Representations
|
Type
pH range
|
xlogP
|
Des A‑Pol
Apolar desolvation
(kcal/mol)
|
Des Pol
Polar desolvation
(kcal/mol)
|
H Don
H-bond donors
|
H Acc
H-bond acceptors
|
Chg
Net charge
|
tPSA
(Ų)
|
MWT
Molecular weight
(g/mol)
|
RB
Rotatable bonds
|
DL |
|
Ref
Reference (pH 7)
|
0.47 |
4.01 |
-16.73 |
1 |
7 |
0 |
82 |
323.374 |
6 |
↓
|
|
Mid
Mid (pH 6-8)
|
0.47 |
4.53 |
-43.67 |
2 |
7 |
1 |
84 |
324.382 |
6 |
↓
|
|
|
|
Analogs
Draw
Identity
99%
90%
80%
70%
Vendors
Clustered Target Annotations
| Code |
Organism Class |
Affinity (nM) |
LE (kcal/mol/atom) |
Type |
|
CP19A-3-E |
Cytochrome P450 19A1 (cluster #3 Of 3), Eukaryotic |
Eukaryotes |
3100 |
0.27 |
Binding ≤ 10μM
|
Physical Representations
|
Type
pH range
|
xlogP
|
Des A‑Pol
Apolar desolvation
(kcal/mol)
|
Des Pol
Polar desolvation
(kcal/mol)
|
H Don
H-bond donors
|
H Acc
H-bond acceptors
|
Chg
Net charge
|
tPSA
(Ų)
|
MWT
Molecular weight
(g/mol)
|
RB
Rotatable bonds
|
DL |
|
Ref
Reference (pH 7)
|
1.39 |
10.63 |
-17.18 |
1 |
7 |
0 |
86 |
390.491 |
7 |
↓
|
|
Mid
Mid (pH 6-8)
|
1.39 |
11.11 |
-44.18 |
2 |
7 |
1 |
87 |
391.499 |
7 |
↓
|
|
Lo
Low (pH 4.5-6)
|
1.39 |
11.46 |
-83.95 |
3 |
7 |
2 |
88 |
392.507 |
7 |
↓
|
|
|
|
Analogs
Draw
Identity
99%
90%
80%
70%
Vendors
Clustered Target Annotations
| Code |
Organism Class |
Affinity (nM) |
LE (kcal/mol/atom) |
Type |
|
CP19A-3-E |
Cytochrome P450 19A1 (cluster #3 Of 3), Eukaryotic |
Eukaryotes |
248 |
0.40 |
Binding ≤ 10μM
|
Physical Representations
|
Type
pH range
|
xlogP
|
Des A‑Pol
Apolar desolvation
(kcal/mol)
|
Des Pol
Polar desolvation
(kcal/mol)
|
H Don
H-bond donors
|
H Acc
H-bond acceptors
|
Chg
Net charge
|
tPSA
(Ų)
|
MWT
Molecular weight
(g/mol)
|
RB
Rotatable bonds
|
DL |
|
Ref
Reference (pH 7)
|
2.67 |
9.71 |
-38.9 |
2 |
5 |
1 |
57 |
312.324 |
5 |
↓
|
|
Mid
Mid (pH 6-8)
|
2.67 |
9.23 |
-15.59 |
1 |
5 |
0 |
56 |
311.316 |
5 |
↓
|
|
|
|
Analogs
Draw
Identity
99%
90%
80%
70%
Vendors
Clustered Target Annotations
| Code |
Organism Class |
Affinity (nM) |
LE (kcal/mol/atom) |
Type |
|
CP19A-3-E |
Cytochrome P450 19A1 (cluster #3 Of 3), Eukaryotic |
Eukaryotes |
3100 |
0.30 |
Binding ≤ 10μM
|
Physical Representations
|
Type
pH range
|
xlogP
|
Des A‑Pol
Apolar desolvation
(kcal/mol)
|
Des Pol
Polar desolvation
(kcal/mol)
|
H Don
H-bond donors
|
H Acc
H-bond acceptors
|
Chg
Net charge
|
tPSA
(Ų)
|
MWT
Molecular weight
(g/mol)
|
RB
Rotatable bonds
|
DL |
|
Ref
Reference (pH 7)
|
2.31 |
10.19 |
-17.82 |
1 |
6 |
0 |
69 |
354.385 |
6 |
↓
|
|
|
|
Analogs
Draw
Identity
99%
90%
80%
70%
Vendors
Clustered Target Annotations
| Code |
Organism Class |
Affinity (nM) |
LE (kcal/mol/atom) |
Type |
|
CP19A-3-E |
Cytochrome P450 19A1 (cluster #3 Of 3), Eukaryotic |
Eukaryotes |
3100 |
0.30 |
Binding ≤ 10μM
|
Physical Representations
|
Type
pH range
|
xlogP
|
Des A‑Pol
Apolar desolvation
(kcal/mol)
|
Des Pol
Polar desolvation
(kcal/mol)
|
H Don
H-bond donors
|
H Acc
H-bond acceptors
|
Chg
Net charge
|
tPSA
(Ų)
|
MWT
Molecular weight
(g/mol)
|
RB
Rotatable bonds
|
DL |
|
Ref
Reference (pH 7)
|
2.31 |
9.57 |
-12.16 |
1 |
6 |
0 |
69 |
354.385 |
6 |
↓
|
|
|
|
Analogs
-
31903919
-
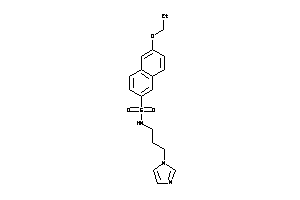
Draw
Identity
99%
90%
80%
70%
Vendors
And 7 More
Clustered Target Annotations
| Code |
Organism Class |
Affinity (nM) |
LE (kcal/mol/atom) |
Type |
|
CP19A-3-E |
Cytochrome P450 19A1 (cluster #3 Of 3), Eukaryotic |
Eukaryotes |
761 |
0.34 |
Binding ≤ 10μM
|
Physical Representations
|
Type
pH range
|
xlogP
|
Des A‑Pol
Apolar desolvation
(kcal/mol)
|
Des Pol
Polar desolvation
(kcal/mol)
|
H Don
H-bond donors
|
H Acc
H-bond acceptors
|
Chg
Net charge
|
tPSA
(Ų)
|
MWT
Molecular weight
(g/mol)
|
RB
Rotatable bonds
|
DL |
|
Ref
Reference (pH 7)
|
2.50 |
7.5 |
-16.11 |
1 |
6 |
0 |
73 |
359.451 |
8 |
↓
|
|
Mid
Mid (pH 6-8)
|
2.50 |
8.01 |
-42.88 |
2 |
6 |
1 |
74 |
360.459 |
8 |
↓
|
|
|
|
Analogs
Draw
Identity
99%
90%
80%
70%
Vendors
And 6 More
Clustered Target Annotations
| Code |
Organism Class |
Affinity (nM) |
LE (kcal/mol/atom) |
Type |
|
CP19A-3-E |
Cytochrome P450 19A1 (cluster #3 Of 3), Eukaryotic |
Eukaryotes |
62 |
0.48 |
Binding ≤ 10μM
|
Physical Representations
|
Type
pH range
|
xlogP
|
Des A‑Pol
Apolar desolvation
(kcal/mol)
|
Des Pol
Polar desolvation
(kcal/mol)
|
H Don
H-bond donors
|
H Acc
H-bond acceptors
|
Chg
Net charge
|
tPSA
(Ų)
|
MWT
Molecular weight
(g/mol)
|
RB
Rotatable bonds
|
DL |
|
Ref
Reference (pH 7)
|
1.39 |
4.9 |
-15.84 |
1 |
6 |
0 |
73 |
309.391 |
7 |
↓
|
|
Mid
Mid (pH 6-8)
|
1.39 |
5.41 |
-43.1 |
2 |
6 |
1 |
74 |
310.399 |
7 |
↓
|
|
|
|
Analogs
Draw
Identity
99%
90%
80%
70%
Vendors
And 4 More
Clustered Target Annotations
| Code |
Organism Class |
Affinity (nM) |
LE (kcal/mol/atom) |
Type |
|
CP19A-3-E |
Cytochrome P450 19A1 (cluster #3 Of 3), Eukaryotic |
Eukaryotes |
440 |
0.37 |
Binding ≤ 10μM
|
Physical Representations
|
Type
pH range
|
xlogP
|
Des A‑Pol
Apolar desolvation
(kcal/mol)
|
Des Pol
Polar desolvation
(kcal/mol)
|
H Don
H-bond donors
|
H Acc
H-bond acceptors
|
Chg
Net charge
|
tPSA
(Ų)
|
MWT
Molecular weight
(g/mol)
|
RB
Rotatable bonds
|
DL |
|
Ref
Reference (pH 7)
|
2.65 |
6.85 |
-15.4 |
1 |
6 |
0 |
73 |
351.472 |
8 |
↓
|
|
Mid
Mid (pH 6-8)
|
2.65 |
7.36 |
-42.7 |
2 |
6 |
1 |
74 |
352.48 |
8 |
↓
|
|
|
|
Analogs
Draw
Identity
99%
90%
80%
70%
Vendors
And 4 More
Clustered Target Annotations
| Code |
Organism Class |
Affinity (nM) |
LE (kcal/mol/atom) |
Type |
|
CP19A-3-E |
Cytochrome P450 19A1 (cluster #3 Of 3), Eukaryotic |
Eukaryotes |
100 |
0.47 |
Binding ≤ 10μM
|
Physical Representations
|
Type
pH range
|
xlogP
|
Des A‑Pol
Apolar desolvation
(kcal/mol)
|
Des Pol
Polar desolvation
(kcal/mol)
|
H Don
H-bond donors
|
H Acc
H-bond acceptors
|
Chg
Net charge
|
tPSA
(Ų)
|
MWT
Molecular weight
(g/mol)
|
RB
Rotatable bonds
|
DL |
|
Ref
Reference (pH 7)
|
1.11 |
4.23 |
-16.74 |
1 |
6 |
0 |
73 |
313.354 |
7 |
↓
|
|
Mid
Mid (pH 6-8)
|
1.11 |
4.74 |
-43.94 |
2 |
6 |
1 |
74 |
314.362 |
7 |
↓
|
|
|
|
Analogs
Draw
Identity
99%
90%
80%
70%
Vendors
Clustered Target Annotations
| Code |
Organism Class |
Affinity (nM) |
LE (kcal/mol/atom) |
Type |
|
CP19A-3-E |
Cytochrome P450 19A1 (cluster #3 Of 3), Eukaryotic |
Eukaryotes |
35 |
0.47 |
Binding ≤ 10μM
|
Physical Representations
|
Type
pH range
|
xlogP
|
Des A‑Pol
Apolar desolvation
(kcal/mol)
|
Des Pol
Polar desolvation
(kcal/mol)
|
H Don
H-bond donors
|
H Acc
H-bond acceptors
|
Chg
Net charge
|
tPSA
(Ų)
|
MWT
Molecular weight
(g/mol)
|
RB
Rotatable bonds
|
DL |
|
Ref
Reference (pH 7)
|
1.15 |
8.48 |
-15.48 |
0 |
5 |
0 |
47 |
303.337 |
4 |
↓
|
|
Mid
Mid (pH 6-8)
|
1.15 |
8.96 |
-41.47 |
1 |
5 |
1 |
49 |
304.345 |
4 |
↓
|
|
|
|
Analogs
Draw
Identity
99%
90%
80%
70%
Vendors
Clustered Target Annotations
| Code |
Organism Class |
Affinity (nM) |
LE (kcal/mol/atom) |
Type |
|
CP19A-3-E |
Cytochrome P450 19A1 (cluster #3 Of 3), Eukaryotic |
Eukaryotes |
35 |
0.47 |
Binding ≤ 10μM
|
Physical Representations
|
Type
pH range
|
xlogP
|
Des A‑Pol
Apolar desolvation
(kcal/mol)
|
Des Pol
Polar desolvation
(kcal/mol)
|
H Don
H-bond donors
|
H Acc
H-bond acceptors
|
Chg
Net charge
|
tPSA
(Ų)
|
MWT
Molecular weight
(g/mol)
|
RB
Rotatable bonds
|
DL |
|
Ref
Reference (pH 7)
|
1.15 |
8.48 |
-15.44 |
0 |
5 |
0 |
47 |
303.337 |
4 |
↓
|
|
Mid
Mid (pH 6-8)
|
1.15 |
8.96 |
-41.46 |
1 |
5 |
1 |
49 |
304.345 |
4 |
↓
|
|
|
|
Analogs
Draw
Identity
99%
90%
80%
70%
Vendors
And 21 More
Clustered Target Annotations
| Code |
Organism Class |
Affinity (nM) |
LE (kcal/mol/atom) |
Type |
|
CP19A-3-E |
Cytochrome P450 19A1 (cluster #3 Of 3), Eukaryotic |
Eukaryotes |
150 |
0.68 |
Binding ≤ 10μM |
Physical Representations
|
Type
pH range
|
xlogP
|
Des A‑Pol
Apolar desolvation
(kcal/mol)
|
Des Pol
Polar desolvation
(kcal/mol)
|
H Don
H-bond donors
|
H Acc
H-bond acceptors
|
Chg
Net charge
|
tPSA
(Ų)
|
MWT
Molecular weight
(g/mol)
|
RB
Rotatable bonds
|
DL |
|
Ref
Reference (pH 7)
|
0.81 |
7.97 |
-11.94 |
0 |
4 |
0 |
55 |
184.202 |
2 |
↓
|
|
|
|
Analogs
Draw
Identity
99%
90%
80%
70%
Vendors
And 8 More
Clustered Target Annotations
| Code |
Organism Class |
Affinity (nM) |
LE (kcal/mol/atom) |
Type |
|
CP19A-3-E |
Cytochrome P450 19A1 (cluster #3 Of 3), Eukaryotic |
Eukaryotes |
4110 |
0.63 |
Binding ≤ 10μM |
Physical Representations
|
Type
pH range
|
xlogP
|
Des A‑Pol
Apolar desolvation
(kcal/mol)
|
Des Pol
Polar desolvation
(kcal/mol)
|
H Don
H-bond donors
|
H Acc
H-bond acceptors
|
Chg
Net charge
|
tPSA
(Ų)
|
MWT
Molecular weight
(g/mol)
|
RB
Rotatable bonds
|
DL |
|
Ref
Reference (pH 7)
|
1.05 |
7.58 |
-8.45 |
0 |
3 |
0 |
31 |
159.192 |
2 |
↓
|
|
|
|
Analogs
Draw
Identity
99%
90%
80%
70%
Vendors
Clustered Target Annotations
| Code |
Organism Class |
Affinity (nM) |
LE (kcal/mol/atom) |
Type |
|
CP19A-3-E |
Cytochrome P450 19A1 (cluster #3 Of 3), Eukaryotic |
Eukaryotes |
1100 |
0.46 |
Binding ≤ 10μM |
Physical Representations
|
Type
pH range
|
xlogP
|
Des A‑Pol
Apolar desolvation
(kcal/mol)
|
Des Pol
Polar desolvation
(kcal/mol)
|
H Don
H-bond donors
|
H Acc
H-bond acceptors
|
Chg
Net charge
|
tPSA
(Ų)
|
MWT
Molecular weight
(g/mol)
|
RB
Rotatable bonds
|
DL |
|
Ref
Reference (pH 7)
|
2.64 |
10.03 |
-5.94 |
0 |
3 |
0 |
31 |
235.29 |
3 |
↓
|
|
|
|
Analogs
Draw
Identity
99%
90%
80%
70%
Vendors
And 5 More
Clustered Target Annotations
| Code |
Organism Class |
Affinity (nM) |
LE (kcal/mol/atom) |
Type |
|
CP19A-3-E |
Cytochrome P450 19A1 (cluster #3 Of 3), Eukaryotic |
Eukaryotes |
9770 |
0.39 |
Binding ≤ 10μM |
Physical Representations
|
Type
pH range
|
xlogP
|
Des A‑Pol
Apolar desolvation
(kcal/mol)
|
Des Pol
Polar desolvation
(kcal/mol)
|
H Don
H-bond donors
|
H Acc
H-bond acceptors
|
Chg
Net charge
|
tPSA
(Ų)
|
MWT
Molecular weight
(g/mol)
|
RB
Rotatable bonds
|
DL |
|
Ref
Reference (pH 7)
|
3.12 |
2.14 |
-11.75 |
0 |
3 |
0 |
30 |
235.29 |
3 |
↓
|
|
|
|
Analogs
Draw
Identity
99%
90%
80%
70%
Vendors
Clustered Target Annotations
| Code |
Organism Class |
Affinity (nM) |
LE (kcal/mol/atom) |
Type |
|
C11B1-2-E |
Cytochrome P450 11B1 (cluster #2 Of 2), Eukaryotic |
Eukaryotes |
1317 |
0.55 |
Binding ≤ 10μM
|
|
C11B2-1-E |
Cytochrome P450 11B2 (cluster #1 Of 2), Eukaryotic |
Eukaryotes |
39 |
0.69 |
Binding ≤ 10μM
|
|
CP19A-3-E |
Cytochrome P450 19A1 (cluster #3 Of 3), Eukaryotic |
Eukaryotes |
2821 |
0.52 |
Binding ≤ 10μM
|
Physical Representations
|
Type
pH range
|
xlogP
|
Des A‑Pol
Apolar desolvation
(kcal/mol)
|
Des Pol
Polar desolvation
(kcal/mol)
|
H Don
H-bond donors
|
H Acc
H-bond acceptors
|
Chg
Net charge
|
tPSA
(Ų)
|
MWT
Molecular weight
(g/mol)
|
RB
Rotatable bonds
|
DL |
|
Ref
Reference (pH 7)
|
2.66 |
9.14 |
-7.41 |
0 |
2 |
0 |
18 |
194.237 |
1 |
↓
|
|
|
|
Analogs
Draw
Identity
99%
90%
80%
70%
Vendors
Clustered Target Annotations
| Code |
Organism Class |
Affinity (nM) |
LE (kcal/mol/atom) |
Type |
|
CP19A-3-E |
Cytochrome P450 19A1 (cluster #3 Of 3), Eukaryotic |
Eukaryotes |
3 |
0.52 |
Binding ≤ 10μM
|
|
CP19A-3-E |
Cytochrome P450 19A1 (cluster #3 Of 3), Eukaryotic |
Eukaryotes |
44 |
0.45 |
Binding ≤ 10μM
|
Physical Representations
|
Type
pH range
|
xlogP
|
Des A‑Pol
Apolar desolvation
(kcal/mol)
|
Des Pol
Polar desolvation
(kcal/mol)
|
H Don
H-bond donors
|
H Acc
H-bond acceptors
|
Chg
Net charge
|
tPSA
(Ų)
|
MWT
Molecular weight
(g/mol)
|
RB
Rotatable bonds
|
DL |
|
Ref
Reference (pH 7)
|
2.71 |
1.53 |
-11.69 |
0 |
6 |
0 |
61 |
324.775 |
3 |
↓
|
|
|
|
Analogs
Draw
Identity
99%
90%
80%
70%
Vendors
And 2 More
Clustered Target Annotations
| Code |
Organism Class |
Affinity (nM) |
LE (kcal/mol/atom) |
Type |
|
CP19A-3-E |
Cytochrome P450 19A1 (cluster #3 Of 3), Eukaryotic |
Eukaryotes |
2850 |
0.43 |
Binding ≤ 10μM
|
Physical Representations
|
Type
pH range
|
xlogP
|
Des A‑Pol
Apolar desolvation
(kcal/mol)
|
Des Pol
Polar desolvation
(kcal/mol)
|
H Don
H-bond donors
|
H Acc
H-bond acceptors
|
Chg
Net charge
|
tPSA
(Ų)
|
MWT
Molecular weight
(g/mol)
|
RB
Rotatable bonds
|
DL |
|
Ref
Reference (pH 7)
|
3.11 |
1.67 |
-7.16 |
0 |
2 |
0 |
17 |
232.286 |
1 |
↓
|
|
|
|
Analogs
Draw
Identity
99%
90%
80%
70%
Vendors
Clustered Target Annotations
| Code |
Organism Class |
Affinity (nM) |
LE (kcal/mol/atom) |
Type |
|
CP19A-3-E |
Cytochrome P450 19A1 (cluster #3 Of 3), Eukaryotic |
Eukaryotes |
280 |
0.48 |
Binding ≤ 10μM
|
Physical Representations
|
Type
pH range
|
xlogP
|
Des A‑Pol
Apolar desolvation
(kcal/mol)
|
Des Pol
Polar desolvation
(kcal/mol)
|
H Don
H-bond donors
|
H Acc
H-bond acceptors
|
Chg
Net charge
|
tPSA
(Ų)
|
MWT
Molecular weight
(g/mol)
|
RB
Rotatable bonds
|
DL |
|
Ref
Reference (pH 7)
|
1.63 |
2.83 |
-18.07 |
0 |
5 |
0 |
57 |
256.261 |
3 |
↓
|
|
Mid
Mid (pH 6-8)
|
1.63 |
3.11 |
-51.19 |
1 |
5 |
1 |
58 |
257.269 |
3 |
↓
|
|
|
|
Analogs
-
6093398
-
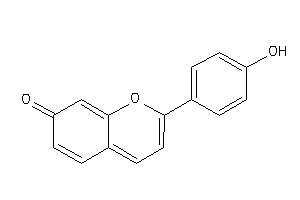
-
6582528
-
-
39119560
-
Draw
Identity
99%
90%
80%
70%
Vendors
And 36 More
Clustered Target Annotations
| Code |
Organism Class |
Affinity (nM) |
LE (kcal/mol/atom) |
Type |
|
AA1R-2-E |
Adenosine A1 Receptor (cluster #2 Of 4), Eukaryotic |
Eukaryotes |
3280 |
0.45 |
Binding ≤ 10μM
|
|
AA2AR-3-E |
Adenosine A2a Receptor (cluster #3 Of 4), Eukaryotic |
Eukaryotes |
3450 |
0.45 |
Binding ≤ 10μM
|
|
AA2BR-1-E |
Adenosine A2b Receptor (cluster #1 Of 1), Eukaryotic |
Eukaryotes |
3450 |
0.45 |
Binding ≤ 10μM
|
|
CP19A-3-E |
Cytochrome P450 19A1 (cluster #3 Of 3), Eukaryotic |
Eukaryotes |
8 |
0.67 |
Binding ≤ 10μM
|
|
GBRA1-1-E |
GABA Receptor Alpha-1 Subunit (cluster #1 Of 8), Eukaryotic |
Eukaryotes |
17 |
0.64 |
Binding ≤ 10μM
|
|
GBRA2-1-E |
GABA Receptor Alpha-2 Subunit (cluster #1 Of 8), Eukaryotic |
Eukaryotes |
17 |
0.64 |
Binding ≤ 10μM
|
|
GBRA3-1-E |
GABA Receptor Alpha-3 Subunit (cluster #1 Of 8), Eukaryotic |
Eukaryotes |
17 |
0.64 |
Binding ≤ 10μM
|
|
GBRA4-1-E |
GABA Receptor Alpha-4 Subunit (cluster #1 Of 7), Eukaryotic |
Eukaryotes |
17 |
0.64 |
Binding ≤ 10μM
|
|
GBRA5-6-E |
GABA Receptor Alpha-5 Subunit (cluster #6 Of 8), Eukaryotic |
Eukaryotes |
17 |
0.64 |
Binding ≤ 10μM
|
|
GBRA6-6-E |
GABA Receptor Alpha-6 Subunit (cluster #6 Of 8), Eukaryotic |
Eukaryotes |
17 |
0.64 |
Binding ≤ 10μM
|
|
GBRB1-1-E |
GABA Receptor Beta-1 Subunit (cluster #1 Of 6), Eukaryotic |
Eukaryotes |
17 |
0.64 |
Binding ≤ 10μM
|
|
GBRB2-1-E |
GABA Receptor Beta-2 Subunit (cluster #1 Of 7), Eukaryotic |
Eukaryotes |
17 |
0.64 |
Binding ≤ 10μM
|
|
GBRB3-1-E |
GABA Receptor Beta-3 Subunit (cluster #1 Of 6), Eukaryotic |
Eukaryotes |
17 |
0.64 |
Binding ≤ 10μM
|
|
GBRD-1-E |
GABA Receptor Delta Subunit (cluster #1 Of 5), Eukaryotic |
Eukaryotes |
17 |
0.64 |
Binding ≤ 10μM
|
|
GBRE-1-E |
GABA Receptor Epsilon Subunit (cluster #1 Of 5), Eukaryotic |
Eukaryotes |
17 |
0.64 |
Binding ≤ 10μM
|
|
GBRG1-5-E |
GABA Receptor Gamma-1 Subunit (cluster #5 Of 7), Eukaryotic |
Eukaryotes |
17 |
0.64 |
Binding ≤ 10μM
|
|
GBRG2-1-E |
GABA Receptor Gamma-2 Subunit (cluster #1 Of 7), Eukaryotic |
Eukaryotes |
17 |
0.64 |
Binding ≤ 10μM
|
|
GBRG3-4-E |
GABA Receptor Gamma-3 Subunit (cluster #4 Of 7), Eukaryotic |
Eukaryotes |
17 |
0.64 |
Binding ≤ 10μM
|
|
GBRP-1-E |
GABA Receptor Pi Subunit (cluster #1 Of 6), Eukaryotic |
Eukaryotes |
17 |
0.64 |
Binding ≤ 10μM
|
|
GBRT-4-E |
GABA Receptor Theta Subunit (cluster #4 Of 5), Eukaryotic |
Eukaryotes |
17 |
0.64 |
Binding ≤ 10μM
|
|
ANDR-3-E |
Androgen Receptor (cluster #3 Of 3), Eukaryotic |
Eukaryotes |
5900 |
0.43 |
Functional ≤ 10μM
|
|
Z104301-4-O |
GABA-A Receptor; Anion Channel (cluster #4 Of 8), Other |
Other |
4200 |
0.44 |
Binding ≤ 10μM
|
|
Z50425-11-O |
Plasmodium Falciparum (cluster #11 Of 22), Other |
Other |
2 |
0.72 |
Functional ≤ 10μM
|
|
Z80418-2-O |
RAW264.7 (Monocytic-macrophage Leukemia Cells) (cluster #2 Of 9), Other |
Other |
500 |
0.52 |
Functional ≤ 10μM
|
Physical Representations
|
Type
pH range
|
xlogP
|
Des A‑Pol
Apolar desolvation
(kcal/mol)
|
Des Pol
Polar desolvation
(kcal/mol)
|
H Don
H-bond donors
|
H Acc
H-bond acceptors
|
Chg
Net charge
|
tPSA
(Ų)
|
MWT
Molecular weight
(g/mol)
|
RB
Rotatable bonds
|
DL |
|
Ref
Reference (pH 7)
|
3.74 |
8.29 |
-10.1 |
0 |
2 |
0 |
30 |
222.243 |
1 |
↓
|
|
|
|
Analogs
Draw
Identity
99%
90%
80%
70%
Vendors
And 17 More
Physical Representations
|
Type
pH range
|
xlogP
|
Des A‑Pol
Apolar desolvation
(kcal/mol)
|
Des Pol
Polar desolvation
(kcal/mol)
|
H Don
H-bond donors
|
H Acc
H-bond acceptors
|
Chg
Net charge
|
tPSA
(Ų)
|
MWT
Molecular weight
(g/mol)
|
RB
Rotatable bonds
|
DL |
|
Ref
Reference (pH 7)
|
3.23 |
5.46 |
-9.75 |
1 |
3 |
0 |
50 |
238.242 |
1 |
↓
|
|
Mid
Mid (pH 6-8)
|
3.49 |
5.51 |
-42.73 |
0 |
3 |
-1 |
53 |
237.234 |
1 |
↓
|
|
|
|
Analogs
Draw
Identity
99%
90%
80%
70%
Vendors
And 48 More
Clustered Target Annotations
| Code |
Organism Class |
Affinity (nM) |
LE (kcal/mol/atom) |
Type |
|
AA1R-2-E |
Adenosine A1 Receptor (cluster #2 Of 4), Eukaryotic |
Eukaryotes |
3000 |
0.39 |
Binding ≤ 10μM
|
|
AA2AR-3-E |
Adenosine A2a Receptor (cluster #3 Of 4), Eukaryotic |
Eukaryotes |
7580 |
0.36 |
Binding ≤ 10μM
|
|
ABCG2-1-E |
ATP-binding Cassette Sub-family G Member 2 (cluster #1 Of 2), Eukaryotic |
Eukaryotes |
5900 |
0.37 |
Binding ≤ 10μM
|
|
ALDR-1-E |
Aldose Reductase (cluster #1 Of 5), Eukaryotic |
Eukaryotes |
6670 |
0.36 |
Binding ≤ 10μM
|
|
AOFA-4-E |
Monoamine Oxidase A (cluster #4 Of 8), Eukaryotic |
Eukaryotes |
1700 |
0.40 |
Binding ≤ 10μM
|
|
BGLR-1-E |
Beta-glucuronidase (cluster #1 Of 2), Eukaryotic |
Eukaryotes |
2800 |
0.39 |
Binding ≤ 10μM
|
|
CCNB1-1-E |
G2/mitotic-specific Cyclin B1 (cluster #1 Of 2), Eukaryotic |
Eukaryotes |
4000 |
0.38 |
Binding ≤ 10μM
|
|
CCNB2-1-E |
G2/mitotic-specific Cyclin B2 (cluster #1 Of 2), Eukaryotic |
Eukaryotes |
4000 |
0.38 |
Binding ≤ 10μM
|
|
CCNB3-1-E |
G2/mitotic-specific Cyclin B3 (cluster #1 Of 2), Eukaryotic |
Eukaryotes |
4000 |
0.38 |
Binding ≤ 10μM
|
|
CDK1-1-E |
Cyclin-dependent Kinase 1 (cluster #1 Of 4), Eukaryotic |
Eukaryotes |
4000 |
0.38 |
Binding ≤ 10μM
|
|
CDK6-1-E |
Cyclin-dependent Kinase 6 (cluster #1 Of 1), Eukaryotic |
Eukaryotes |
1700 |
0.40 |
Binding ≤ 10μM
|
|
CP19A-3-E |
Cytochrome P450 19A1 (cluster #3 Of 3), Eukaryotic |
Eukaryotes |
900 |
0.42 |
Binding ≤ 10μM
|
|
CP1B1-1-E |
Cytochrome P450 1B1 (cluster #1 Of 1), Eukaryotic |
Eukaryotes |
25 |
0.53 |
Binding ≤ 10μM
|
|
CSK21-2-E |
Casein Kinase II Alpha (cluster #2 Of 3), Eukaryotic |
Eukaryotes |
800 |
0.43 |
Binding ≤ 10μM
|
|
CSK2B-3-E |
Casein Kinase II Beta (cluster #3 Of 3), Eukaryotic |
Eukaryotes |
4290 |
0.38 |
Binding ≤ 10μM
|
|
DHB1-1-E |
Estradiol 17-beta-dehydrogenase 1 (cluster #1 Of 1), Eukaryotic |
Eukaryotes |
710 |
0.43 |
Binding ≤ 10μM
|
|
ESR1-1-E |
Estrogen Receptor Alpha (cluster #1 Of 5), Eukaryotic |
Eukaryotes |
660 |
0.43 |
Binding ≤ 10μM
|
|
ESR2-4-E |
Estrogen Receptor Beta (cluster #4 Of 4), Eukaryotic |
Eukaryotes |
660 |
0.43 |
Binding ≤ 10μM
|
|
GBRA1-1-E |
GABA Receptor Alpha-1 Subunit (cluster #1 Of 8), Eukaryotic |
Eukaryotes |
3020 |
0.39 |
Binding ≤ 10μM
|
|
GBRA2-1-E |
GABA Receptor Alpha-2 Subunit (cluster #1 Of 8), Eukaryotic |
Eukaryotes |
3020 |
0.39 |
Binding ≤ 10μM
|
|
GBRA3-1-E |
GABA Receptor Alpha-3 Subunit (cluster #1 Of 8), Eukaryotic |
Eukaryotes |
3020 |
0.39 |
Binding ≤ 10μM
|
|
GBRA4-1-E |
GABA Receptor Alpha-4 Subunit (cluster #1 Of 7), Eukaryotic |
Eukaryotes |
3020 |
0.39 |
Binding ≤ 10μM
|
|
GBRA5-1-E |
GABA Receptor Alpha-5 Subunit (cluster #1 Of 8), Eukaryotic |
Eukaryotes |
3020 |
0.39 |
Binding ≤ 10μM
|
|
GBRA6-6-E |
GABA Receptor Alpha-6 Subunit (cluster #6 Of 8), Eukaryotic |
Eukaryotes |
3020 |
0.39 |
Binding ≤ 10μM
|
|
GSK3A-1-E |
Glycogen Synthase Kinase-3 Alpha (cluster #1 Of 3), Eukaryotic |
Eukaryotes |
1400 |
0.41 |
Binding ≤ 10μM
|
|
GSK3B-7-E |
Glycogen Synthase Kinase-3 Beta (cluster #7 Of 7), Eukaryotic |
Eukaryotes |
1400 |
0.41 |
Binding ≤ 10μM
|
|
MRP1-1-E |
Multidrug Resistance-associated Protein 1 (cluster #1 Of 1), Eukaryotic |
Eukaryotes |
2400 |
0.39 |
Binding ≤ 10μM
|
|
NOX4-1-E |
NADPH Oxidase 4 (cluster #1 Of 1), Eukaryotic |
Eukaryotes |
1130 |
0.42 |
Binding ≤ 10μM
|
|
P90584-1-E |
Protein Kinase Pfmrk (cluster #1 Of 2), Eukaryotic |
Eukaryotes |
7000 |
0.36 |
Binding ≤ 10μM
|
|
PGH2-4-E |
Cyclooxygenase-2 (cluster #4 Of 8), Eukaryotic |
Eukaryotes |
8000 |
0.36 |
Binding ≤ 10μM
|
|
XDH-2-E |
Xanthine Dehydrogenase (cluster #2 Of 2), Eukaryotic |
Eukaryotes |
700 |
0.43 |
Binding ≤ 10μM
|
|
ANDR-1-E |
Androgen Receptor (cluster #1 Of 3), Eukaryotic |
Eukaryotes |
5200 |
0.37 |
Functional ≤ 10μM
|
|
CP1A1-1-E |
Cytochrome P450 1A1 (cluster #1 Of 3), Eukaryotic |
Eukaryotes |
427 |
0.45 |
ADME/T ≤ 10μM
|
|
CP1A2-1-E |
Cytochrome P450 1A2 (cluster #1 Of 3), Eukaryotic |
Eukaryotes |
795 |
0.43 |
ADME/T ≤ 10μM
|
|
CP1B1-1-E |
Cytochrome P450 1B1 (cluster #1 Of 3), Eukaryotic |
Eukaryotes |
64 |
0.50 |
ADME/T ≤ 10μM
|
|
Z104294-2-O |
Cyclin-dependent Kinase 5/CDK5 Activator 1 (cluster #2 Of 2), Other |
Other |
1600 |
0.41 |
Binding ≤ 10μM
|
|
Z104301-4-O |
GABA-A Receptor; Anion Channel (cluster #4 Of 8), Other |
Other |
770 |
0.43 |
Binding ≤ 10μM
|
|
Z50597-1-O |
Rattus Norvegicus (cluster #1 Of 12), Other |
Other |
3400 |
0.38 |
Functional ≤ 10μM
|
|
Z50607-3-O |
Human Immunodeficiency Virus 1 (cluster #3 Of 10), Other |
Other |
9000 |
0.35 |
Functional ≤ 10μM |
|
Z50652-3-O |
Influenza A Virus (cluster #3 Of 4), Other |
Other |
4740 |
0.37 |
Functional ≤ 10μM
|
|
Z80418-2-O |
RAW264.7 (Monocytic-macrophage Leukemia Cells) (cluster #2 Of 9), Other |
Other |
7700 |
0.36 |
Functional ≤ 10μM
|
Physical Representations
|
Type
pH range
|
xlogP
|
Des A‑Pol
Apolar desolvation
(kcal/mol)
|
Des Pol
Polar desolvation
(kcal/mol)
|
H Don
H-bond donors
|
H Acc
H-bond acceptors
|
Chg
Net charge
|
tPSA
(Ų)
|
MWT
Molecular weight
(g/mol)
|
RB
Rotatable bonds
|
DL |
|
Ref
Reference (pH 7)
|
2.46 |
1.12 |
-12.82 |
3 |
5 |
0 |
91 |
270.24 |
1 |
↓
|
|
Mid
Mid (pH 6-8)
|
2.72 |
1.4 |
-45.92 |
2 |
5 |
-1 |
94 |
269.232 |
1 |
↓
|
|
|
|
|
|
|
Analogs
-
6398
-
Draw
Identity
99%
90%
80%
70%
Vendors
And 10 More
Clustered Target Annotations
| Code |
Organism Class |
Affinity (nM) |
LE (kcal/mol/atom) |
Type |
|
C11B1-1-E |
Cytochrome P450 11B1 (cluster #1 Of 2), Eukaryotic |
Eukaryotes |
10 |
0.66 |
Binding ≤ 10μM
|
|
C11B1-1-E |
Cytochrome P450 11B1 (cluster #1 Of 2), Eukaryotic |
Eukaryotes |
40 |
0.61 |
Binding ≤ 10μM
|
|
C11B2-2-E |
Cytochrome P450 11B2 (cluster #2 Of 2), Eukaryotic |
Eukaryotes |
1 |
0.74 |
Binding ≤ 10μM
|
|
C11B2-2-E |
Cytochrome P450 11B2 (cluster #2 Of 2), Eukaryotic |
Eukaryotes |
171 |
0.56 |
Binding ≤ 10μM
|
|
CP19A-3-E |
Cytochrome P450 19A1 (cluster #3 Of 3), Eukaryotic |
Eukaryotes |
52 |
0.60 |
Binding ≤ 10μM
|
|
CP19A-3-E |
Cytochrome P450 19A1 (cluster #3 Of 3), Eukaryotic |
Eukaryotes |
680 |
0.51 |
Binding ≤ 10μM
|
|
C11B1-1-E |
Cytochrome P450 11B1 (cluster #1 Of 1), Eukaryotic |
Eukaryotes |
1000 |
0.49 |
Functional ≤ 10μM
|
|
C11B2-1-E |
Cytochrome P450 11B2 (cluster #1 Of 1), Eukaryotic |
Eukaryotes |
600 |
0.51 |
Functional ≤ 10μM
|
|
CP19A-1-E |
Cytochrome P450 19A1 (cluster #1 Of 2), Eukaryotic |
Eukaryotes |
30 |
0.62 |
Functional ≤ 10μM
|
|
Z50597-1-O |
Rattus Norvegicus (cluster #1 Of 12), Other |
Other |
600 |
0.51 |
Functional ≤ 10μM
|
|
Z50740-1-O |
Cricetinae Gen. Sp. (cluster #1 Of 2), Other |
Other |
0 |
0.00 |
Functional ≤ 10μM
|
Physical Representations
|
Type
pH range
|
xlogP
|
Des A‑Pol
Apolar desolvation
(kcal/mol)
|
Des Pol
Polar desolvation
(kcal/mol)
|
H Don
H-bond donors
|
H Acc
H-bond acceptors
|
Chg
Net charge
|
tPSA
(Ų)
|
MWT
Molecular weight
(g/mol)
|
RB
Rotatable bonds
|
DL |
|
Ref
Reference (pH 7)
|
2.15 |
9.77 |
-36.47 |
1 |
3 |
1 |
43 |
224.287 |
1 |
↓
|
|
|
|
Analogs
Draw
Identity
99%
90%
80%
70%
Vendors
And 8 More
Clustered Target Annotations
| Code |
Organism Class |
Affinity (nM) |
LE (kcal/mol/atom) |
Type |
|
CP19A-3-E |
Cytochrome P450 19A1 (cluster #3 Of 3), Eukaryotic |
Eukaryotes |
2 |
0.64 |
Binding ≤ 10μM
|
Physical Representations
|
Type
pH range
|
xlogP
|
Des A‑Pol
Apolar desolvation
(kcal/mol)
|
Des Pol
Polar desolvation
(kcal/mol)
|
H Don
H-bond donors
|
H Acc
H-bond acceptors
|
Chg
Net charge
|
tPSA
(Ų)
|
MWT
Molecular weight
(g/mol)
|
RB
Rotatable bonds
|
DL |
|
Ref
Reference (pH 7)
|
2.76 |
2.62 |
-10.91 |
2 |
4 |
0 |
71 |
254.241 |
1 |
↓
|
|
|
|
Analogs
Draw
Identity
99%
90%
80%
70%
Vendors
And 1 More
Clustered Target Annotations
| Code |
Organism Class |
Affinity (nM) |
LE (kcal/mol/atom) |
Type |
|
ALDR-1-E |
Aldose Reductase (cluster #1 Of 5), Eukaryotic |
Eukaryotes |
3980 |
0.40 |
Binding ≤ 10μM
|
|
CP19A-3-E |
Cytochrome P450 19A1 (cluster #3 Of 3), Eukaryotic |
Eukaryotes |
9 |
0.59 |
Binding ≤ 10μM
|
Physical Representations
|
Type
pH range
|
xlogP
|
Des A‑Pol
Apolar desolvation
(kcal/mol)
|
Des Pol
Polar desolvation
(kcal/mol)
|
H Don
H-bond donors
|
H Acc
H-bond acceptors
|
Chg
Net charge
|
tPSA
(Ų)
|
MWT
Molecular weight
(g/mol)
|
RB
Rotatable bonds
|
DL |
|
Ref
Reference (pH 7)
|
2.75 |
3.4 |
-11.64 |
2 |
4 |
0 |
71 |
254.241 |
1 |
↓
|
|
Hi
High (pH 8-9.5)
|
2.52 |
3.74 |
-41.53 |
1 |
4 |
-1 |
73 |
253.233 |
1 |
↓
|
|
|
|
Analogs
-
31992538
-
-
31992540
-
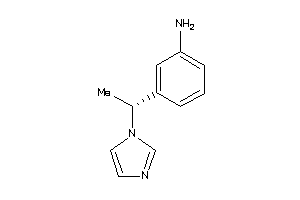
Draw
Identity
99%
90%
80%
70%
Vendors
And 5 More
Clustered Target Annotations
| Code |
Organism Class |
Affinity (nM) |
LE (kcal/mol/atom) |
Type |
|
CP19A-3-E |
Cytochrome P450 19A1 (cluster #3 Of 3), Eukaryotic |
Eukaryotes |
125 |
0.54 |
Binding ≤ 10μM
|
Physical Representations
|
Type
pH range
|
xlogP
|
Des A‑Pol
Apolar desolvation
(kcal/mol)
|
Des Pol
Polar desolvation
(kcal/mol)
|
H Don
H-bond donors
|
H Acc
H-bond acceptors
|
Chg
Net charge
|
tPSA
(Ų)
|
MWT
Molecular weight
(g/mol)
|
RB
Rotatable bonds
|
DL |
|
Ref
Reference (pH 7)
|
3.17 |
2.4 |
-6.24 |
0 |
2 |
0 |
17 |
234.302 |
3 |
↓
|
|
|
|
Analogs
Draw
Identity
99%
90%
80%
70%
Vendors
And 15 More
Clustered Target Annotations
| Code |
Organism Class |
Affinity (nM) |
LE (kcal/mol/atom) |
Type |
|
C11B1-2-E |
Cytochrome P450 11B1 (cluster #2 Of 2), Eukaryotic |
Eukaryotes |
372 |
0.64 |
Binding ≤ 10μM
|
|
C11B2-1-E |
Cytochrome P450 11B2 (cluster #1 Of 2), Eukaryotic |
Eukaryotes |
372 |
0.64 |
Binding ≤ 10μM
|
|
CP17A-1-E |
Cytochrome P450 17A1 (cluster #1 Of 2), Eukaryotic |
Eukaryotes |
7670 |
0.51 |
Binding ≤ 10μM
|
|
CP19A-3-E |
Cytochrome P450 19A1 (cluster #3 Of 3), Eukaryotic |
Eukaryotes |
7 |
0.82 |
Binding ≤ 10μM |
Physical Representations
|
Type
pH range
|
xlogP
|
Des A‑Pol
Apolar desolvation
(kcal/mol)
|
Des Pol
Polar desolvation
(kcal/mol)
|
H Don
H-bond donors
|
H Acc
H-bond acceptors
|
Chg
Net charge
|
tPSA
(Ų)
|
MWT
Molecular weight
(g/mol)
|
RB
Rotatable bonds
|
DL |
|
Ref
Reference (pH 7)
|
1.34 |
8.15 |
-11.78 |
0 |
3 |
0 |
42 |
183.214 |
2 |
↓
|
|
Mid
Mid (pH 6-8)
|
1.34 |
8.67 |
-42.54 |
1 |
3 |
1 |
43 |
184.222 |
2 |
↓
|
|
|
|
Analogs
Draw
Identity
99%
90%
80%
70%
Vendors
Clustered Target Annotations
| Code |
Organism Class |
Affinity (nM) |
LE (kcal/mol/atom) |
Type |
|
C11B1-1-E |
Cytochrome P450 11B1 (cluster #1 Of 2), Eukaryotic |
Eukaryotes |
494 |
0.68 |
Binding ≤ 10μM
|
|
C11B2-1-E |
Cytochrome P450 11B2 (cluster #1 Of 2), Eukaryotic |
Eukaryotes |
331 |
0.70 |
Binding ≤ 10μM
|
|
CP19A-3-E |
Cytochrome P450 19A1 (cluster #3 Of 3), Eukaryotic |
Eukaryotes |
880 |
0.65 |
Binding ≤ 10μM
|
Physical Representations
|
Type
pH range
|
xlogP
|
Des A‑Pol
Apolar desolvation
(kcal/mol)
|
Des Pol
Polar desolvation
(kcal/mol)
|
H Don
H-bond donors
|
H Acc
H-bond acceptors
|
Chg
Net charge
|
tPSA
(Ų)
|
MWT
Molecular weight
(g/mol)
|
RB
Rotatable bonds
|
DL |
|
Ref
Reference (pH 7)
|
1.75 |
7.83 |
-8.98 |
0 |
2 |
0 |
18 |
176.194 |
2 |
↓
|
|
Mid
Mid (pH 6-8)
|
1.75 |
8.34 |
-37.49 |
1 |
2 |
1 |
19 |
177.202 |
2 |
↓
|
|
|
|
Analogs
-
11687637
-
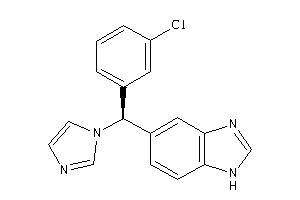
Draw
Identity
99%
90%
80%
70%
Vendors
Clustered Target Annotations
| Code |
Organism Class |
Affinity (nM) |
LE (kcal/mol/atom) |
Type |
|
CP19A-3-E |
Cytochrome P450 19A1 (cluster #3 Of 3), Eukaryotic |
Eukaryotes |
5 |
0.53 |
Binding ≤ 10μM
|
|
CP26A-1-E |
Cytochrome P450 26A1 (cluster #1 Of 1), Eukaryotic |
Eukaryotes |
7000 |
0.33 |
Binding ≤ 10μM
|
Physical Representations
|
Type
pH range
|
xlogP
|
Des A‑Pol
Apolar desolvation
(kcal/mol)
|
Des Pol
Polar desolvation
(kcal/mol)
|
H Don
H-bond donors
|
H Acc
H-bond acceptors
|
Chg
Net charge
|
tPSA
(Ų)
|
MWT
Molecular weight
(g/mol)
|
RB
Rotatable bonds
|
DL |
|
Ref
Reference (pH 7)
|
3.29 |
11.77 |
-45.2 |
2 |
4 |
1 |
48 |
309.78 |
3 |
↓
|
|
|
|
Analogs
-
5425356
-
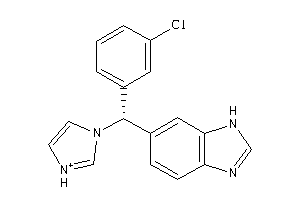
Draw
Identity
99%
90%
80%
70%
Vendors
Clustered Target Annotations
| Code |
Organism Class |
Affinity (nM) |
LE (kcal/mol/atom) |
Type |
|
CP19A-3-E |
Cytochrome P450 19A1 (cluster #3 Of 3), Eukaryotic |
Eukaryotes |
5 |
0.53 |
Binding ≤ 10μM
|
|
CP26A-1-E |
Cytochrome P450 26A1 (cluster #1 Of 1), Eukaryotic |
Eukaryotes |
7000 |
0.33 |
Binding ≤ 10μM
|
Physical Representations
|
Type
pH range
|
xlogP
|
Des A‑Pol
Apolar desolvation
(kcal/mol)
|
Des Pol
Polar desolvation
(kcal/mol)
|
H Don
H-bond donors
|
H Acc
H-bond acceptors
|
Chg
Net charge
|
tPSA
(Ų)
|
MWT
Molecular weight
(g/mol)
|
RB
Rotatable bonds
|
DL |
|
Ref
Reference (pH 7)
|
3.29 |
11.75 |
-42.76 |
2 |
4 |
1 |
48 |
309.78 |
3 |
↓
|
|
Mid
Mid (pH 6-8)
|
3.29 |
10.8 |
-13.36 |
1 |
4 |
0 |
47 |
308.772 |
3 |
↓
|
|
Lo
Low (pH 4.5-6)
|
3.29 |
12.23 |
-90.04 |
3 |
4 |
2 |
49 |
310.788 |
3 |
↓
|
|
|
|
Analogs
Draw
Identity
99%
90%
80%
70%
Vendors
And 6 More
Clustered Target Annotations
| Code |
Organism Class |
Affinity (nM) |
LE (kcal/mol/atom) |
Type |
|
C11B1-1-E |
Cytochrome P450 11B1 (cluster #1 Of 2), Eukaryotic |
Eukaryotes |
140 |
0.74 |
Binding ≤ 10μM |
|
C11B2-1-E |
Cytochrome P450 11B2 (cluster #1 Of 2), Eukaryotic |
Eukaryotes |
46 |
0.79 |
Binding ≤ 10μM |
|
CP17A-1-E |
Cytochrome P450 17A1 (cluster #1 Of 2), Eukaryotic |
Eukaryotes |
4940 |
0.57 |
Binding ≤ 10μM
|
|
CP19A-3-E |
Cytochrome P450 19A1 (cluster #3 Of 3), Eukaryotic |
Eukaryotes |
70 |
0.77 |
Binding ≤ 10μM
|
Physical Representations
|
Type
pH range
|
xlogP
|
Des A‑Pol
Apolar desolvation
(kcal/mol)
|
Des Pol
Polar desolvation
(kcal/mol)
|
H Don
H-bond donors
|
H Acc
H-bond acceptors
|
Chg
Net charge
|
tPSA
(Ų)
|
MWT
Molecular weight
(g/mol)
|
RB
Rotatable bonds
|
DL |
|
Ref
Reference (pH 7)
|
2.27 |
1.67 |
-8.25 |
0 |
2 |
0 |
18 |
192.649 |
2 |
↓
|
|
Mid
Mid (pH 6-8)
|
2.27 |
1.95 |
-36.48 |
1 |
2 |
1 |
19 |
193.657 |
2 |
↓
|
|
|
|
Analogs
Draw
Identity
99%
90%
80%
70%
Vendors
Clustered Target Annotations
| Code |
Organism Class |
Affinity (nM) |
LE (kcal/mol/atom) |
Type |
|
CP19A-3-E |
Cytochrome P450 19A1 (cluster #3 Of 3), Eukaryotic |
Eukaryotes |
6 |
0.46 |
Binding ≤ 10μM
|
Physical Representations
|
Type
pH range
|
xlogP
|
Des A‑Pol
Apolar desolvation
(kcal/mol)
|
Des Pol
Polar desolvation
(kcal/mol)
|
H Don
H-bond donors
|
H Acc
H-bond acceptors
|
Chg
Net charge
|
tPSA
(Ų)
|
MWT
Molecular weight
(g/mol)
|
RB
Rotatable bonds
|
DL |
|
Ref
Reference (pH 7)
|
2.87 |
6.15 |
-47.22 |
2 |
7 |
1 |
76 |
339.327 |
3 |
↓
|
|
|
|
Analogs
-
1851916
-
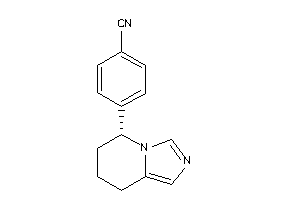
Draw
Identity
99%
90%
80%
70%
Vendors
And 11 More
Physical Representations
|
Type
pH range
|
xlogP
|
Des A‑Pol
Apolar desolvation
(kcal/mol)
|
Des Pol
Polar desolvation
(kcal/mol)
|
H Don
H-bond donors
|
H Acc
H-bond acceptors
|
Chg
Net charge
|
tPSA
(Ų)
|
MWT
Molecular weight
(g/mol)
|
RB
Rotatable bonds
|
DL |
|
Ref
Reference (pH 7)
|
2.15 |
2.5 |
-9.93 |
0 |
3 |
0 |
41 |
223.279 |
1 |
↓
|
|
|
|
Analogs
Draw
Identity
99%
90%
80%
70%
Notice: Undefined index: field_name in /domains/zinc12/htdocs/lib/zinc/reporter/ZincAuxiliaryInfoReports.php on line 244
Notice: Undefined index: synonym in /domains/zinc12/htdocs/lib/zinc/reporter/ZincAuxiliaryInfoReports.php on line 245
Vendors
And 9 More
Clustered Target Annotations
| Code |
Organism Class |
Affinity (nM) |
LE (kcal/mol/atom) |
Type |
|
CP19A-3-E |
Cytochrome P450 19A1 (cluster #3 Of 3), Eukaryotic |
Eukaryotes |
960 |
0.50 |
Binding ≤ 10μM
|
|
NQO2-1-E |
Quinone Reductase 2 (cluster #1 Of 4), Eukaryotic |
Eukaryotes |
4100 |
0.44 |
Binding ≤ 10μM
|
Physical Representations
|
Type
pH range
|
xlogP
|
Des A‑Pol
Apolar desolvation
(kcal/mol)
|
Des Pol
Polar desolvation
(kcal/mol)
|
H Don
H-bond donors
|
H Acc
H-bond acceptors
|
Chg
Net charge
|
tPSA
(Ų)
|
MWT
Molecular weight
(g/mol)
|
RB
Rotatable bonds
|
DL |
|
Ref
Reference (pH 7)
|
2.37 |
1.93 |
-11.04 |
0 |
4 |
0 |
40 |
233.267 |
2 |
↓
|
|
|
|
Analogs
Draw
Identity
99%
90%
80%
70%
Vendors
Clustered Target Annotations
| Code |
Organism Class |
Affinity (nM) |
LE (kcal/mol/atom) |
Type |
|
CP19A-3-E |
Cytochrome P450 19A1 (cluster #3 Of 3), Eukaryotic |
Eukaryotes |
3100 |
0.41 |
Binding ≤ 10μM
|
Physical Representations
|
Type
pH range
|
xlogP
|
Des A‑Pol
Apolar desolvation
(kcal/mol)
|
Des Pol
Polar desolvation
(kcal/mol)
|
H Don
H-bond donors
|
H Acc
H-bond acceptors
|
Chg
Net charge
|
tPSA
(Ų)
|
MWT
Molecular weight
(g/mol)
|
RB
Rotatable bonds
|
DL |
|
Ref
Reference (pH 7)
|
2.44 |
2.64 |
-9.75 |
0 |
5 |
0 |
53 |
255.277 |
4 |
↓
|
|
|
|
Analogs
Draw
Identity
99%
90%
80%
70%
Vendors
Clustered Target Annotations
| Code |
Organism Class |
Affinity (nM) |
LE (kcal/mol/atom) |
Type |
|
CP19A-3-E |
Cytochrome P450 19A1 (cluster #3 Of 3), Eukaryotic |
Eukaryotes |
76 |
0.42 |
Binding ≤ 10μM
|
Physical Representations
|
Type
pH range
|
xlogP
|
Des A‑Pol
Apolar desolvation
(kcal/mol)
|
Des Pol
Polar desolvation
(kcal/mol)
|
H Don
H-bond donors
|
H Acc
H-bond acceptors
|
Chg
Net charge
|
tPSA
(Ų)
|
MWT
Molecular weight
(g/mol)
|
RB
Rotatable bonds
|
DL |
|
Ref
Reference (pH 7)
|
5.31 |
-0.97 |
-9.5 |
1 |
4 |
0 |
47 |
335.794 |
3 |
↓
|
|
|
|
Analogs
Draw
Identity
99%
90%
80%
70%
Vendors
Clustered Target Annotations
| Code |
Organism Class |
Affinity (nM) |
LE (kcal/mol/atom) |
Type |
|
CP19A-3-E |
Cytochrome P450 19A1 (cluster #3 Of 3), Eukaryotic |
Eukaryotes |
48 |
0.41 |
Binding ≤ 10μM
|
Physical Representations
|
Type
pH range
|
xlogP
|
Des A‑Pol
Apolar desolvation
(kcal/mol)
|
Des Pol
Polar desolvation
(kcal/mol)
|
H Don
H-bond donors
|
H Acc
H-bond acceptors
|
Chg
Net charge
|
tPSA
(Ų)
|
MWT
Molecular weight
(g/mol)
|
RB
Rotatable bonds
|
DL |
|
Ref
Reference (pH 7)
|
4.51 |
7.65 |
-9.63 |
2 |
4 |
0 |
62 |
347.805 |
3 |
↓
|
|
Mid
Mid (pH 6-8)
|
4.51 |
8.27 |
-34.15 |
3 |
4 |
1 |
63 |
348.813 |
3 |
↓
|
|
Lo
Low (pH 4.5-6)
|
4.51 |
8.08 |
-47.14 |
3 |
4 |
1 |
63 |
348.813 |
3 |
↓
|
|