|
|
Analogs
Draw
Identity
99%
90%
80%
70%
Vendors
And 45 More
Clustered Target Annotations
| Code |
Organism Class |
Affinity (nM) |
LE (kcal/mol/atom) |
Type |
|
ABCG2-1-E |
ATP-binding Cassette Sub-family G Member 2 (cluster #1 Of 2), Eukaryotic |
Eukaryotes |
2600 |
0.41 |
Binding ≤ 10μM
|
|
ALDR-1-E |
Aldose Reductase (cluster #1 Of 5), Eukaryotic |
Eukaryotes |
7790 |
0.38 |
Binding ≤ 10μM
|
|
AOFA-4-E |
Monoamine Oxidase A (cluster #4 Of 8), Eukaryotic |
Eukaryotes |
1600 |
0.43 |
Binding ≤ 10μM
|
|
AOFB-4-E |
Monoamine Oxidase B (cluster #4 Of 8), Eukaryotic |
Eukaryotes |
1600 |
0.43 |
Binding ≤ 10μM
|
|
CBR1-1-E |
Carbonyl Reductase [NADPH] 1 (cluster #1 Of 2), Eukaryotic |
Eukaryotes |
670 |
0.45 |
Binding ≤ 10μM
|
|
CCNB1-1-E |
G2/mitotic-specific Cyclin B1 (cluster #1 Of 2), Eukaryotic |
Eukaryotes |
6200 |
0.38 |
Binding ≤ 10μM
|
|
CCNB2-1-E |
G2/mitotic-specific Cyclin B2 (cluster #1 Of 2), Eukaryotic |
Eukaryotes |
6200 |
0.38 |
Binding ≤ 10μM
|
|
CCNB3-1-E |
G2/mitotic-specific Cyclin B3 (cluster #1 Of 2), Eukaryotic |
Eukaryotes |
6200 |
0.38 |
Binding ≤ 10μM
|
|
CDK1-1-E |
Cyclin-dependent Kinase 1 (cluster #1 Of 4), Eukaryotic |
Eukaryotes |
6200 |
0.38 |
Binding ≤ 10μM
|
|
CDK6-1-E |
Cyclin-dependent Kinase 6 (cluster #1 Of 1), Eukaryotic |
Eukaryotes |
6000 |
0.38 |
Binding ≤ 10μM
|
|
CP19A-3-E |
Cytochrome P450 19A1 (cluster #3 Of 3), Eukaryotic |
Eukaryotes |
2600 |
0.41 |
Binding ≤ 10μM
|
|
CP1B1-1-E |
Cytochrome P450 1B1 (cluster #1 Of 1), Eukaryotic |
Eukaryotes |
24 |
0.56 |
Binding ≤ 10μM
|
|
GBRA1-1-E |
GABA Receptor Alpha-1 Subunit (cluster #1 Of 8), Eukaryotic |
Eukaryotes |
3020 |
0.41 |
Binding ≤ 10μM
|
|
GBRA2-1-E |
GABA Receptor Alpha-2 Subunit (cluster #1 Of 8), Eukaryotic |
Eukaryotes |
3020 |
0.41 |
Binding ≤ 10μM
|
|
GBRA3-1-E |
GABA Receptor Alpha-3 Subunit (cluster #1 Of 8), Eukaryotic |
Eukaryotes |
3020 |
0.41 |
Binding ≤ 10μM
|
|
GBRA4-1-E |
GABA Receptor Alpha-4 Subunit (cluster #1 Of 7), Eukaryotic |
Eukaryotes |
3020 |
0.41 |
Binding ≤ 10μM
|
|
GBRA5-1-E |
GABA Receptor Alpha-5 Subunit (cluster #1 Of 8), Eukaryotic |
Eukaryotes |
3020 |
0.41 |
Binding ≤ 10μM
|
|
GBRA6-6-E |
GABA Receptor Alpha-6 Subunit (cluster #6 Of 8), Eukaryotic |
Eukaryotes |
3020 |
0.41 |
Binding ≤ 10μM
|
|
GSK3A-2-E |
Glycogen Synthase Kinase-3 Alpha (cluster #2 Of 3), Eukaryotic |
Eukaryotes |
7200 |
0.38 |
Binding ≤ 10μM
|
|
GSK3B-7-E |
Glycogen Synthase Kinase-3 Beta (cluster #7 Of 7), Eukaryotic |
Eukaryotes |
7200 |
0.38 |
Binding ≤ 10μM
|
|
Q965D6-1-E |
3-oxoacyl-acyl-carrier Protein Reductase (cluster #1 Of 2), Eukaryotic |
Eukaryotes |
10000 |
0.37 |
Binding ≤ 10μM
|
|
XDH-2-E |
Xanthine Dehydrogenase (cluster #2 Of 2), Eukaryotic |
Eukaryotes |
840 |
0.45 |
Binding ≤ 10μM
|
|
CP1A1-1-E |
Cytochrome P450 1A1 (cluster #1 Of 3), Eukaryotic |
Eukaryotes |
42 |
0.54 |
ADME/T ≤ 10μM
|
|
CP1A2-1-E |
Cytochrome P450 1A2 (cluster #1 Of 3), Eukaryotic |
Eukaryotes |
84 |
0.52 |
ADME/T ≤ 10μM
|
|
CP1B1-1-E |
Cytochrome P450 1B1 (cluster #1 Of 3), Eukaryotic |
Eukaryotes |
16 |
0.57 |
ADME/T ≤ 10μM
|
|
CP2C9-1-E |
Cytochrome P450 2C9 (cluster #1 Of 3), Eukaryotic |
Eukaryotes |
5225 |
0.39 |
ADME/T ≤ 10μM
|
|
Z104294-2-O |
Cyclin-dependent Kinase 5/CDK5 Activator 1 (cluster #2 Of 2), Other |
Other |
3100 |
0.41 |
Binding ≤ 10μM
|
|
Z104301-4-O |
GABA-A Receptor; Anion Channel (cluster #4 Of 8), Other |
Other |
920 |
0.44 |
Binding ≤ 10μM
|
|
Z50607-3-O |
Human Immunodeficiency Virus 1 (cluster #3 Of 10), Other |
Other |
5000 |
0.39 |
Functional ≤ 10μM |
|
Z80166-1-O |
HT-29 (Colon Adenocarcinoma Cells) (cluster #1 Of 12), Other |
Other |
3100 |
0.41 |
Functional ≤ 10μM
|
|
Z80470-1-O |
SGC-7901 (Gastric Carcinoma Cells) (cluster #1 Of 2), Other |
Other |
5800 |
0.39 |
Functional ≤ 10μM
|
Physical Representations
|
Type
pH range
|
xlogP
|
Des A‑Pol
Apolar desolvation
(kcal/mol)
|
Des Pol
Polar desolvation
(kcal/mol)
|
H Don
H-bond donors
|
H Acc
H-bond acceptors
|
Chg
Net charge
|
tPSA
(Ų)
|
MWT
Molecular weight
(g/mol)
|
RB
Rotatable bonds
|
DL |
|
Ref
Reference (pH 7)
|
2.94 |
3.96 |
-11.62 |
2 |
4 |
0 |
71 |
254.241 |
1 |
↓
|
|
Hi
High (pH 8-9.5)
|
2.94 |
4.94 |
-56.85 |
1 |
4 |
-1 |
73 |
253.233 |
1 |
↓
|
|
Mid
Mid (pH 6-8)
|
3.20 |
4.26 |
-45.71 |
1 |
4 |
-1 |
73 |
253.233 |
1 |
↓
|
|
|
|
Analogs
Draw
Identity
99%
90%
80%
70%
Vendors
And 30 More
Clustered Target Annotations
| Code |
Organism Class |
Affinity (nM) |
LE (kcal/mol/atom) |
Type |
|
NANH-1-B |
Sialidase (cluster #1 Of 1), Bacterial |
Bacteria |
8000 |
0.34 |
Binding ≤ 10μM
|
|
ABCG2-1-E |
ATP-binding Cassette Sub-family G Member 2 (cluster #1 Of 2), Eukaryotic |
Eukaryotes |
6200 |
0.35 |
Binding ≤ 10μM
|
|
AHR-1-E |
Aryl Hydrocarbon Receptor (cluster #1 Of 1), Eukaryotic |
Eukaryotes |
28 |
0.50 |
Binding ≤ 10μM
|
|
ALDR-1-E |
Aldose Reductase (cluster #1 Of 5), Eukaryotic |
Eukaryotes |
1330 |
0.39 |
Binding ≤ 10μM
|
|
CP1B1-1-E |
Cytochrome P450 1B1 (cluster #1 Of 1), Eukaryotic |
Eukaryotes |
47 |
0.49 |
Binding ≤ 10μM
|
|
DHB1-1-E |
Estradiol 17-beta-dehydrogenase 1 (cluster #1 Of 1), Eukaryotic |
Eukaryotes |
1050 |
0.40 |
Binding ≤ 10μM
|
|
DHB2-1-E |
Estradiol 17-beta-dehydrogenase 2 (cluster #1 Of 2), Eukaryotic |
Eukaryotes |
360 |
0.43 |
Binding ≤ 10μM
|
|
GSK3A-1-E |
Glycogen Synthase Kinase-3 Alpha (cluster #1 Of 3), Eukaryotic |
Eukaryotes |
3500 |
0.36 |
Binding ≤ 10μM
|
|
GSK3B-7-E |
Glycogen Synthase Kinase-3 Beta (cluster #7 Of 7), Eukaryotic |
Eukaryotes |
3500 |
0.36 |
Binding ≤ 10μM
|
|
LOX15-1-E |
Arachidonate 15-lipoxygenase (cluster #1 Of 5), Eukaryotic |
Eukaryotes |
2200 |
0.38 |
Binding ≤ 10μM
|
|
LOX5-1-E |
Arachidonate 5-lipoxygenase (cluster #1 Of 6), Eukaryotic |
Eukaryotes |
2700 |
0.37 |
Binding ≤ 10μM
|
|
MDR3-1-E |
P-glycoprotein 3 (cluster #1 Of 2), Eukaryotic |
Eukaryotes |
6700 |
0.34 |
Binding ≤ 10μM
|
|
MRP1-1-E |
Multidrug Resistance-associated Protein 1 (cluster #1 Of 1), Eukaryotic |
Eukaryotes |
2400 |
0.37 |
Binding ≤ 10μM
|
|
NOX4-1-E |
NADPH Oxidase 4 (cluster #1 Of 1), Eukaryotic |
Eukaryotes |
1200 |
0.39 |
Binding ≤ 10μM
|
|
Q965D6-1-E |
3-oxoacyl-acyl-carrier Protein Reductase (cluster #1 Of 2), Eukaryotic |
Eukaryotes |
4000 |
0.36 |
Binding ≤ 10μM
|
|
XDH-2-E |
Xanthine Dehydrogenase (cluster #2 Of 2), Eukaryotic |
Eukaryotes |
1060 |
0.40 |
Binding ≤ 10μM
|
|
ANDR-1-E |
Androgen Receptor (cluster #1 Of 3), Eukaryotic |
Eukaryotes |
9700 |
0.33 |
Functional ≤ 10μM
|
|
CP1A1-1-E |
Cytochrome P450 1A1 (cluster #1 Of 3), Eukaryotic |
Eukaryotes |
750 |
0.41 |
ADME/T ≤ 10μM
|
|
CP1A2-1-E |
Cytochrome P450 1A2 (cluster #1 Of 3), Eukaryotic |
Eukaryotes |
716 |
0.41 |
ADME/T ≤ 10μM
|
|
CP1B1-1-E |
Cytochrome P450 1B1 (cluster #1 Of 3), Eukaryotic |
Eukaryotes |
43 |
0.49 |
ADME/T ≤ 10μM
|
|
CP2C9-1-E |
Cytochrome P450 2C9 (cluster #1 Of 3), Eukaryotic |
Eukaryotes |
6000 |
0.35 |
ADME/T ≤ 10μM
|
Physical Representations
|
Type
pH range
|
xlogP
|
Des A‑Pol
Apolar desolvation
(kcal/mol)
|
Des Pol
Polar desolvation
(kcal/mol)
|
H Don
H-bond donors
|
H Acc
H-bond acceptors
|
Chg
Net charge
|
tPSA
(Ų)
|
MWT
Molecular weight
(g/mol)
|
RB
Rotatable bonds
|
DL |
|
Ref
Reference (pH 7)
|
2.17 |
-0.82 |
-11.52 |
4 |
6 |
0 |
111 |
286.239 |
1 |
↓
|
|
Mid
Mid (pH 6-8)
|
2.43 |
-0.55 |
-41.88 |
3 |
6 |
-1 |
114 |
285.231 |
1 |
↓
|
|
|
|
Analogs
Draw
Identity
99%
90%
80%
70%
Vendors
And 49 More
Clustered Target Annotations
| Code |
Organism Class |
Affinity (nM) |
LE (kcal/mol/atom) |
Type |
|
FABI-1-B |
Enoyl-[acyl-carrier-protein] Reductase (cluster #1 Of 2), Bacterial |
Bacteria |
7050 |
0.34 |
Binding ≤ 10μM
|
|
NANH-1-B |
Sialidase (cluster #1 Of 1), Bacterial |
Bacteria |
4300 |
0.36 |
Binding ≤ 10μM
|
|
AA1R-2-E |
Adenosine A1 Receptor (cluster #2 Of 4), Eukaryotic |
Eukaryotes |
1660 |
0.39 |
Binding ≤ 10μM
|
|
ABCG2-1-E |
ATP-binding Cassette Sub-family G Member 2 (cluster #1 Of 2), Eukaryotic |
Eukaryotes |
8900 |
0.34 |
Binding ≤ 10μM
|
|
ALDR-1-E |
Aldose Reductase (cluster #1 Of 5), Eukaryotic |
Eukaryotes |
9570 |
0.33 |
Binding ≤ 10μM
|
|
AOFA-4-E |
Monoamine Oxidase A (cluster #4 Of 8), Eukaryotic |
Eukaryotes |
4900 |
0.35 |
Binding ≤ 10μM
|
|
CCNB1-1-E |
G2/mitotic-specific Cyclin B1 (cluster #1 Of 2), Eukaryotic |
Eukaryotes |
6200 |
0.35 |
Binding ≤ 10μM
|
|
CCNB2-1-E |
G2/mitotic-specific Cyclin B2 (cluster #1 Of 2), Eukaryotic |
Eukaryotes |
6200 |
0.35 |
Binding ≤ 10μM
|
|
CCNB3-1-E |
G2/mitotic-specific Cyclin B3 (cluster #1 Of 2), Eukaryotic |
Eukaryotes |
6200 |
0.35 |
Binding ≤ 10μM
|
|
CD38-1-E |
Lymphocyte Differentiation Antigen CD38 (cluster #1 Of 1), Eukaryotic |
Eukaryotes |
8200 |
0.34 |
Binding ≤ 10μM |
|
CDK1-1-E |
Cyclin-dependent Kinase 1 (cluster #1 Of 4), Eukaryotic |
Eukaryotes |
6200 |
0.35 |
Binding ≤ 10μM
|
|
CP1B1-1-E |
Cytochrome P450 1B1 (cluster #1 Of 1), Eukaryotic |
Eukaryotes |
79 |
0.47 |
Binding ≤ 10μM
|
|
GSK3A-1-E |
Glycogen Synthase Kinase-3 Alpha (cluster #1 Of 3), Eukaryotic |
Eukaryotes |
800 |
0.41 |
Binding ≤ 10μM
|
|
GSK3B-7-E |
Glycogen Synthase Kinase-3 Beta (cluster #7 Of 7), Eukaryotic |
Eukaryotes |
800 |
0.41 |
Binding ≤ 10μM
|
|
LGUL-2-E |
Glyoxalase I (cluster #2 Of 2), Eukaryotic |
Eukaryotes |
7700 |
0.34 |
Binding ≤ 10μM
|
|
LOX1-1-E |
Seed Lipoxygenase-1 (cluster #1 Of 3), Eukaryotic |
Eukaryotes |
3200 |
0.37 |
Binding ≤ 10μM
|
|
NOX4-1-E |
NADPH Oxidase 4 (cluster #1 Of 1), Eukaryotic |
Eukaryotes |
850 |
0.40 |
Binding ≤ 10μM
|
|
Q965D5-1-E |
Enoyl-acyl-carrier Protein Reductase (cluster #1 Of 1), Eukaryotic |
Eukaryotes |
2100 |
0.38 |
Binding ≤ 10μM
|
|
Q965D6-1-E |
3-oxoacyl-acyl-carrier Protein Reductase (cluster #1 Of 2), Eukaryotic |
Eukaryotes |
800 |
0.41 |
Binding ≤ 10μM
|
|
Q965D7-2-E |
Fatty Acid Synthase (cluster #2 Of 2), Eukaryotic |
Eukaryotes |
5000 |
0.35 |
Binding ≤ 10μM
|
|
TOP1-1-E |
DNA Topoisomerase 1 (cluster #1 Of 2), Eukaryotic |
Eukaryotes |
660 |
0.41 |
Binding ≤ 10μM
|
|
XDH-2-E |
Xanthine Dehydrogenase (cluster #2 Of 2), Eukaryotic |
Eukaryotes |
1900 |
0.38 |
Binding ≤ 10μM
|
|
SC6A3-1-E |
Dopamine Transporter (cluster #1 Of 1), Eukaryotic |
Eukaryotes |
1450 |
0.39 |
Functional ≤ 10μM
|
|
CP1A1-1-E |
Cytochrome P450 1A1 (cluster #1 Of 3), Eukaryotic |
Eukaryotes |
890 |
0.40 |
ADME/T ≤ 10μM
|
|
CP1A2-1-E |
Cytochrome P450 1A2 (cluster #1 Of 3), Eukaryotic |
Eukaryotes |
3370 |
0.36 |
ADME/T ≤ 10μM
|
|
CP1B1-1-E |
Cytochrome P450 1B1 (cluster #1 Of 3), Eukaryotic |
Eukaryotes |
56 |
0.48 |
ADME/T ≤ 10μM
|
|
Z104294-2-O |
Cyclin-dependent Kinase 5/CDK5 Activator 1 (cluster #2 Of 2), Other |
Other |
3800 |
0.36 |
Binding ≤ 10μM
|
|
Z50425-11-O |
Plasmodium Falciparum (cluster #11 Of 22), Other |
Other |
9600 |
0.33 |
Functional ≤ 10μM
|
|
Z50607-4-O |
Human Immunodeficiency Virus 1 (cluster #4 Of 10), Other |
Other |
10000 |
0.33 |
Functional ≤ 10μM |
|
Z50652-3-O |
Influenza A Virus (cluster #3 Of 4), Other |
Other |
6820 |
0.34 |
Functional ≤ 10μM
|
|
Z80150-2-O |
H9c2 (Cardiomyoblast Cells) (cluster #2 Of 2), Other |
Other |
5530 |
0.35 |
Functional ≤ 10μM
|
|
Z80418-2-O |
RAW264.7 (Monocytic-macrophage Leukemia Cells) (cluster #2 Of 9), Other |
Other |
7500 |
0.34 |
Functional ≤ 10μM
|
|
Z80420-1-O |
RBL-2H3 (Basophilic Leukemia Cells) (cluster #1 Of 2), Other |
Other |
5800 |
0.35 |
Functional ≤ 10μM
|
Physical Representations
|
Type
pH range
|
xlogP
|
Des A‑Pol
Apolar desolvation
(kcal/mol)
|
Des Pol
Polar desolvation
(kcal/mol)
|
H Don
H-bond donors
|
H Acc
H-bond acceptors
|
Chg
Net charge
|
tPSA
(Ų)
|
MWT
Molecular weight
(g/mol)
|
RB
Rotatable bonds
|
DL |
|
Ref
Reference (pH 7)
|
1.97 |
-0.94 |
-14.61 |
4 |
6 |
0 |
111 |
286.239 |
1 |
↓
|
|
|
|
Analogs
-
6018693
-
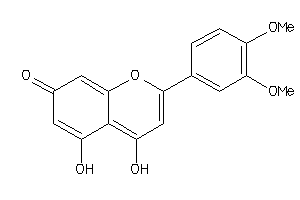
Draw
Identity
99%
90%
80%
70%
Vendors
And 4 More
Clustered Target Annotations
| Code |
Organism Class |
Affinity (nM) |
LE (kcal/mol/atom) |
Type |
|
CP1B1-1-E |
Cytochrome P450 1B1 (cluster #1 Of 1), Eukaryotic |
Eukaryotes |
20 |
0.49 |
Binding ≤ 10μM
|
|
MRP1-1-E |
Multidrug Resistance-associated Protein 1 (cluster #1 Of 1), Eukaryotic |
Eukaryotes |
3000 |
0.35 |
Binding ≤ 10μM
|
|
CP1A1-1-E |
Cytochrome P450 1A1 (cluster #1 Of 3), Eukaryotic |
Eukaryotes |
95 |
0.45 |
ADME/T ≤ 10μM
|
|
CP1A2-1-E |
Cytochrome P450 1A2 (cluster #1 Of 3), Eukaryotic |
Eukaryotes |
1118 |
0.38 |
ADME/T ≤ 10μM
|
Physical Representations
|
Type
pH range
|
xlogP
|
Des A‑Pol
Apolar desolvation
(kcal/mol)
|
Des Pol
Polar desolvation
(kcal/mol)
|
H Don
H-bond donors
|
H Acc
H-bond acceptors
|
Chg
Net charge
|
tPSA
(Ų)
|
MWT
Molecular weight
(g/mol)
|
RB
Rotatable bonds
|
DL |
|
Ref
Reference (pH 7)
|
2.28 |
1.11 |
-13.83 |
3 |
6 |
0 |
100 |
300.266 |
2 |
↓
|
|
|
|
Analogs
Draw
Identity
99%
90%
80%
70%
Vendors
Clustered Target Annotations
| Code |
Organism Class |
Affinity (nM) |
LE (kcal/mol/atom) |
Type |
|
CP1B1-1-E |
Cytochrome P450 1B1 (cluster #1 Of 1), Eukaryotic |
Eukaryotes |
20 |
0.47 |
Binding ≤ 10μM
|
|
CP1A1-1-E |
Cytochrome P450 1A1 (cluster #1 Of 3), Eukaryotic |
Eukaryotes |
120 |
0.42 |
ADME/T ≤ 10μM
|
|
CP1A2-1-E |
Cytochrome P450 1A2 (cluster #1 Of 3), Eukaryotic |
Eukaryotes |
1215 |
0.36 |
ADME/T ≤ 10μM
|
Physical Representations
|
Type
pH range
|
xlogP
|
Des A‑Pol
Apolar desolvation
(kcal/mol)
|
Des Pol
Polar desolvation
(kcal/mol)
|
H Don
H-bond donors
|
H Acc
H-bond acceptors
|
Chg
Net charge
|
tPSA
(Ų)
|
MWT
Molecular weight
(g/mol)
|
RB
Rotatable bonds
|
DL |
|
Ref
Reference (pH 7)
|
1.99 |
-0.94 |
-21.93 |
4 |
7 |
0 |
120 |
316.265 |
2 |
↓
|
|
Hi
High (pH 8-9.5)
|
1.99 |
0.07 |
-61.95 |
3 |
7 |
-1 |
123 |
315.257 |
2 |
↓
|
|
|
|
Analogs
Draw
Identity
99%
90%
80%
70%
Vendors
And 11 More
Clustered Target Annotations
| Code |
Organism Class |
Affinity (nM) |
LE (kcal/mol/atom) |
Type |
|
CP1B1-1-E |
Cytochrome P450 1B1 (cluster #1 Of 1), Eukaryotic |
Eukaryotes |
12 |
0.53 |
Binding ≤ 10μM
|
|
CP1A1-1-E |
Cytochrome P450 1A1 (cluster #1 Of 3), Eukaryotic |
Eukaryotes |
86 |
0.47 |
ADME/T ≤ 10μM
|
|
CP1A2-1-E |
Cytochrome P450 1A2 (cluster #1 Of 3), Eukaryotic |
Eukaryotes |
80 |
0.47 |
ADME/T ≤ 10μM
|
|
CP1B1-1-E |
Cytochrome P450 1B1 (cluster #1 Of 3), Eukaryotic |
Eukaryotes |
7 |
0.54 |
ADME/T ≤ 10μM
|
Physical Representations
|
Type
pH range
|
xlogP
|
Des A‑Pol
Apolar desolvation
(kcal/mol)
|
Des Pol
Polar desolvation
(kcal/mol)
|
H Don
H-bond donors
|
H Acc
H-bond acceptors
|
Chg
Net charge
|
tPSA
(Ų)
|
MWT
Molecular weight
(g/mol)
|
RB
Rotatable bonds
|
DL |
|
Ref
Reference (pH 7)
|
3.00 |
3.27 |
-12.41 |
2 |
5 |
0 |
80 |
284.267 |
2 |
↓
|
|
Ref
Reference (pH 7)
|
3.00 |
2.71 |
-24.13 |
2 |
5 |
0 |
80 |
284.267 |
2 |
↓
|
|
Hi
High (pH 8-9.5)
|
3.26 |
3.56 |
-45.64 |
1 |
5 |
-1 |
83 |
283.259 |
2 |
↓
|
|
|
|
Analogs
Draw
Identity
99%
90%
80%
70%
Vendors
And 48 More
Clustered Target Annotations
| Code |
Organism Class |
Affinity (nM) |
LE (kcal/mol/atom) |
Type |
|
AA1R-2-E |
Adenosine A1 Receptor (cluster #2 Of 4), Eukaryotic |
Eukaryotes |
3000 |
0.39 |
Binding ≤ 10μM
|
|
AA2AR-3-E |
Adenosine A2a Receptor (cluster #3 Of 4), Eukaryotic |
Eukaryotes |
7580 |
0.36 |
Binding ≤ 10μM
|
|
ABCG2-1-E |
ATP-binding Cassette Sub-family G Member 2 (cluster #1 Of 2), Eukaryotic |
Eukaryotes |
5900 |
0.37 |
Binding ≤ 10μM
|
|
ALDR-1-E |
Aldose Reductase (cluster #1 Of 5), Eukaryotic |
Eukaryotes |
6670 |
0.36 |
Binding ≤ 10μM
|
|
AOFA-4-E |
Monoamine Oxidase A (cluster #4 Of 8), Eukaryotic |
Eukaryotes |
1700 |
0.40 |
Binding ≤ 10μM
|
|
BGLR-1-E |
Beta-glucuronidase (cluster #1 Of 2), Eukaryotic |
Eukaryotes |
2800 |
0.39 |
Binding ≤ 10μM
|
|
CCNB1-1-E |
G2/mitotic-specific Cyclin B1 (cluster #1 Of 2), Eukaryotic |
Eukaryotes |
4000 |
0.38 |
Binding ≤ 10μM
|
|
CCNB2-1-E |
G2/mitotic-specific Cyclin B2 (cluster #1 Of 2), Eukaryotic |
Eukaryotes |
4000 |
0.38 |
Binding ≤ 10μM
|
|
CCNB3-1-E |
G2/mitotic-specific Cyclin B3 (cluster #1 Of 2), Eukaryotic |
Eukaryotes |
4000 |
0.38 |
Binding ≤ 10μM
|
|
CDK1-1-E |
Cyclin-dependent Kinase 1 (cluster #1 Of 4), Eukaryotic |
Eukaryotes |
4000 |
0.38 |
Binding ≤ 10μM
|
|
CDK6-1-E |
Cyclin-dependent Kinase 6 (cluster #1 Of 1), Eukaryotic |
Eukaryotes |
1700 |
0.40 |
Binding ≤ 10μM
|
|
CP19A-3-E |
Cytochrome P450 19A1 (cluster #3 Of 3), Eukaryotic |
Eukaryotes |
900 |
0.42 |
Binding ≤ 10μM
|
|
CP1B1-1-E |
Cytochrome P450 1B1 (cluster #1 Of 1), Eukaryotic |
Eukaryotes |
25 |
0.53 |
Binding ≤ 10μM
|
|
CSK21-2-E |
Casein Kinase II Alpha (cluster #2 Of 3), Eukaryotic |
Eukaryotes |
800 |
0.43 |
Binding ≤ 10μM
|
|
CSK2B-3-E |
Casein Kinase II Beta (cluster #3 Of 3), Eukaryotic |
Eukaryotes |
4290 |
0.38 |
Binding ≤ 10μM
|
|
DHB1-1-E |
Estradiol 17-beta-dehydrogenase 1 (cluster #1 Of 1), Eukaryotic |
Eukaryotes |
710 |
0.43 |
Binding ≤ 10μM
|
|
ESR1-1-E |
Estrogen Receptor Alpha (cluster #1 Of 5), Eukaryotic |
Eukaryotes |
660 |
0.43 |
Binding ≤ 10μM
|
|
ESR2-4-E |
Estrogen Receptor Beta (cluster #4 Of 4), Eukaryotic |
Eukaryotes |
660 |
0.43 |
Binding ≤ 10μM
|
|
GBRA1-1-E |
GABA Receptor Alpha-1 Subunit (cluster #1 Of 8), Eukaryotic |
Eukaryotes |
3020 |
0.39 |
Binding ≤ 10μM
|
|
GBRA2-1-E |
GABA Receptor Alpha-2 Subunit (cluster #1 Of 8), Eukaryotic |
Eukaryotes |
3020 |
0.39 |
Binding ≤ 10μM
|
|
GBRA3-1-E |
GABA Receptor Alpha-3 Subunit (cluster #1 Of 8), Eukaryotic |
Eukaryotes |
3020 |
0.39 |
Binding ≤ 10μM
|
|
GBRA4-1-E |
GABA Receptor Alpha-4 Subunit (cluster #1 Of 7), Eukaryotic |
Eukaryotes |
3020 |
0.39 |
Binding ≤ 10μM
|
|
GBRA5-1-E |
GABA Receptor Alpha-5 Subunit (cluster #1 Of 8), Eukaryotic |
Eukaryotes |
3020 |
0.39 |
Binding ≤ 10μM
|
|
GBRA6-6-E |
GABA Receptor Alpha-6 Subunit (cluster #6 Of 8), Eukaryotic |
Eukaryotes |
3020 |
0.39 |
Binding ≤ 10μM
|
|
GSK3A-1-E |
Glycogen Synthase Kinase-3 Alpha (cluster #1 Of 3), Eukaryotic |
Eukaryotes |
1400 |
0.41 |
Binding ≤ 10μM
|
|
GSK3B-7-E |
Glycogen Synthase Kinase-3 Beta (cluster #7 Of 7), Eukaryotic |
Eukaryotes |
1400 |
0.41 |
Binding ≤ 10μM
|
|
MRP1-1-E |
Multidrug Resistance-associated Protein 1 (cluster #1 Of 1), Eukaryotic |
Eukaryotes |
2400 |
0.39 |
Binding ≤ 10μM
|
|
NOX4-1-E |
NADPH Oxidase 4 (cluster #1 Of 1), Eukaryotic |
Eukaryotes |
1130 |
0.42 |
Binding ≤ 10μM
|
|
P90584-1-E |
Protein Kinase Pfmrk (cluster #1 Of 2), Eukaryotic |
Eukaryotes |
7000 |
0.36 |
Binding ≤ 10μM
|
|
PGH2-4-E |
Cyclooxygenase-2 (cluster #4 Of 8), Eukaryotic |
Eukaryotes |
8000 |
0.36 |
Binding ≤ 10μM
|
|
XDH-2-E |
Xanthine Dehydrogenase (cluster #2 Of 2), Eukaryotic |
Eukaryotes |
700 |
0.43 |
Binding ≤ 10μM
|
|
ANDR-1-E |
Androgen Receptor (cluster #1 Of 3), Eukaryotic |
Eukaryotes |
5200 |
0.37 |
Functional ≤ 10μM
|
|
CP1A1-1-E |
Cytochrome P450 1A1 (cluster #1 Of 3), Eukaryotic |
Eukaryotes |
427 |
0.45 |
ADME/T ≤ 10μM
|
|
CP1A2-1-E |
Cytochrome P450 1A2 (cluster #1 Of 3), Eukaryotic |
Eukaryotes |
795 |
0.43 |
ADME/T ≤ 10μM
|
|
CP1B1-1-E |
Cytochrome P450 1B1 (cluster #1 Of 3), Eukaryotic |
Eukaryotes |
64 |
0.50 |
ADME/T ≤ 10μM
|
|
Z104294-2-O |
Cyclin-dependent Kinase 5/CDK5 Activator 1 (cluster #2 Of 2), Other |
Other |
1600 |
0.41 |
Binding ≤ 10μM
|
|
Z104301-4-O |
GABA-A Receptor; Anion Channel (cluster #4 Of 8), Other |
Other |
770 |
0.43 |
Binding ≤ 10μM
|
|
Z50597-1-O |
Rattus Norvegicus (cluster #1 Of 12), Other |
Other |
3400 |
0.38 |
Functional ≤ 10μM
|
|
Z50607-3-O |
Human Immunodeficiency Virus 1 (cluster #3 Of 10), Other |
Other |
9000 |
0.35 |
Functional ≤ 10μM |
|
Z50652-3-O |
Influenza A Virus (cluster #3 Of 4), Other |
Other |
4740 |
0.37 |
Functional ≤ 10μM
|
|
Z80418-2-O |
RAW264.7 (Monocytic-macrophage Leukemia Cells) (cluster #2 Of 9), Other |
Other |
7700 |
0.36 |
Functional ≤ 10μM
|
Physical Representations
|
Type
pH range
|
xlogP
|
Des A‑Pol
Apolar desolvation
(kcal/mol)
|
Des Pol
Polar desolvation
(kcal/mol)
|
H Don
H-bond donors
|
H Acc
H-bond acceptors
|
Chg
Net charge
|
tPSA
(Ų)
|
MWT
Molecular weight
(g/mol)
|
RB
Rotatable bonds
|
DL |
|
Ref
Reference (pH 7)
|
2.46 |
1.12 |
-12.82 |
3 |
5 |
0 |
91 |
270.24 |
1 |
↓
|
|
Mid
Mid (pH 6-8)
|
2.72 |
1.4 |
-45.92 |
2 |
5 |
-1 |
94 |
269.232 |
1 |
↓
|
|
|
|
Analogs
Draw
Identity
99%
90%
80%
70%
Vendors
And 26 More
Clustered Target Annotations
| Code |
Organism Class |
Affinity (nM) |
LE (kcal/mol/atom) |
Type |
|
AA1R-2-E |
Adenosine A1 Receptor (cluster #2 Of 4), Eukaryotic |
Eukaryotes |
863 |
0.42 |
Binding ≤ 10μM
|
|
AA2AR-3-E |
Adenosine A2a Receptor (cluster #3 Of 4), Eukaryotic |
Eukaryotes |
966 |
0.42 |
Binding ≤ 10μM
|
|
AA2BR-1-E |
Adenosine A2b Receptor (cluster #1 Of 1), Eukaryotic |
Eukaryotes |
966 |
0.42 |
Binding ≤ 10μM
|
|
AA3R-4-E |
Adenosine Receptor A3 (cluster #4 Of 6), Eukaryotic |
Eukaryotes |
3150 |
0.39 |
Binding ≤ 10μM
|
|
CHLE-1-E |
Butyrylcholinesterase (cluster #1 Of 7), Eukaryotic |
Eukaryotes |
6900 |
0.36 |
Binding ≤ 10μM
|
|
CP1B1-1-E |
Cytochrome P450 1B1 (cluster #1 Of 1), Eukaryotic |
Eukaryotes |
25 |
0.53 |
Binding ≤ 10μM
|
|
MDR3-1-E |
P-glycoprotein 3 (cluster #1 Of 2), Eukaryotic |
Eukaryotes |
5900 |
0.37 |
Binding ≤ 10μM
|
|
XDH-2-E |
Xanthine Dehydrogenase (cluster #2 Of 2), Eukaryotic |
Eukaryotes |
1800 |
0.40 |
Binding ≤ 10μM
|
|
CP1A1-1-E |
Cytochrome P450 1A1 (cluster #1 Of 3), Eukaryotic |
Eukaryotes |
77 |
0.50 |
ADME/T ≤ 10μM
|
|
CP1A2-1-E |
Cytochrome P450 1A2 (cluster #1 Of 3), Eukaryotic |
Eukaryotes |
40 |
0.52 |
ADME/T ≤ 10μM
|
Physical Representations
|
Type
pH range
|
xlogP
|
Des A‑Pol
Apolar desolvation
(kcal/mol)
|
Des Pol
Polar desolvation
(kcal/mol)
|
H Don
H-bond donors
|
H Acc
H-bond acceptors
|
Chg
Net charge
|
tPSA
(Ų)
|
MWT
Molecular weight
(g/mol)
|
RB
Rotatable bonds
|
DL |
|
Ref
Reference (pH 7)
|
2.65 |
2.03 |
-10.35 |
3 |
5 |
0 |
91 |
270.24 |
1 |
↓
|
|
Hi
High (pH 8-9.5)
|
2.65 |
2.85 |
-56.02 |
2 |
5 |
-1 |
94 |
269.232 |
1 |
↓
|
|
|
|
Analogs
Draw
Identity
99%
90%
80%
70%
Vendors
And 12 More
Clustered Target Annotations
| Code |
Organism Class |
Affinity (nM) |
LE (kcal/mol/atom) |
Type |
|
CP1B1-1-E |
Cytochrome P450 1B1 (cluster #1 Of 1), Eukaryotic |
Eukaryotes |
17 |
0.47 |
Binding ≤ 10μM
|
|
Q965D5-1-E |
Enoyl-acyl-carrier Protein Reductase (cluster #1 Of 1), Eukaryotic |
Eukaryotes |
5000 |
0.32 |
Binding ≤ 10μM
|
|
Q965D6-1-E |
3-oxoacyl-acyl-carrier Protein Reductase (cluster #1 Of 2), Eukaryotic |
Eukaryotes |
8300 |
0.31 |
Binding ≤ 10μM
|
|
XDH-2-E |
Xanthine Dehydrogenase (cluster #2 Of 2), Eukaryotic |
Eukaryotes |
2510 |
0.34 |
Binding ≤ 10μM
|
|
CP1A1-1-E |
Cytochrome P450 1A1 (cluster #1 Of 3), Eukaryotic |
Eukaryotes |
56 |
0.44 |
ADME/T ≤ 10μM
|
|
CP1A2-1-E |
Cytochrome P450 1A2 (cluster #1 Of 3), Eukaryotic |
Eukaryotes |
1261 |
0.36 |
ADME/T ≤ 10μM
|
Physical Representations
|
Type
pH range
|
xlogP
|
Des A‑Pol
Apolar desolvation
(kcal/mol)
|
Des Pol
Polar desolvation
(kcal/mol)
|
H Don
H-bond donors
|
H Acc
H-bond acceptors
|
Chg
Net charge
|
tPSA
(Ų)
|
MWT
Molecular weight
(g/mol)
|
RB
Rotatable bonds
|
DL |
|
Ref
Reference (pH 7)
|
1.99 |
-0.82 |
-12.51 |
4 |
7 |
0 |
120 |
316.265 |
2 |
↓
|
|
|
|
|
|
|
Analogs
-
4935
-
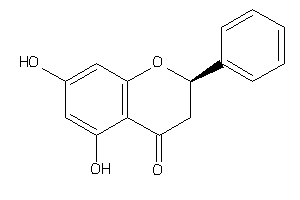
Draw
Identity
99%
90%
80%
70%
Vendors
And 11 More
Clustered Target Annotations
| Code |
Organism Class |
Affinity (nM) |
LE (kcal/mol/atom) |
Type |
|
CP1B1-1-E |
Cytochrome P450 1B1 (cluster #1 Of 1), Eukaryotic |
Eukaryotes |
1679 |
0.43 |
Binding ≤ 10μM
|
|
CP1A1-1-E |
Cytochrome P450 1A1 (cluster #1 Of 3), Eukaryotic |
Eukaryotes |
7906 |
0.38 |
ADME/T ≤ 10μM
|
|
CP1A2-1-E |
Cytochrome P450 1A2 (cluster #1 Of 3), Eukaryotic |
Eukaryotes |
1491 |
0.43 |
ADME/T ≤ 10μM
|
Physical Representations
|
Type
pH range
|
xlogP
|
Des A‑Pol
Apolar desolvation
(kcal/mol)
|
Des Pol
Polar desolvation
(kcal/mol)
|
H Don
H-bond donors
|
H Acc
H-bond acceptors
|
Chg
Net charge
|
tPSA
(Ų)
|
MWT
Molecular weight
(g/mol)
|
RB
Rotatable bonds
|
DL |
|
Ref
Reference (pH 7)
|
2.60 |
3.73 |
-8.72 |
2 |
4 |
0 |
67 |
256.257 |
1 |
↓
|
|
Hi
High (pH 8-9.5)
|
2.60 |
4.73 |
-51.08 |
1 |
4 |
-1 |
70 |
255.249 |
1 |
↓
|
|
|
|
Analogs
Draw
Identity
99%
90%
80%
70%
Vendors
And 1 More
Physical Representations
|
Type
pH range
|
xlogP
|
Des A‑Pol
Apolar desolvation
(kcal/mol)
|
Des Pol
Polar desolvation
(kcal/mol)
|
H Don
H-bond donors
|
H Acc
H-bond acceptors
|
Chg
Net charge
|
tPSA
(Ų)
|
MWT
Molecular weight
(g/mol)
|
RB
Rotatable bonds
|
DL |
|
Ref
Reference (pH 7)
|
2.71 |
1.23 |
-17.9 |
3 |
6 |
0 |
100 |
300.266 |
2 |
↓
|
|
Hi
High (pH 8-9.5)
|
2.71 |
2.24 |
-58.82 |
2 |
6 |
-1 |
103 |
299.258 |
2 |
↓
|
|
|
|
Analogs
-
156701
-
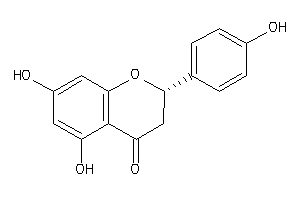
Draw
Identity
99%
90%
80%
70%
Vendors
And 4 More
Clustered Target Annotations
| Code |
Organism Class |
Affinity (nM) |
LE (kcal/mol/atom) |
Type |
|
CP1B1-1-E |
Cytochrome P450 1B1 (cluster #1 Of 1), Eukaryotic |
Eukaryotes |
1024 |
0.40 |
Binding ≤ 10μM
|
|
CP1A1-1-E |
Cytochrome P450 1A1 (cluster #1 Of 3), Eukaryotic |
Eukaryotes |
2196 |
0.38 |
ADME/T ≤ 10μM
|
|
CP1A2-1-E |
Cytochrome P450 1A2 (cluster #1 Of 3), Eukaryotic |
Eukaryotes |
3147 |
0.37 |
ADME/T ≤ 10μM
|
Physical Representations
|
Type
pH range
|
xlogP
|
Des A‑Pol
Apolar desolvation
(kcal/mol)
|
Des Pol
Polar desolvation
(kcal/mol)
|
H Don
H-bond donors
|
H Acc
H-bond acceptors
|
Chg
Net charge
|
tPSA
(Ų)
|
MWT
Molecular weight
(g/mol)
|
RB
Rotatable bonds
|
DL |
|
Ref
Reference (pH 7)
|
2.65 |
3.03 |
-10.18 |
2 |
5 |
0 |
76 |
286.283 |
2 |
↓
|
|
Hi
High (pH 8-9.5)
|
2.65 |
4.03 |
-51.6 |
1 |
5 |
-1 |
79 |
285.275 |
2 |
↓
|
|
|
|
Analogs
-
899370
-
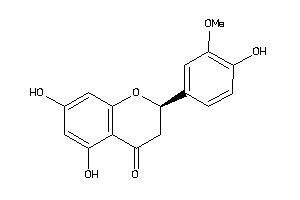
Draw
Identity
99%
90%
80%
70%
Vendors
And 6 More
Clustered Target Annotations
| Code |
Organism Class |
Affinity (nM) |
LE (kcal/mol/atom) |
Type |
|
CP1B1-1-E |
Cytochrome P450 1B1 (cluster #1 Of 1), Eukaryotic |
Eukaryotes |
1716 |
0.37 |
Binding ≤ 10μM
|
|
CP1B1-1-E |
Cytochrome P450 1B1 (cluster #1 Of 3), Eukaryotic |
Eukaryotes |
240 |
0.42 |
ADME/T ≤ 10μM
|
Physical Representations
|
Type
pH range
|
xlogP
|
Des A‑Pol
Apolar desolvation
(kcal/mol)
|
Des Pol
Polar desolvation
(kcal/mol)
|
H Don
H-bond donors
|
H Acc
H-bond acceptors
|
Chg
Net charge
|
tPSA
(Ų)
|
MWT
Molecular weight
(g/mol)
|
RB
Rotatable bonds
|
DL |
|
Ref
Reference (pH 7)
|
1.94 |
0.86 |
-11.79 |
3 |
6 |
0 |
96 |
302.282 |
2 |
↓
|
|
Hi
High (pH 8-9.5)
|
1.94 |
1.86 |
-52.01 |
2 |
6 |
-1 |
99 |
301.274 |
2 |
↓
|
|
|
|
Analogs
Draw
Identity
99%
90%
80%
70%
Vendors
And 81 More
Clustered Target Annotations
| Code |
Organism Class |
Affinity (nM) |
LE (kcal/mol/atom) |
Type |
|
AMPC-2-B |
Beta-lactamase (cluster #2 Of 6), Bacterial |
Bacteria |
4000 |
0.34 |
Binding ≤ 10μM
|
|
AMPH-2-B |
Penicillin-binding Protein AmpH (cluster #2 Of 2), Bacterial |
Bacteria |
4000 |
0.34 |
Binding ≤ 10μM
|
|
MDH-1-B |
Malate Dehydrogenase (cluster #1 Of 1), Bacterial |
Bacteria |
6000 |
0.33 |
Binding ≤ 10μM
|
|
NANH-1-B |
Sialidase (cluster #1 Of 1), Bacterial |
Bacteria |
9800 |
0.32 |
Binding ≤ 10μM
|
|
5NTD-1-E |
5'-nucleotidase (cluster #1 Of 1), Eukaryotic |
Eukaryotes |
45 |
0.47 |
Binding ≤ 10μM
|
|
AA1R-2-E |
Adenosine A1 Receptor (cluster #2 Of 4), Eukaryotic |
Eukaryotes |
2470 |
0.36 |
Binding ≤ 10μM
|
|
AA2AR-3-E |
Adenosine A2a Receptor (cluster #3 Of 4), Eukaryotic |
Eukaryotes |
6990 |
0.33 |
Binding ≤ 10μM
|
|
ABCG2-1-E |
ATP-binding Cassette Sub-family G Member 2 (cluster #1 Of 2), Eukaryotic |
Eukaryotes |
7600 |
0.33 |
Binding ≤ 10μM
|
|
AK1A1-1-E |
Aldehyde Reductase (cluster #1 Of 1), Eukaryotic |
Eukaryotes |
2320 |
0.36 |
Binding ≤ 10μM
|
|
AK1CL-1-E |
Aldo-keto Reductase Family 1 Member C21 (cluster #1 Of 1), Eukaryotic |
Eukaryotes |
6900 |
0.33 |
Binding ≤ 10μM
|
|
ALDR-1-E |
Aldose Reductase (cluster #1 Of 5), Eukaryotic |
Eukaryotes |
2850 |
0.35 |
Binding ≤ 10μM
|
|
AOFA-4-E |
Monoamine Oxidase A (cluster #4 Of 8), Eukaryotic |
Eukaryotes |
10 |
0.51 |
Binding ≤ 10μM
|
|
CAH1-12-E |
Carbonic Anhydrase I (cluster #12 Of 12), Eukaryotic |
Eukaryotes |
2680 |
0.35 |
Binding ≤ 10μM
|
|
CAH12-2-E |
Carbonic Anhydrase XII (cluster #2 Of 9), Eukaryotic |
Eukaryotes |
9390 |
0.32 |
Binding ≤ 10μM
|
|
CAH13-1-E |
Carbonic Anhydrase XIII (cluster #1 Of 7), Eukaryotic |
Eukaryotes |
9030 |
0.32 |
Binding ≤ 10μM
|
|
CAH14-4-E |
Carbonic Anhydrase XIV (cluster #4 Of 8), Eukaryotic |
Eukaryotes |
5410 |
0.34 |
Binding ≤ 10μM
|
|
CAH2-15-E |
Carbonic Anhydrase II (cluster #15 Of 15), Eukaryotic |
Eukaryotes |
2540 |
0.36 |
Binding ≤ 10μM
|
|
CAH3-6-E |
Carbonic Anhydrase III (cluster #6 Of 6), Eukaryotic |
Eukaryotes |
8100 |
0.32 |
Binding ≤ 10μM
|
|
CAH4-14-E |
Carbonic Anhydrase IV (cluster #14 Of 16), Eukaryotic |
Eukaryotes |
7890 |
0.32 |
Binding ≤ 10μM
|
|
CAH5A-6-E |
Carbonic Anhydrase VA (cluster #6 Of 10), Eukaryotic |
Eukaryotes |
6810 |
0.33 |
Binding ≤ 10μM
|
|
CAH6-8-E |
Carbonic Anhydrase VI (cluster #8 Of 8), Eukaryotic |
Eukaryotes |
6170 |
0.33 |
Binding ≤ 10μM
|
|
CAH7-8-E |
Carbonic Anhydrase VII (cluster #8 Of 8), Eukaryotic |
Eukaryotes |
4840 |
0.34 |
Binding ≤ 10μM
|
|
CAH9-11-E |
Carbonic Anhydrase IX (cluster #11 Of 11), Eukaryotic |
Eukaryotes |
7000 |
0.33 |
Binding ≤ 10μM
|
|
CDK1-1-E |
Cyclin-dependent Kinase 1 (cluster #1 Of 4), Eukaryotic |
Eukaryotes |
450 |
0.40 |
Binding ≤ 10μM
|
|
CP19A-1-E |
Cytochrome P450 19A1 (cluster #1 Of 3), Eukaryotic |
Eukaryotes |
12 |
0.50 |
Binding ≤ 10μM
|
|
CP1B1-1-E |
Cytochrome P450 1B1 (cluster #1 Of 1), Eukaryotic |
Eukaryotes |
77 |
0.45 |
Binding ≤ 10μM
|
|
CSK21-2-E |
Casein Kinase II Alpha (cluster #2 Of 3), Eukaryotic |
Eukaryotes |
850 |
0.39 |
Binding ≤ 10μM
|
|
CSK2B-3-E |
Casein Kinase II Beta (cluster #3 Of 3), Eukaryotic |
Eukaryotes |
850 |
0.39 |
Binding ≤ 10μM
|
|
DHB2-1-E |
Estradiol 17-beta-dehydrogenase 2 (cluster #1 Of 2), Eukaryotic |
Eukaryotes |
1540 |
0.37 |
Binding ≤ 10μM
|
|
DRD4-1-E |
Dopamine D4 Receptor (cluster #1 Of 4), Eukaryotic |
Eukaryotes |
8 |
0.52 |
Binding ≤ 10μM
|
|
EGFR-2-E |
Epidermal Growth Factor Receptor ErbB1 (cluster #2 Of 4), Eukaryotic |
Eukaryotes |
900 |
0.38 |
Binding ≤ 10μM
|
|
GSK3A-1-E |
Glycogen Synthase Kinase-3 Alpha (cluster #1 Of 3), Eukaryotic |
Eukaryotes |
2100 |
0.36 |
Binding ≤ 10μM
|
|
GSK3B-7-E |
Glycogen Synthase Kinase-3 Beta (cluster #7 Of 7), Eukaryotic |
Eukaryotes |
2100 |
0.36 |
Binding ≤ 10μM
|
|
LGUL-2-E |
Glyoxalase I (cluster #2 Of 2), Eukaryotic |
Eukaryotes |
3200 |
0.35 |
Binding ≤ 10μM
|
|
LOX12-2-E |
Arachidonate 12-lipoxygenase (cluster #2 Of 4), Eukaryotic |
Eukaryotes |
440 |
0.40 |
Binding ≤ 10μM
|
|
LOX15-1-E |
Arachidonate 15-lipoxygenase (cluster #1 Of 5), Eukaryotic |
Eukaryotes |
2200 |
0.36 |
Binding ≤ 10μM
|
|
LOX5-1-E |
Arachidonate 5-lipoxygenase (cluster #1 Of 6), Eukaryotic |
Eukaryotes |
500 |
0.40 |
Binding ≤ 10μM
|
|
MRP1-1-E |
Multidrug Resistance-associated Protein 1 (cluster #1 Of 1), Eukaryotic |
Eukaryotes |
2400 |
0.36 |
Binding ≤ 10μM
|
|
NOX4-1-E |
NADPH Oxidase 4 (cluster #1 Of 1), Eukaryotic |
Eukaryotes |
680 |
0.39 |
Binding ≤ 10μM
|
|
P85A-2-E |
PI3-kinase P85-alpha Subunit (cluster #2 Of 2), Eukaryotic |
Eukaryotes |
3800 |
0.34 |
Binding ≤ 10μM
|
|
P85B-2-E |
PI3-kinase P85-beta Subunit (cluster #2 Of 2), Eukaryotic |
Eukaryotes |
3800 |
0.34 |
Binding ≤ 10μM
|
|
PA21B-2-E |
Phospholipase A2 Group 1B (cluster #2 Of 3), Eukaryotic |
Eukaryotes |
2000 |
0.36 |
Binding ≤ 10μM
|
|
PIM1-1-E |
Serine/threonine-protein Kinase PIM1 (cluster #1 Of 1), Eukaryotic |
Eukaryotes |
43 |
0.47 |
Binding ≤ 10μM
|
|
PK3CA-2-E |
PI3-kinase P110-alpha Subunit (cluster #2 Of 2), Eukaryotic |
Eukaryotes |
3800 |
0.34 |
Binding ≤ 10μM
|
|
PK3CB-1-E |
PI3-kinase P110-beta Subunit (cluster #1 Of 2), Eukaryotic |
Eukaryotes |
3800 |
0.34 |
Binding ≤ 10μM
|
|
PK3CD-1-E |
PI3-kinase P110-delta Subunit (cluster #1 Of 2), Eukaryotic |
Eukaryotes |
3800 |
0.34 |
Binding ≤ 10μM
|
|
PK3CG-1-E |
PI3-kinase P110-gamma Subunit (cluster #1 Of 3), Eukaryotic |
Eukaryotes |
3800 |
0.34 |
Binding ≤ 10μM
|
|
Q965D5-1-E |
Enoyl-acyl-carrier Protein Reductase (cluster #1 Of 1), Eukaryotic |
Eukaryotes |
473 |
0.40 |
Binding ≤ 10μM
|
|
Q965D6-1-E |
3-oxoacyl-acyl-carrier Protein Reductase (cluster #1 Of 2), Eukaryotic |
Eukaryotes |
5400 |
0.34 |
Binding ≤ 10μM
|
|
Q965D7-2-E |
Fatty Acid Synthase (cluster #2 Of 2), Eukaryotic |
Eukaryotes |
1500 |
0.37 |
Binding ≤ 10μM
|
|
TRY1-1-E |
Trypsin I (cluster #1 Of 5), Eukaryotic |
Eukaryotes |
7100 |
0.33 |
Binding ≤ 10μM
|
|
XDH-2-E |
Xanthine Dehydrogenase (cluster #2 Of 2), Eukaryotic |
Eukaryotes |
1200 |
0.38 |
Binding ≤ 10μM
|
|
LOX5-6-E |
Arachidonate 5-lipoxygenase (cluster #6 Of 7), Eukaryotic |
Eukaryotes |
10000 |
0.32 |
Functional ≤ 10μM
|
|
CP1A1-1-E |
Cytochrome P450 1A1 (cluster #1 Of 3), Eukaryotic |
Eukaryotes |
660 |
0.39 |
ADME/T ≤ 10μM
|
|
CP1A2-1-E |
Cytochrome P450 1A2 (cluster #1 Of 3), Eukaryotic |
Eukaryotes |
4097 |
0.34 |
ADME/T ≤ 10μM
|
|
CP1B1-1-E |
Cytochrome P450 1B1 (cluster #1 Of 3), Eukaryotic |
Eukaryotes |
23 |
0.49 |
ADME/T ≤ 10μM
|
|
Z102178-2-O |
Liver Microsomes (cluster #2 Of 2), Other |
Other |
7500 |
0.33 |
Functional ≤ 10μM
|
|
Z102342-1-O |
Liver (cluster #1 Of 1), Other |
Other |
6000 |
0.33 |
Functional ≤ 10μM
|
|
Z50425-11-O |
Plasmodium Falciparum (cluster #11 Of 22), Other |
Other |
8900 |
0.32 |
Functional ≤ 10μM
|
|
Z50597-1-O |
Rattus Norvegicus (cluster #1 Of 12), Other |
Other |
8500 |
0.32 |
Functional ≤ 10μM
|
|
Z80418-2-O |
RAW264.7 (Monocytic-macrophage Leukemia Cells) (cluster #2 Of 9), Other |
Other |
9600 |
0.32 |
Functional ≤ 10μM
|
|
Z81000-1-O |
HT-22 (Hippocampal Cells) (cluster #1 Of 1), Other |
Other |
2980 |
0.35 |
Functional ≤ 10μM
|
|
Z81072-1-O |
Jurkat (Acute Leukemic T-cells) (cluster #1 Of 10), Other |
Other |
5000 |
0.34 |
Functional ≤ 10μM
|
|
R1AB-1-V |
Replicase Polyprotein 1ab (cluster #1 Of 1), Viral |
Viruses |
8100 |
0.32 |
Binding ≤ 10μM
|
Physical Representations
|
Type
pH range
|
xlogP
|
Des A‑Pol
Apolar desolvation
(kcal/mol)
|
Des Pol
Polar desolvation
(kcal/mol)
|
H Don
H-bond donors
|
H Acc
H-bond acceptors
|
Chg
Net charge
|
tPSA
(Ų)
|
MWT
Molecular weight
(g/mol)
|
RB
Rotatable bonds
|
DL |
|
Ref
Reference (pH 7)
|
1.68 |
-2.9 |
-13.58 |
5 |
7 |
0 |
131 |
302.238 |
1 |
↓
|
|
Mid
Mid (pH 6-8)
|
1.94 |
-2.61 |
-43.8 |
4 |
7 |
-1 |
134 |
301.23 |
1 |
↓
|
|
|
|
Analogs
-
4098238
-
-
39091
-
Draw
Identity
99%
90%
80%
70%
Vendors
And 12 More
Clustered Target Annotations
| Code |
Organism Class |
Affinity (nM) |
LE (kcal/mol/atom) |
Type |
|
CP1B1-1-E |
Cytochrome P450 1B1 (cluster #1 Of 1), Eukaryotic |
Eukaryotes |
1284 |
0.39 |
Binding ≤ 10μM
|
|
Z81137-1-O |
L929 (Fibroblast Cells) (cluster #1 Of 2), Other |
Other |
6000 |
0.35 |
Functional ≤ 10μM
|
Physical Representations
|
Type
pH range
|
xlogP
|
Des A‑Pol
Apolar desolvation
(kcal/mol)
|
Des Pol
Polar desolvation
(kcal/mol)
|
H Don
H-bond donors
|
H Acc
H-bond acceptors
|
Chg
Net charge
|
tPSA
(Ų)
|
MWT
Molecular weight
(g/mol)
|
RB
Rotatable bonds
|
DL |
|
Ref
Reference (pH 7)
|
1.63 |
-1.2 |
-12.56 |
4 |
6 |
0 |
107 |
288.255 |
1 |
↓
|
|
Hi
High (pH 8-9.5)
|
1.63 |
-0.21 |
-53.53 |
3 |
6 |
-1 |
110 |
287.247 |
1 |
↓
|
|
|
|
Analogs
Draw
Identity
99%
90%
80%
70%
Vendors
And 23 More
Clustered Target Annotations
| Code |
Organism Class |
Affinity (nM) |
LE (kcal/mol/atom) |
Type |
|
CP1B1-1-E |
Cytochrome P450 1B1 (cluster #1 Of 1), Eukaryotic |
Eukaryotes |
29 |
0.48 |
Binding ≤ 10μM
|
|
MRP1-1-E |
Multidrug Resistance-associated Protein 1 (cluster #1 Of 1), Eukaryotic |
Eukaryotes |
3000 |
0.35 |
Binding ≤ 10μM
|
|
CP1A1-1-E |
Cytochrome P450 1A1 (cluster #1 Of 3), Eukaryotic |
Eukaryotes |
89 |
0.45 |
ADME/T ≤ 10μM
|
|
CP1A2-1-E |
Cytochrome P450 1A2 (cluster #1 Of 3), Eukaryotic |
Eukaryotes |
2437 |
0.36 |
ADME/T ≤ 10μM
|
|
CP1B1-1-E |
Cytochrome P450 1B1 (cluster #1 Of 3), Eukaryotic |
Eukaryotes |
16 |
0.50 |
ADME/T ≤ 10μM
|
Physical Representations
|
Type
pH range
|
xlogP
|
Des A‑Pol
Apolar desolvation
(kcal/mol)
|
Des Pol
Polar desolvation
(kcal/mol)
|
H Don
H-bond donors
|
H Acc
H-bond acceptors
|
Chg
Net charge
|
tPSA
(Ų)
|
MWT
Molecular weight
(g/mol)
|
RB
Rotatable bonds
|
DL |
|
Ref
Reference (pH 7)
|
2.28 |
1.12 |
-13.99 |
3 |
6 |
0 |
100 |
300.266 |
2 |
↓
|
|
Hi
High (pH 8-9.5)
|
2.54 |
1.41 |
-47.62 |
2 |
6 |
-1 |
103 |
299.258 |
2 |
↓
|
|
|
|
Analogs
-
519174
-
-
2146973
-
-
4935
-

Draw
Identity
99%
90%
80%
70%
Vendors
And 57 More
Clustered Target Annotations
| Code |
Organism Class |
Affinity (nM) |
LE (kcal/mol/atom) |
Type |
|
CBR1-1-E |
Carbonyl Reductase [NADPH] 1 (cluster #1 Of 2), Eukaryotic |
Eukaryotes |
3430 |
0.38 |
Binding ≤ 10μM
|
|
CP19A-1-E |
Cytochrome P450 19A1 (cluster #1 Of 3), Eukaryotic |
Eukaryotes |
3 |
0.60 |
Binding ≤ 10μM
|
|
CP1B1-1-E |
Cytochrome P450 1B1 (cluster #1 Of 1), Eukaryotic |
Eukaryotes |
3656 |
0.38 |
Binding ≤ 10μM
|
|
DHB1-1-E |
Estradiol 17-beta-dehydrogenase 1 (cluster #1 Of 1), Eukaryotic |
Eukaryotes |
4960 |
0.37 |
Binding ≤ 10μM
|
|
MRP1-1-E |
Multidrug Resistance-associated Protein 1 (cluster #1 Of 1), Eukaryotic |
Eukaryotes |
2400 |
0.39 |
Binding ≤ 10μM
|
Physical Representations
|
Type
pH range
|
xlogP
|
Des A‑Pol
Apolar desolvation
(kcal/mol)
|
Des Pol
Polar desolvation
(kcal/mol)
|
H Don
H-bond donors
|
H Acc
H-bond acceptors
|
Chg
Net charge
|
tPSA
(Ų)
|
MWT
Molecular weight
(g/mol)
|
RB
Rotatable bonds
|
DL |
|
Ref
Reference (pH 7)
|
2.12 |
0.88 |
-10.44 |
3 |
5 |
0 |
87 |
272.256 |
1 |
↓
|
|
Hi
High (pH 8-9.5)
|
2.12 |
1.87 |
-51.65 |
2 |
5 |
-1 |
90 |
271.248 |
1 |
↓
|
|
|
|
Analogs
Draw
Identity
99%
90%
80%
70%
Vendors
And 5 More
Clustered Target Annotations
| Code |
Organism Class |
Affinity (nM) |
LE (kcal/mol/atom) |
Type |
|
CP1A1-1-E |
Cytochrome P450 1A1 (cluster #1 Of 3), Eukaryotic |
Eukaryotes |
630 |
0.33 |
ADME/T ≤ 10μM
|
|
CP1B1-1-E |
Cytochrome P450 1B1 (cluster #1 Of 3), Eukaryotic |
Eukaryotes |
670 |
0.33 |
ADME/T ≤ 10μM
|
Physical Representations
|
Type
pH range
|
xlogP
|
Des A‑Pol
Apolar desolvation
(kcal/mol)
|
Des Pol
Polar desolvation
(kcal/mol)
|
H Don
H-bond donors
|
H Acc
H-bond acceptors
|
Chg
Net charge
|
tPSA
(Ų)
|
MWT
Molecular weight
(g/mol)
|
RB
Rotatable bonds
|
DL |
|
Ref
Reference (pH 7)
|
2.88 |
5.73 |
-14.32 |
1 |
7 |
0 |
87 |
358.346 |
5 |
↓
|
|
|
|
Analogs
Draw
Identity
99%
90%
80%
70%
Vendors
And 26 More
Clustered Target Annotations
| Code |
Organism Class |
Affinity (nM) |
LE (kcal/mol/atom) |
Type |
|
CP19A-1-E |
Cytochrome P450 19A1 (cluster #1 Of 3), Eukaryotic |
Eukaryotes |
10000 |
0.30 |
Binding ≤ 10μM
|
|
INSR-1-E |
Insulin Receptor (cluster #1 Of 1), Eukaryotic |
Eukaryotes |
2600 |
0.34 |
Binding ≤ 10μM |
|
KD4DL-1-E |
Lysine-specific Demethylase 4D-like (cluster #1 Of 1), Eukaryotic |
Eukaryotes |
3000 |
0.34 |
Binding ≤ 10μM |
|
LGUL-2-E |
Glyoxalase I (cluster #2 Of 2), Eukaryotic |
Eukaryotes |
560 |
0.38 |
Binding ≤ 10μM
|
|
MRP1-1-E |
Multidrug Resistance-associated Protein 1 (cluster #1 Of 1), Eukaryotic |
Eukaryotes |
2400 |
0.34 |
Binding ≤ 10μM
|
|
MYLK-1-E |
Myosin Light Chain Kinase, Smooth Muscle (cluster #1 Of 1), Eukaryotic |
Eukaryotes |
1700 |
0.35 |
Binding ≤ 10μM
|
|
Q965D5-1-E |
Enoyl-acyl-carrier Protein Reductase (cluster #1 Of 1), Eukaryotic |
Eukaryotes |
400 |
0.39 |
Binding ≤ 10μM
|
|
Q965D7-2-E |
Fatty Acid Synthase (cluster #2 Of 2), Eukaryotic |
Eukaryotes |
2000 |
0.35 |
Binding ≤ 10μM
|
|
XDH-2-E |
Xanthine Dehydrogenase (cluster #2 Of 2), Eukaryotic |
Eukaryotes |
2380 |
0.34 |
Binding ≤ 10μM
|
|
CP1A1-1-E |
Cytochrome P450 1A1 (cluster #1 Of 3), Eukaryotic |
Eukaryotes |
370 |
0.39 |
ADME/T ≤ 10μM
|
|
CP1B1-1-E |
Cytochrome P450 1B1 (cluster #1 Of 3), Eukaryotic |
Eukaryotes |
27 |
0.46 |
ADME/T ≤ 10μM
|
|
Z50425-11-O |
Plasmodium Falciparum (cluster #11 Of 22), Other |
Other |
6310 |
0.32 |
Functional ≤ 10μM
|
|
FPS-1-V |
Tyrosine-protein Kinase Transforming Protein FPS (cluster #1 Of 1), Viral |
Viruses |
1800 |
0.35 |
Binding ≤ 10μM |
|
Q7ZJM1-1-V |
Human Immunodeficiency Virus Type 1 Integrase (cluster #1 Of 6), Viral |
Viruses |
7600 |
0.31 |
Binding ≤ 10μM
|
Physical Representations
|
Type
pH range
|
xlogP
|
Des A‑Pol
Apolar desolvation
(kcal/mol)
|
Des Pol
Polar desolvation
(kcal/mol)
|
H Don
H-bond donors
|
H Acc
H-bond acceptors
|
Chg
Net charge
|
tPSA
(Ų)
|
MWT
Molecular weight
(g/mol)
|
RB
Rotatable bonds
|
DL |
|
Ref
Reference (pH 7)
|
1.39 |
-5.05 |
-14 |
6 |
8 |
0 |
152 |
318.237 |
1 |
↓
|
|
Mid
Mid (pH 6-8)
|
1.65 |
-4.78 |
-43.31 |
5 |
8 |
-1 |
154 |
317.229 |
1 |
↓
|
|
|
|
Analogs
-
1530818
-
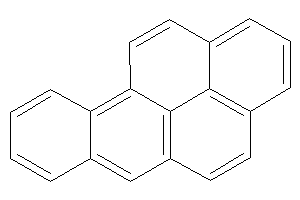
Draw
Identity
99%
90%
80%
70%
Vendors
And 36 More
Clustered Target Annotations
| Code |
Organism Class |
Affinity (nM) |
LE (kcal/mol/atom) |
Type |
|
CP1A1-2-E |
Cytochrome P450 1A1 (cluster #2 Of 3), Eukaryotic |
Eukaryotes |
41 |
0.65 |
ADME/T ≤ 10μM
|
|
CP1A2-2-E |
Cytochrome P450 1A2 (cluster #2 Of 3), Eukaryotic |
Eukaryotes |
7 |
0.71 |
ADME/T ≤ 10μM
|
|
CP1B1-2-E |
Cytochrome P450 1B1 (cluster #2 Of 3), Eukaryotic |
Eukaryotes |
2 |
0.76 |
ADME/T ≤ 10μM
|
Physical Representations
|
Type
pH range
|
xlogP
|
Des A‑Pol
Apolar desolvation
(kcal/mol)
|
Des Pol
Polar desolvation
(kcal/mol)
|
H Don
H-bond donors
|
H Acc
H-bond acceptors
|
Chg
Net charge
|
tPSA
(Ų)
|
MWT
Molecular weight
(g/mol)
|
RB
Rotatable bonds
|
DL |
|
Ref
Reference (pH 7)
|
4.88 |
9.9 |
-7.64 |
0 |
0 |
0 |
0 |
202.256 |
0 |
↓
|
|
|
|
|
|
|
Analogs
-
3225
-
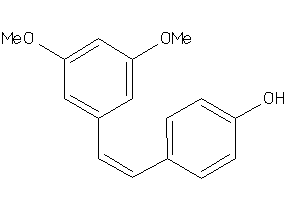
Draw
Identity
99%
90%
80%
70%
Vendors
And 11 More
Clustered Target Annotations
| Code |
Organism Class |
Affinity (nM) |
LE (kcal/mol/atom) |
Type |
|
AHR-1-E |
Aryl Hydrocarbon Receptor (cluster #1 Of 1), Eukaryotic |
Eukaryotes |
8 |
0.57 |
Binding ≤ 10μM
|
|
ESR1-1-E |
Estrogen Receptor Alpha (cluster #1 Of 5), Eukaryotic |
Eukaryotes |
261 |
0.46 |
Binding ≤ 10μM
|
|
ABL1-2-E |
Tyrosine-protein Kinase ABL (cluster #2 Of 2), Eukaryotic |
Eukaryotes |
10000 |
0.35 |
Functional ≤ 10μM
|
|
BCR-2-E |
Breakpoint Cluster Region Protein (cluster #2 Of 2), Eukaryotic |
Eukaryotes |
10000 |
0.35 |
Functional ≤ 10μM
|
|
MDR1-1-E |
P-glycoprotein 1 (cluster #1 Of 2), Eukaryotic |
Eukaryotes |
8000 |
0.36 |
Functional ≤ 10μM
|
|
CP1A1-1-E |
Cytochrome P450 1A1 (cluster #1 Of 3), Eukaryotic |
Eukaryotes |
830 |
0.43 |
ADME/T ≤ 10μM
|
|
CP1A2-3-E |
Cytochrome P450 1A2 (cluster #3 Of 3), Eukaryotic |
Eukaryotes |
6200 |
0.36 |
ADME/T ≤ 10μM
|
|
CP1B1-1-E |
Cytochrome P450 1B1 (cluster #1 Of 3), Eukaryotic |
Eukaryotes |
790 |
0.43 |
ADME/T ≤ 10μM
|
|
Z80156-1-O |
HL-60 (Promyeloblast Leukemia Cells) (cluster #1 Of 12), Other |
Other |
4000 |
0.38 |
Functional ≤ 10μM
|
|
Z80186-2-O |
K562 (Erythroleukemia Cells) (cluster #2 Of 11), Other |
Other |
10000 |
0.35 |
Functional ≤ 10μM
|
|
Z80224-1-O |
MCF7 (Breast Carcinoma Cells) (cluster #1 Of 14), Other |
Other |
1100 |
0.42 |
Functional ≤ 10μM
|
|
Z80928-6-O |
HCT-116 (Colon Carcinoma Cells) (cluster #6 Of 9), Other |
Other |
5700 |
0.37 |
Functional ≤ 10μM
|
|
Z81252-7-O |
MDA-MB-231 (Breast Adenocarcinoma Cells) (cluster #7 Of 11), Other |
Other |
1200 |
0.41 |
Functional ≤ 10μM |
Physical Representations
|
Type
pH range
|
xlogP
|
Des A‑Pol
Apolar desolvation
(kcal/mol)
|
Des Pol
Polar desolvation
(kcal/mol)
|
H Don
H-bond donors
|
H Acc
H-bond acceptors
|
Chg
Net charge
|
tPSA
(Ų)
|
MWT
Molecular weight
(g/mol)
|
RB
Rotatable bonds
|
DL |
|
Ref
Reference (pH 7)
|
4.59 |
7.25 |
-7.23 |
0 |
3 |
0 |
28 |
270.328 |
5 |
↓
|
|
|
|
Analogs
Draw
Identity
99%
90%
80%
70%
Vendors
Clustered Target Annotations
| Code |
Organism Class |
Affinity (nM) |
LE (kcal/mol/atom) |
Type |
|
CP1B1-1-E |
Cytochrome P450 1B1 (cluster #1 Of 3), Eukaryotic |
Eukaryotes |
11 |
0.66 |
ADME/T ≤ 10μM
|
Physical Representations
|
Type
pH range
|
xlogP
|
Des A‑Pol
Apolar desolvation
(kcal/mol)
|
Des Pol
Polar desolvation
(kcal/mol)
|
H Don
H-bond donors
|
H Acc
H-bond acceptors
|
Chg
Net charge
|
tPSA
(Ų)
|
MWT
Molecular weight
(g/mol)
|
RB
Rotatable bonds
|
DL |
|
Ref
Reference (pH 7)
|
6.91 |
1.05 |
-4.08 |
0 |
0 |
0 |
0 |
326.437 |
1 |
↓
|
|
|
|
Analogs
-
10151744
-
-
37846787
-
-
61426
-
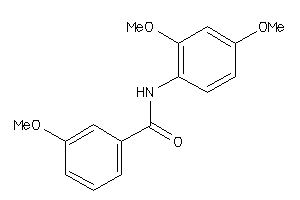
Draw
Identity
99%
90%
80%
70%
Vendors
And 8 More
Clustered Target Annotations
| Code |
Organism Class |
Affinity (nM) |
LE (kcal/mol/atom) |
Type |
|
CP1A1-1-E |
Cytochrome P450 1A1 (cluster #1 Of 3), Eukaryotic |
Eukaryotes |
1500 |
0.35 |
ADME/T ≤ 10μM
|
|
CP1B1-1-E |
Cytochrome P450 1B1 (cluster #1 Of 3), Eukaryotic |
Eukaryotes |
670 |
0.38 |
ADME/T ≤ 10μM
|
Physical Representations
|
Type
pH range
|
xlogP
|
Des A‑Pol
Apolar desolvation
(kcal/mol)
|
Des Pol
Polar desolvation
(kcal/mol)
|
H Don
H-bond donors
|
H Acc
H-bond acceptors
|
Chg
Net charge
|
tPSA
(Ų)
|
MWT
Molecular weight
(g/mol)
|
RB
Rotatable bonds
|
DL |
|
Ref
Reference (pH 7)
|
2.91 |
0.62 |
-10.82 |
1 |
6 |
0 |
66 |
317.341 |
6 |
↓
|
|
|
|
|
|
|
Analogs
-
7999104
-
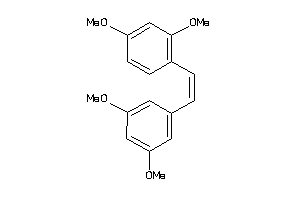
Draw
Identity
99%
90%
80%
70%
Vendors
And 8 More
Clustered Target Annotations
| Code |
Organism Class |
Affinity (nM) |
LE (kcal/mol/atom) |
Type |
|
CP1A1-1-E |
Cytochrome P450 1A1 (cluster #1 Of 3), Eukaryotic |
Eukaryotes |
300 |
0.42 |
ADME/T ≤ 10μM
|
|
CP1A2-3-E |
Cytochrome P450 1A2 (cluster #3 Of 3), Eukaryotic |
Eukaryotes |
3100 |
0.35 |
ADME/T ≤ 10μM
|
|
CP1B1-1-E |
Cytochrome P450 1B1 (cluster #1 Of 3), Eukaryotic |
Eukaryotes |
6 |
0.52 |
ADME/T ≤ 10μM
|
|
Z81115-2-O |
KB (Squamous Cell Carcinoma) (cluster #2 Of 3), Other |
Other |
8600 |
0.32 |
ADME/T ≤ 10μM
|
Physical Representations
|
Type
pH range
|
xlogP
|
Des A‑Pol
Apolar desolvation
(kcal/mol)
|
Des Pol
Polar desolvation
(kcal/mol)
|
H Don
H-bond donors
|
H Acc
H-bond acceptors
|
Chg
Net charge
|
tPSA
(Ų)
|
MWT
Molecular weight
(g/mol)
|
RB
Rotatable bonds
|
DL |
|
Ref
Reference (pH 7)
|
4.40 |
2.33 |
-8.72 |
0 |
4 |
0 |
36 |
300.354 |
6 |
↓
|
|
|
|
Analogs
Draw
Identity
99%
90%
80%
70%
Vendors
And 7 More
Physical Representations
|
Type
pH range
|
xlogP
|
Des A‑Pol
Apolar desolvation
(kcal/mol)
|
Des Pol
Polar desolvation
(kcal/mol)
|
H Don
H-bond donors
|
H Acc
H-bond acceptors
|
Chg
Net charge
|
tPSA
(Ų)
|
MWT
Molecular weight
(g/mol)
|
RB
Rotatable bonds
|
DL |
|
Ref
Reference (pH 7)
|
2.82 |
8.65 |
-11.93 |
1 |
4 |
0 |
39 |
303.365 |
0 |
↓
|
|
|
|
Analogs
-
4098510
-
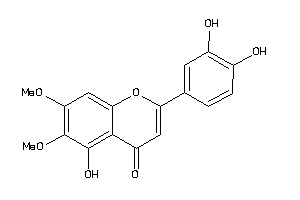
Draw
Identity
99%
90%
80%
70%
Vendors
And 7 More
Clustered Target Annotations
| Code |
Organism Class |
Affinity (nM) |
LE (kcal/mol/atom) |
Type |
|
CP1A1-1-E |
Cytochrome P450 1A1 (cluster #1 Of 3), Eukaryotic |
Eukaryotes |
210 |
0.37 |
ADME/T ≤ 10μM
|
|
CP1B1-1-E |
Cytochrome P450 1B1 (cluster #1 Of 3), Eukaryotic |
Eukaryotes |
35 |
0.42 |
ADME/T ≤ 10μM
|
|
Z80224-1-O |
MCF7 (Breast Carcinoma Cells) (cluster #1 Of 14), Other |
Other |
7000 |
0.29 |
Functional ≤ 10μM
|
Physical Representations
|
Type
pH range
|
xlogP
|
Des A‑Pol
Apolar desolvation
(kcal/mol)
|
Des Pol
Polar desolvation
(kcal/mol)
|
H Don
H-bond donors
|
H Acc
H-bond acceptors
|
Chg
Net charge
|
tPSA
(Ų)
|
MWT
Molecular weight
(g/mol)
|
RB
Rotatable bonds
|
DL |
|
Ref
Reference (pH 7)
|
2.61 |
3.67 |
-14.22 |
2 |
7 |
0 |
98 |
344.319 |
4 |
↓
|
|
Hi
High (pH 8-9.5)
|
2.61 |
4.72 |
-61.29 |
1 |
7 |
-1 |
101 |
343.311 |
4 |
↓
|
|
|
|
Analogs
Draw
Identity
99%
90%
80%
70%
Vendors
And 7 More
Clustered Target Annotations
| Code |
Organism Class |
Affinity (nM) |
LE (kcal/mol/atom) |
Type |
|
AMY1-2-E |
Salivary Alpha-amylase (cluster #2 Of 2), Eukaryotic |
Eukaryotes |
9640 |
0.33 |
Binding ≤ 10μM
|
|
CP1A1-1-E |
Cytochrome P450 1A1 (cluster #1 Of 3), Eukaryotic |
Eukaryotes |
1640 |
0.39 |
ADME/T ≤ 10μM
|
|
CP1B1-1-E |
Cytochrome P450 1B1 (cluster #1 Of 3), Eukaryotic |
Eukaryotes |
220 |
0.44 |
ADME/T ≤ 10μM
|
Physical Representations
|
Type
pH range
|
xlogP
|
Des A‑Pol
Apolar desolvation
(kcal/mol)
|
Des Pol
Polar desolvation
(kcal/mol)
|
H Don
H-bond donors
|
H Acc
H-bond acceptors
|
Chg
Net charge
|
tPSA
(Ų)
|
MWT
Molecular weight
(g/mol)
|
RB
Rotatable bonds
|
DL |
|
Ref
Reference (pH 7)
|
2.20 |
0.17 |
-23.17 |
4 |
6 |
0 |
111 |
286.239 |
1 |
↓
|
|
Hi
High (pH 8-9.5)
|
2.20 |
0.76 |
-57.58 |
3 |
6 |
-1 |
114 |
285.231 |
1 |
↓
|
|
Hi
High (pH 8-9.5)
|
2.20 |
0.98 |
-57.28 |
3 |
6 |
-1 |
114 |
285.231 |
1 |
↓
|
|
|
|
Analogs
Draw
Identity
99%
90%
80%
70%
Vendors
And 8 More
Physical Representations
|
Type
pH range
|
xlogP
|
Des A‑Pol
Apolar desolvation
(kcal/mol)
|
Des Pol
Polar desolvation
(kcal/mol)
|
H Don
H-bond donors
|
H Acc
H-bond acceptors
|
Chg
Net charge
|
tPSA
(Ų)
|
MWT
Molecular weight
(g/mol)
|
RB
Rotatable bonds
|
DL |
|
Ref
Reference (pH 7)
|
-0.43 |
10.32 |
-28.94 |
1 |
4 |
1 |
42 |
302.357 |
0 |
↓
|
|
|
|
Analogs
Draw
Identity
99%
90%
80%
70%
Vendors
And 38 More
Clustered Target Annotations
| Code |
Organism Class |
Affinity (nM) |
LE (kcal/mol/atom) |
Type |
|
CDK1-1-E |
Cyclin-dependent Kinase 1 (cluster #1 Of 4), Eukaryotic |
Eukaryotes |
6530 |
0.36 |
Binding ≤ 10μM
|
|
GBRA1-1-E |
GABA Receptor Alpha-1 Subunit (cluster #1 Of 8), Eukaryotic |
Eukaryotes |
5623 |
0.37 |
Binding ≤ 10μM
|
|
GBRA2-1-E |
GABA Receptor Alpha-2 Subunit (cluster #1 Of 8), Eukaryotic |
Eukaryotes |
5623 |
0.37 |
Binding ≤ 10μM
|
|
GBRA3-1-E |
GABA Receptor Alpha-3 Subunit (cluster #1 Of 8), Eukaryotic |
Eukaryotes |
5623 |
0.37 |
Binding ≤ 10μM
|
|
GBRA4-1-E |
GABA Receptor Alpha-4 Subunit (cluster #1 Of 7), Eukaryotic |
Eukaryotes |
5623 |
0.37 |
Binding ≤ 10μM
|
|
GBRA5-6-E |
GABA Receptor Alpha-5 Subunit (cluster #6 Of 8), Eukaryotic |
Eukaryotes |
5623 |
0.37 |
Binding ≤ 10μM
|
|
GBRA6-6-E |
GABA Receptor Alpha-6 Subunit (cluster #6 Of 8), Eukaryotic |
Eukaryotes |
5623 |
0.37 |
Binding ≤ 10μM
|
|
KD4DL-1-E |
Lysine-specific Demethylase 4D-like (cluster #1 Of 1), Eukaryotic |
Eukaryotes |
4330 |
0.38 |
Binding ≤ 10μM |
|
LOX12-2-E |
Arachidonate 12-lipoxygenase (cluster #2 Of 4), Eukaryotic |
Eukaryotes |
860 |
0.42 |
Binding ≤ 10μM
|
|
LOX15-1-E |
Arachidonate 15-lipoxygenase (cluster #1 Of 5), Eukaryotic |
Eukaryotes |
9100 |
0.35 |
Binding ≤ 10μM
|
|
LX12L-1-E |
Arachidonate 12-lipoxygenase (cluster #1 Of 1), Eukaryotic |
Eukaryotes |
15 |
0.55 |
Binding ≤ 10μM
|
|
LX15B-1-E |
Arachidonate 15-lipoxygenase, Type II (cluster #1 Of 1), Eukaryotic |
Eukaryotes |
260 |
0.46 |
Binding ≤ 10μM
|
|
XDH-2-E |
Xanthine Dehydrogenase (cluster #2 Of 2), Eukaryotic |
Eukaryotes |
3300 |
0.38 |
Binding ≤ 10μM |
|
LOX5-6-E |
Arachidonate 5-lipoxygenase (cluster #6 Of 7), Eukaryotic |
Eukaryotes |
10000 |
0.35 |
Functional ≤ 10μM
|
|
CP1A1-1-E |
Cytochrome P450 1A1 (cluster #1 Of 3), Eukaryotic |
Eukaryotes |
1220 |
0.41 |
ADME/T ≤ 10μM
|
|
CP1B1-1-E |
Cytochrome P450 1B1 (cluster #1 Of 3), Eukaryotic |
Eukaryotes |
260 |
0.46 |
ADME/T ≤ 10μM
|
|
Z50597-1-O |
Rattus Norvegicus (cluster #1 Of 12), Other |
Other |
10000 |
0.35 |
Functional ≤ 10μM
|
|
Q7ZJM1-1-V |
Human Immunodeficiency Virus Type 1 Integrase (cluster #1 Of 6), Viral |
Viruses |
4300 |
0.38 |
Binding ≤ 10μM
|
Physical Representations
|
Type
pH range
|
xlogP
|
Des A‑Pol
Apolar desolvation
(kcal/mol)
|
Des Pol
Polar desolvation
(kcal/mol)
|
H Don
H-bond donors
|
H Acc
H-bond acceptors
|
Chg
Net charge
|
tPSA
(Ų)
|
MWT
Molecular weight
(g/mol)
|
RB
Rotatable bonds
|
DL |
|
Ref
Reference (pH 7)
|
2.68 |
2.34 |
-12.66 |
3 |
5 |
0 |
91 |
270.24 |
1 |
↓
|
|
Hi
High (pH 8-9.5)
|
2.23 |
3.08 |
-43.19 |
2 |
5 |
-1 |
94 |
269.232 |
1 |
↓
|
|
|
|
Analogs
Draw
Identity
99%
90%
80%
70%
Vendors
And 13 More
Physical Representations
|
Type
pH range
|
xlogP
|
Des A‑Pol
Apolar desolvation
(kcal/mol)
|
Des Pol
Polar desolvation
(kcal/mol)
|
H Don
H-bond donors
|
H Acc
H-bond acceptors
|
Chg
Net charge
|
tPSA
(Ų)
|
MWT
Molecular weight
(g/mol)
|
RB
Rotatable bonds
|
DL |
|
Ref
Reference (pH 7)
|
3.24 |
8.38 |
-10.18 |
1 |
4 |
0 |
51 |
287.322 |
0 |
↓
|
|
|
|
Analogs
Draw
Identity
99%
90%
80%
70%
Vendors
Clustered Target Annotations
| Code |
Organism Class |
Affinity (nM) |
LE (kcal/mol/atom) |
Type |
|
CP1A1-3-E |
Cytochrome P450 1A1 (cluster #3 Of 3), Eukaryotic |
Eukaryotes |
1780 |
0.34 |
ADME/T ≤ 10μM
|
|
CP1A2-1-E |
Cytochrome P450 1A2 (cluster #1 Of 3), Eukaryotic |
Eukaryotes |
2920 |
0.32 |
ADME/T ≤ 10μM
|
|
CP1B1-3-E |
Cytochrome P450 1B1 (cluster #3 Of 3), Eukaryotic |
Eukaryotes |
84 |
0.41 |
ADME/T ≤ 10μM
|
Physical Representations
|
Type
pH range
|
xlogP
|
Des A‑Pol
Apolar desolvation
(kcal/mol)
|
Des Pol
Polar desolvation
(kcal/mol)
|
H Don
H-bond donors
|
H Acc
H-bond acceptors
|
Chg
Net charge
|
tPSA
(Ų)
|
MWT
Molecular weight
(g/mol)
|
RB
Rotatable bonds
|
DL |
|
Ref
Reference (pH 7)
|
3.27 |
7.66 |
-10.95 |
1 |
5 |
0 |
60 |
317.348 |
1 |
↓
|
|