|
|
Analogs
-
2146111
-
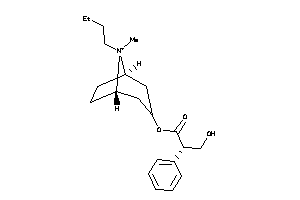
-
4214170
-
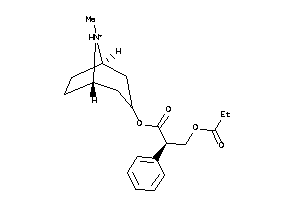
Draw
Identity
99%
90%
80%
70%
Clustered Target Annotations
| Code |
Organism Class |
Affinity (nM) |
LE (kcal/mol/atom) |
Type |
|
ACM1-4-E |
Muscarinic Acetylcholine Receptor M1 (cluster #4 Of 5), Eukaryotic |
Eukaryotes |
3 |
0.50 |
Binding ≤ 10μM
|
|
ACM2-3-E |
Muscarinic Acetylcholine Receptor M2 (cluster #3 Of 6), Eukaryotic |
Eukaryotes |
2 |
0.51 |
Binding ≤ 10μM
|
|
ACM3-2-E |
Muscarinic Acetylcholine Receptor M3 (cluster #2 Of 5), Eukaryotic |
Eukaryotes |
2 |
0.51 |
Binding ≤ 10μM
|
Physical Representations
|
Type
pH range
|
xlogP
|
Des A‑Pol
Apolar desolvation
(kcal/mol)
|
Des Pol
Polar desolvation
(kcal/mol)
|
H Don
H-bond donors
|
H Acc
H-bond acceptors
|
Chg
Net charge
|
tPSA
(Ų)
|
MWT
Molecular weight
(g/mol)
|
RB
Rotatable bonds
|
DL |
|
Ref
Reference (pH 7)
|
-1.47 |
9.34 |
-34.51 |
1 |
4 |
1 |
47 |
332.464 |
6 |
↓
|
|
|
|
Analogs
-
1693568
-
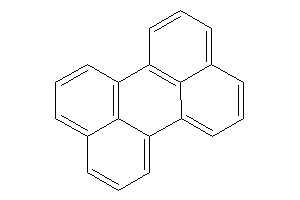
-
1758808
-
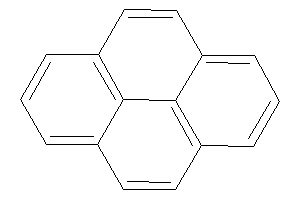
Draw
Identity
99%
90%
80%
70%
Clustered Target Annotations
| Code |
Organism Class |
Affinity (nM) |
LE (kcal/mol/atom) |
Type |
|
AHR-2-E |
Aryl Hydrocarbon Receptor (cluster #2 Of 3), Eukaryotic |
Eukaryotes |
5 |
0.58 |
Functional ≤ 10μM
|
Physical Representations
|
Type
pH range
|
xlogP
|
Des A‑Pol
Apolar desolvation
(kcal/mol)
|
Des Pol
Polar desolvation
(kcal/mol)
|
H Don
H-bond donors
|
H Acc
H-bond acceptors
|
Chg
Net charge
|
tPSA
(Ų)
|
MWT
Molecular weight
(g/mol)
|
RB
Rotatable bonds
|
DL |
|
Ref
Reference (pH 7)
|
6.01 |
12 |
-9.02 |
0 |
0 |
0 |
0 |
252.316 |
0 |
↓
|
|
|
|
Analogs
-
44135764
-
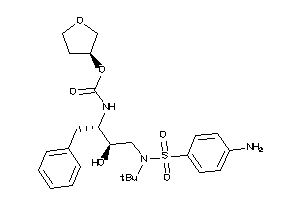
Draw
Identity
99%
90%
80%
70%
Physical Representations
|
Type
pH range
|
xlogP
|
Des A‑Pol
Apolar desolvation
(kcal/mol)
|
Des Pol
Polar desolvation
(kcal/mol)
|
H Don
H-bond donors
|
H Acc
H-bond acceptors
|
Chg
Net charge
|
tPSA
(Ų)
|
MWT
Molecular weight
(g/mol)
|
RB
Rotatable bonds
|
DL |
|
Ref
Reference (pH 7)
|
4.13 |
3.8 |
-19.49 |
4 |
9 |
0 |
131 |
505.637 |
12 |
↓
|
|
|
|
Analogs
-
44135764
-

Draw
Identity
99%
90%
80%
70%
Physical Representations
|
Type
pH range
|
xlogP
|
Des A‑Pol
Apolar desolvation
(kcal/mol)
|
Des Pol
Polar desolvation
(kcal/mol)
|
H Don
H-bond donors
|
H Acc
H-bond acceptors
|
Chg
Net charge
|
tPSA
(Ų)
|
MWT
Molecular weight
(g/mol)
|
RB
Rotatable bonds
|
DL |
|
Ref
Reference (pH 7)
|
4.13 |
4.23 |
-14.86 |
4 |
9 |
0 |
131 |
505.637 |
12 |
↓
|
|
|
|
Analogs
Draw
Identity
99%
90%
80%
70%
Physical Representations
|
Type
pH range
|
xlogP
|
Des A‑Pol
Apolar desolvation
(kcal/mol)
|
Des Pol
Polar desolvation
(kcal/mol)
|
H Don
H-bond donors
|
H Acc
H-bond acceptors
|
Chg
Net charge
|
tPSA
(Ų)
|
MWT
Molecular weight
(g/mol)
|
RB
Rotatable bonds
|
DL |
|
Ref
Reference (pH 7)
|
5.99 |
11.82 |
-9.54 |
0 |
0 |
0 |
0 |
252.316 |
0 |
↓
|
|
|
|
Analogs
-
1530855
-
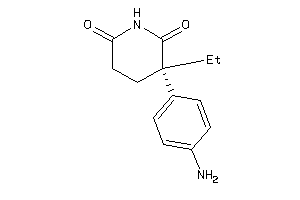
Draw
Identity
99%
90%
80%
70%
Clustered Target Annotations
| Code |
Organism Class |
Affinity (nM) |
LE (kcal/mol/atom) |
Type |
|
CP19A-1-E |
Cytochrome P450 19A1 (cluster #1 Of 3), Eukaryotic |
Eukaryotes |
6200 |
0.43 |
Binding ≤ 10μM
|
Physical Representations
|
Type
pH range
|
xlogP
|
Des A‑Pol
Apolar desolvation
(kcal/mol)
|
Des Pol
Polar desolvation
(kcal/mol)
|
H Don
H-bond donors
|
H Acc
H-bond acceptors
|
Chg
Net charge
|
tPSA
(Ų)
|
MWT
Molecular weight
(g/mol)
|
RB
Rotatable bonds
|
DL |
|
Ref
Reference (pH 7)
|
0.76 |
2.19 |
-10.22 |
3 |
4 |
0 |
72 |
232.283 |
2 |
↓
|
|
|
|
Analogs
-
1530856
-
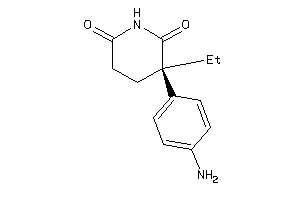
Draw
Identity
99%
90%
80%
70%
Clustered Target Annotations
| Code |
Organism Class |
Affinity (nM) |
LE (kcal/mol/atom) |
Type |
|
CP19A-1-E |
Cytochrome P450 19A1 (cluster #1 Of 3), Eukaryotic |
Eukaryotes |
6200 |
0.43 |
Binding ≤ 10μM
|
Physical Representations
|
Type
pH range
|
xlogP
|
Des A‑Pol
Apolar desolvation
(kcal/mol)
|
Des Pol
Polar desolvation
(kcal/mol)
|
H Don
H-bond donors
|
H Acc
H-bond acceptors
|
Chg
Net charge
|
tPSA
(Ų)
|
MWT
Molecular weight
(g/mol)
|
RB
Rotatable bonds
|
DL |
|
Ref
Reference (pH 7)
|
0.76 |
2.15 |
-10.17 |
3 |
4 |
0 |
72 |
232.283 |
2 |
↓
|
|
|
|
|
|
|
Analogs
Draw
Identity
99%
90%
80%
70%
Physical Representations
|
Type
pH range
|
xlogP
|
Des A‑Pol
Apolar desolvation
(kcal/mol)
|
Des Pol
Polar desolvation
(kcal/mol)
|
H Don
H-bond donors
|
H Acc
H-bond acceptors
|
Chg
Net charge
|
tPSA
(Ų)
|
MWT
Molecular weight
(g/mol)
|
RB
Rotatable bonds
|
DL |
|
Ref
Reference (pH 7)
|
2.82 |
5.92 |
-13.73 |
0 |
8 |
0 |
76 |
413.426 |
4 |
↓
|
|
|
|
Analogs
-
26895588
-
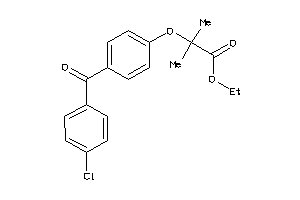
-
33754608
-
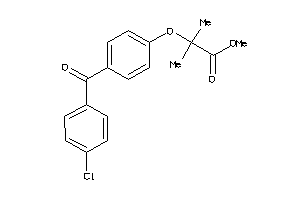
Draw
Identity
99%
90%
80%
70%
Clustered Target Annotations
| Code |
Organism Class |
Affinity (nM) |
LE (kcal/mol/atom) |
Type |
|
FABPL-3-E |
Fatty Acid-binding Protein, Liver (cluster #3 Of 4), Eukaryotic |
Eukaryotes |
62 |
0.40 |
Binding ≤ 10μM
|
|
PPARA-1-E |
Peroxisome Proliferator-activated Receptor Alpha (cluster #1 Of 3), Eukaryotic |
Eukaryotes |
3210 |
0.31 |
Binding ≤ 10μM
|
|
PPARG-1-E |
Peroxisome Proliferator-activated Receptor Gamma (cluster #1 Of 2), Eukaryotic |
Eukaryotes |
570 |
0.35 |
Binding ≤ 10μM
|
|
PPARA-1-E |
Peroxisome Proliferator-activated Receptor Alpha (cluster #1 Of 2), Eukaryotic |
Eukaryotes |
2000 |
0.32 |
Functional ≤ 10μM
|
|
Z50425-1-O |
Plasmodium Falciparum (cluster #1 Of 22), Other |
Other |
7943 |
0.29 |
Functional ≤ 10μM
|
Physical Representations
|
Type
pH range
|
xlogP
|
Des A‑Pol
Apolar desolvation
(kcal/mol)
|
Des Pol
Polar desolvation
(kcal/mol)
|
H Don
H-bond donors
|
H Acc
H-bond acceptors
|
Chg
Net charge
|
tPSA
(Ų)
|
MWT
Molecular weight
(g/mol)
|
RB
Rotatable bonds
|
DL |
|
Ref
Reference (pH 7)
|
5.54 |
11.71 |
-10.11 |
0 |
4 |
0 |
53 |
360.837 |
7 |
↓
|
|
|
|
Analogs
Draw
Identity
99%
90%
80%
70%
Clustered Target Annotations
| Code |
Organism Class |
Affinity (nM) |
LE (kcal/mol/atom) |
Type |
|
CAH-1-A |
Carbonic Anhydrase (cluster #1 Of 2), Archaea |
Archaea |
140 |
0.37 |
Binding ≤ 10μM
|
|
CYNT-1-B |
Carbonic Anhydrase (cluster #1 Of 3), Bacterial |
Bacteria |
713 |
0.33 |
Binding ≤ 10μM
|
|
B5SU02-2-E |
Alpha Carbonic Anhydrase (cluster #2 Of 6), Eukaryotic |
Eukaryotes |
34 |
0.40 |
Binding ≤ 10μM
|
|
C0IX24-1-E |
Carbonic Anhydrase (cluster #1 Of 5), Eukaryotic |
Eukaryotes |
690 |
0.33 |
Binding ≤ 10μM
|
|
CAH12-1-E |
Carbonic Anhydrase XII (cluster #1 Of 9), Eukaryotic |
Eukaryotes |
18 |
0.42 |
Binding ≤ 10μM |
|
CAH13-1-E |
Carbonic Anhydrase XIII (cluster #1 Of 7), Eukaryotic |
Eukaryotes |
98 |
0.38 |
Binding ≤ 10μM
|
|
CAH14-1-E |
Carbonic Anhydrase XIV (cluster #1 Of 8), Eukaryotic |
Eukaryotes |
689 |
0.33 |
Binding ≤ 10μM
|
|
CAH15-2-E |
Carbonic Anhydrase 15 (cluster #2 Of 6), Eukaryotic |
Eukaryotes |
45 |
0.40 |
Binding ≤ 10μM
|
|
CAH2-1-E |
Carbonic Anhydrase II (cluster #1 Of 15), Eukaryotic |
Eukaryotes |
21 |
0.41 |
Binding ≤ 10μM |
|
CAH4-1-E |
Carbonic Anhydrase IV (cluster #1 Of 16), Eukaryotic |
Eukaryotes |
290 |
0.35 |
Binding ≤ 10μM
|
|
CAH5A-1-E |
Carbonic Anhydrase VA (cluster #1 Of 10), Eukaryotic |
Eukaryotes |
794 |
0.33 |
Binding ≤ 10μM
|
|
CAH5B-1-E |
Carbonic Anhydrase VB (cluster #1 Of 9), Eukaryotic |
Eukaryotes |
93 |
0.38 |
Binding ≤ 10μM
|
|
CAH6-2-E |
Carbonic Anhydrase VI (cluster #2 Of 8), Eukaryotic |
Eukaryotes |
94 |
0.38 |
Binding ≤ 10μM
|
|
CAH7-1-E |
Carbonic Anhydrase VII (cluster #1 Of 8), Eukaryotic |
Eukaryotes |
2170 |
0.30 |
Binding ≤ 10μM
|
|
CAH9-1-E |
Carbonic Anhydrase IX (cluster #1 Of 11), Eukaryotic |
Eukaryotes |
16 |
0.42 |
Binding ≤ 10μM |
|
COX2-1-E |
Cytochrome C Oxidase Subunit 2 (cluster #1 Of 1), Eukaryotic |
Eukaryotes |
60 |
0.39 |
Binding ≤ 10μM
|
|
MK14-1-E |
MAP Kinase P38 Alpha (cluster #1 Of 3), Eukaryotic |
Eukaryotes |
810 |
0.33 |
Binding ≤ 10μM
|
|
PGH1-1-E |
Cyclooxygenase-1 (cluster #1 Of 6), Eukaryotic |
Eukaryotes |
9730 |
0.27 |
Binding ≤ 10μM
|
|
PGH2-4-E |
Cyclooxygenase-2 (cluster #4 Of 8), Eukaryotic |
Eukaryotes |
9 |
0.43 |
Binding ≤ 10μM
|
|
Q8HZR1-1-E |
Cyclooxygenase-1 (cluster #1 Of 1), Eukaryotic |
Eukaryotes |
5570 |
0.28 |
Binding ≤ 10μM
|
|
Q8SPQ9-2-E |
Cyclooxygenase-2 (cluster #2 Of 2), Eukaryotic |
Eukaryotes |
900 |
0.33 |
Binding ≤ 10μM
|
|
CAH2-1-E |
Carbonic Anhydrase II (cluster #1 Of 2), Eukaryotic |
Eukaryotes |
21 |
0.41 |
Functional ≤ 10μM
|
|
CAH4-1-E |
Carbonic Anhydrase IV (cluster #1 Of 2), Eukaryotic |
Eukaryotes |
290 |
0.35 |
Functional ≤ 10μM
|
|
PGH1-1-E |
Cyclooxygenase-1 (cluster #1 Of 2), Eukaryotic |
Eukaryotes |
2000 |
0.31 |
Functional ≤ 10μM
|
|
PGH2-1-E |
Cyclooxygenase-2 (cluster #1 Of 1), Eukaryotic |
Eukaryotes |
3600 |
0.29 |
Functional ≤ 10μM
|
|
CP2C9-1-E |
Cytochrome P450 2C9 (cluster #1 Of 3), Eukaryotic |
Eukaryotes |
10000 |
0.27 |
ADME/T ≤ 10μM
|
|
CAN-1-F |
Carbonic Anhydrase (cluster #1 Of 3), Fungal |
Fungi |
108 |
0.38 |
Binding ≤ 10μM
|
|
Q5AJ71-1-F |
Carbonic Anhydrase (cluster #1 Of 4), Fungal |
Fungi |
21 |
0.41 |
Binding ≤ 10μM
|
|
Z100741-1-O |
MC9 (Mast Cells) (cluster #1 Of 2), Other |
Other |
400 |
0.34 |
Functional ≤ 10μM
|
|
Z50587-1-O |
Homo Sapiens (cluster #1 Of 9), Other |
Other |
6670 |
0.28 |
Functional ≤ 10μM
|
|
Z80548-1-O |
THP-1 (Acute Monocytic Leukemia Cells) (cluster #1 Of 5), Other |
Other |
5000 |
0.29 |
Functional ≤ 10μM
|
ChEMBL Target Annotations
| Uniprot |
Swissprot |
Affinity (nM) |
LE (kcal/mol/atom) |
Type |
|
B5SU02_9CNID |
B5SU02
|
Alpha Carbonic Anhydrase, 9cnid |
34.2 |
0.40 |
Binding ≤ 1μM
|
|
C0IX24_9CNID |
C0IX24
|
Carbonic Anhydrase, 9cnid |
690 |
0.33 |
Binding ≤ 1μM
|
|
Q5AJ71_CANAL |
Q5AJ71
|
Carbonic Anhydrase, Canal |
21 |
0.41 |
Binding ≤ 1μM
|
|
CAN_YEAST |
P53615
|
Carbonic Anhydrase, Yeast |
108 |
0.38 |
Binding ≤ 1μM
|
|
CAH_METTE |
P40881
|
Carbonic Anhydrase, Mette |
140 |
0.37 |
Binding ≤ 1μM
|
|
CYNT_MYCTU |
O53573
|
Carbonic Anhydrase, Myctu |
713 |
0.33 |
Binding ≤ 1μM
|
|
CAH15_MOUSE |
Q99N23
|
Carbonic Anhydrase 15, Mouse |
45 |
0.40 |
Binding ≤ 1μM
|
|
CAH2_HUMAN |
P00918
|
Carbonic Anhydrase II, Human |
21 |
0.41 |
Binding ≤ 1μM
|
|
CAH4_BOVIN |
Q95323
|
Carbonic Anhydrase IV, Bovin |
290 |
0.35 |
Binding ≤ 1μM
|
|
CAH4_HUMAN |
P22748
|
Carbonic Anhydrase IV, Human |
880 |
0.33 |
Binding ≤ 1μM
|
|
CAH9_HUMAN |
Q16790
|
Carbonic Anhydrase IX, Human |
16 |
0.42 |
Binding ≤ 1μM
|
|
CAH5A_HUMAN |
P35218
|
Carbonic Anhydrase VA, Human |
794 |
0.33 |
Binding ≤ 1μM
|
|
CAH5B_HUMAN |
Q9Y2D0
|
Carbonic Anhydrase VB, Human |
93 |
0.38 |
Binding ≤ 1μM
|
|
CAH6_HUMAN |
P23280
|
Carbonic Anhydrase VI, Human |
94 |
0.38 |
Binding ≤ 1μM
|
|
CAH12_HUMAN |
O43570
|
Carbonic Anhydrase XII, Human |
18 |
0.42 |
Binding ≤ 1μM
|
|
CAH13_HUMAN |
Q8N1Q1
|
Carbonic Anhydrase XIII, Human |
98 |
0.38 |
Binding ≤ 1μM
|
|
CAH14_HUMAN |
Q9ULX7
|
Carbonic Anhydrase XIV, Human |
689 |
0.33 |
Binding ≤ 1μM
|
|
PGH1_HUMAN |
P23219
|
Cyclooxygenase-1, Human |
3.54 |
0.46 |
Binding ≤ 1μM
|
|
PGH1_MOUSE |
P22437
|
Cyclooxygenase-1, Mouse |
0.7 |
0.49 |
Binding ≤ 1μM
|
|
PGH1_SHEEP |
P05979
|
Cyclooxygenase-1, Sheep |
210 |
0.36 |
Binding ≤ 1μM
|
|
PGH2_HUMAN |
P35354
|
Cyclooxygenase-2, Human |
0.519995997 |
0.50 |
Binding ≤ 1μM
|
|
Q8SPQ9_CANFA |
Q8SPQ9
|
Cyclooxygenase-2, Canine |
900 |
0.33 |
Binding ≤ 1μM
|
|
PGH2_MOUSE |
Q05769
|
Cyclooxygenase-2, Mouse |
0.51 |
0.50 |
Binding ≤ 1μM
|
|
PGH2_SHEEP |
P79208
|
Cyclooxygenase-2, Sheep |
100 |
0.38 |
Binding ≤ 1μM
|
|
PGH2_BOVIN |
O62698
|
Cyclooxygenase-2, Bovin |
57 |
0.39 |
Binding ≤ 1μM
|
|
COX2_SHEEP |
O78750
|
Cytochrome C Oxidase Subunit 2, Sheep |
60 |
0.39 |
Binding ≤ 1μM
|
|
MK14_HUMAN |
Q16539
|
MAP Kinase P38 Alpha, Human |
810 |
0.33 |
Binding ≤ 1μM
|
|
B5SU02_9CNID |
B5SU02
|
Alpha Carbonic Anhydrase, 9cnid |
34.2 |
0.40 |
Binding ≤ 10μM
|
|
C0IX24_9CNID |
C0IX24
|
Carbonic Anhydrase, 9cnid |
690 |
0.33 |
Binding ≤ 10μM
|
|
CAN_YEAST |
P53615
|
Carbonic Anhydrase, Yeast |
108 |
0.38 |
Binding ≤ 10μM
|
|
CAH_METTE |
P40881
|
Carbonic Anhydrase, Mette |
1010 |
0.32 |
Binding ≤ 10μM
|
|
CYNT_MYCTU |
O53573
|
Carbonic Anhydrase, Myctu |
713 |
0.33 |
Binding ≤ 10μM
|
|
Q5AJ71_CANAL |
Q5AJ71
|
Carbonic Anhydrase, Canal |
1017 |
0.32 |
Binding ≤ 10μM
|
|
CAH15_MOUSE |
Q99N23
|
Carbonic Anhydrase 15, Mouse |
45 |
0.40 |
Binding ≤ 10μM
|
|
CAH2_HUMAN |
P00918
|
Carbonic Anhydrase II, Human |
21 |
0.41 |
Binding ≤ 10μM
|
|
CAH4_HUMAN |
P22748
|
Carbonic Anhydrase IV, Human |
880 |
0.33 |
Binding ≤ 10μM
|
|
CAH4_BOVIN |
Q95323
|
Carbonic Anhydrase IV, Bovin |
290 |
0.35 |
Binding ≤ 10μM
|
|
CAH9_HUMAN |
Q16790
|
Carbonic Anhydrase IX, Human |
16 |
0.42 |
Binding ≤ 10μM
|
|
CAH5A_HUMAN |
P35218
|
Carbonic Anhydrase VA, Human |
794 |
0.33 |
Binding ≤ 10μM
|
|
CAH5B_HUMAN |
Q9Y2D0
|
Carbonic Anhydrase VB, Human |
93 |
0.38 |
Binding ≤ 10μM
|
|
CAH6_HUMAN |
P23280
|
Carbonic Anhydrase VI, Human |
94 |
0.38 |
Binding ≤ 10μM
|
|
CAH7_HUMAN |
P43166
|
Carbonic Anhydrase VII, Human |
2170 |
0.30 |
Binding ≤ 10μM
|
|
CAH12_HUMAN |
O43570
|
Carbonic Anhydrase XII, Human |
18 |
0.42 |
Binding ≤ 10μM
|
|
CAH13_HUMAN |
Q8N1Q1
|
Carbonic Anhydrase XIII, Human |
98 |
0.38 |
Binding ≤ 10μM
|
|
CAH14_HUMAN |
Q9ULX7
|
Carbonic Anhydrase XIV, Human |
689 |
0.33 |
Binding ≤ 10μM
|
|
PGH1_HUMAN |
P23219
|
Cyclooxygenase-1, Human |
1689 |
0.31 |
Binding ≤ 10μM
|
|
PGH1_MOUSE |
P22437
|
Cyclooxygenase-1, Mouse |
0.7 |
0.49 |
Binding ≤ 10μM
|
|
PGH1_SHEEP |
P05979
|
Cyclooxygenase-1, Sheep |
210 |
0.36 |
Binding ≤ 10μM
|
|
PGH1_BOVIN |
O62664
|
Cyclooxygenase-1, Bovin |
7700 |
0.28 |
Binding ≤ 10μM
|
|
Q8HZR1_CANFA |
Q8HZR1
|
Cyclooxygenase-1, Canine |
5570 |
0.28 |
Binding ≤ 10μM
|
|
PGH2_MOUSE |
Q05769
|
Cyclooxygenase-2, Mouse |
0.51 |
0.50 |
Binding ≤ 10μM
|
|
PGH2_SHEEP |
P79208
|
Cyclooxygenase-2, Sheep |
100 |
0.38 |
Binding ≤ 10μM
|
|
PGH2_BOVIN |
O62698
|
Cyclooxygenase-2, Bovin |
57 |
0.39 |
Binding ≤ 10μM
|
|
Q8SPQ9_CANFA |
Q8SPQ9
|
Cyclooxygenase-2, Canine |
900 |
0.33 |
Binding ≤ 10μM
|
|
PGH2_RAT |
P35355
|
Cyclooxygenase-2, Rat |
1100 |
0.32 |
Binding ≤ 10μM
|
|
PGH2_HUMAN |
P35354
|
Cyclooxygenase-2, Human |
0.519995997 |
0.50 |
Binding ≤ 10μM
|
|
COX2_SHEEP |
O78750
|
Cytochrome C Oxidase Subunit 2, Sheep |
60 |
0.39 |
Binding ≤ 10μM
|
|
MK14_HUMAN |
Q16539
|
MAP Kinase P38 Alpha, Human |
810 |
0.33 |
Binding ≤ 10μM
|
|
CAH2_HUMAN |
P00918
|
Carbonic Anhydrase II, Human |
21 |
0.41 |
Functional ≤ 10μM
|
|
CAH4_BOVIN |
Q95323
|
Carbonic Anhydrase IV, Bovin |
290 |
0.35 |
Functional ≤ 10μM
|
|
PGH1_HUMAN |
P23219
|
Cyclooxygenase-1, Human |
1880 |
0.31 |
Functional ≤ 10μM
|
|
PGH2_HUMAN |
P35354
|
Cyclooxygenase-2, Human |
110 |
0.37 |
Functional ≤ 10μM
|
|
Z50587 |
Z50587
|
Homo Sapiens |
164 |
0.37 |
Functional ≤ 10μM
|
|
Z100741 |
Z100741
|
MC9 (Mast Cells) |
300 |
0.35 |
Functional ≤ 10μM
|
|
Z80548 |
Z80548
|
THP-1 (Acute Monocytic Leukemia Cells) |
5000 |
0.29 |
Functional ≤ 10μM
|
|
CP2C9_HUMAN |
P11712
|
Cytochrome P450 2C9, Human |
10000 |
0.27 |
ADME/T ≤ 10μM
|
Physical Representations
|
Type
pH range
|
xlogP
|
Des A‑Pol
Apolar desolvation
(kcal/mol)
|
Des Pol
Polar desolvation
(kcal/mol)
|
H Don
H-bond donors
|
H Acc
H-bond acceptors
|
Chg
Net charge
|
tPSA
(Ų)
|
MWT
Molecular weight
(g/mol)
|
RB
Rotatable bonds
|
DL |
|
Ref
Reference (pH 7)
|
3.61 |
5.33 |
-11.94 |
2 |
5 |
0 |
78 |
381.379 |
4 |
↓
|
|
|
|
Analogs
Draw
Identity
99%
90%
80%
70%
Physical Representations
|
Type
pH range
|
xlogP
|
Des A‑Pol
Apolar desolvation
(kcal/mol)
|
Des Pol
Polar desolvation
(kcal/mol)
|
H Don
H-bond donors
|
H Acc
H-bond acceptors
|
Chg
Net charge
|
tPSA
(Ų)
|
MWT
Molecular weight
(g/mol)
|
RB
Rotatable bonds
|
DL |
|
Ref
Reference (pH 7)
|
0.09 |
0.24 |
-3.12 |
4 |
2 |
0 |
52 |
108.144 |
0 |
↓
|
|
|
|
Analogs
-
8585156
-
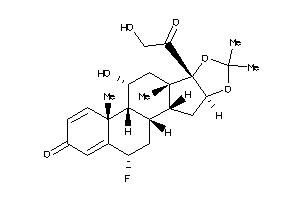
-
3977840
-
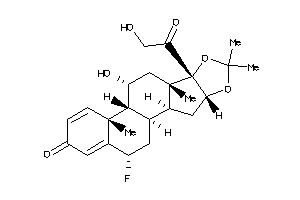
Draw
Identity
99%
90%
80%
70%
Physical Representations
|
Type
pH range
|
xlogP
|
Des A‑Pol
Apolar desolvation
(kcal/mol)
|
Des Pol
Polar desolvation
(kcal/mol)
|
H Don
H-bond donors
|
H Acc
H-bond acceptors
|
Chg
Net charge
|
tPSA
(Ų)
|
MWT
Molecular weight
(g/mol)
|
RB
Rotatable bonds
|
DL |
|
Ref
Reference (pH 7)
|
2.59 |
5.98 |
-18.64 |
2 |
6 |
0 |
93 |
434.504 |
2 |
↓
|
|
|
|
|
|
|
Analogs
Draw
Identity
99%
90%
80%
70%
Physical Representations
|
Type
pH range
|
xlogP
|
Des A‑Pol
Apolar desolvation
(kcal/mol)
|
Des Pol
Polar desolvation
(kcal/mol)
|
H Don
H-bond donors
|
H Acc
H-bond acceptors
|
Chg
Net charge
|
tPSA
(Ų)
|
MWT
Molecular weight
(g/mol)
|
RB
Rotatable bonds
|
DL |
|
Ref
Reference (pH 7)
|
3.56 |
8.77 |
-8.33 |
1 |
2 |
0 |
37 |
312.453 |
1 |
↓
|
|
|
|
Analogs
Draw
Identity
99%
90%
80%
70%
Clustered Target Annotations
| Code |
Organism Class |
Affinity (nM) |
LE (kcal/mol/atom) |
Type |
|
PARP1-3-E |
Poly [ADP-ribose] Polymerase 1 (cluster #3 Of 3), Eukaryotic |
Eukaryotes |
26 |
0.66 |
Binding ≤ 10μM
|
|
Z80682-2-O |
A549 (Lung Carcinoma Cells) (cluster #2 Of 11), Other |
Other |
180 |
0.59 |
Functional ≤ 10μM
|
Physical Representations
|
Type
pH range
|
xlogP
|
Des A‑Pol
Apolar desolvation
(kcal/mol)
|
Des Pol
Polar desolvation
(kcal/mol)
|
H Don
H-bond donors
|
H Acc
H-bond acceptors
|
Chg
Net charge
|
tPSA
(Ų)
|
MWT
Molecular weight
(g/mol)
|
RB
Rotatable bonds
|
DL |
|
Ref
Reference (pH 7)
|
1.43 |
1.67 |
-13.39 |
3 |
4 |
0 |
76 |
212.208 |
0 |
↓
|
|
|
|
Analogs
-
7996909
-
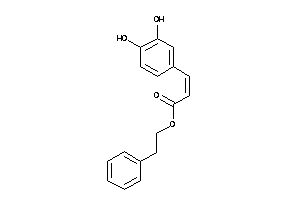
Draw
Identity
99%
90%
80%
70%
Physical Representations
|
Type
pH range
|
xlogP
|
Des A‑Pol
Apolar desolvation
(kcal/mol)
|
Des Pol
Polar desolvation
(kcal/mol)
|
H Don
H-bond donors
|
H Acc
H-bond acceptors
|
Chg
Net charge
|
tPSA
(Ų)
|
MWT
Molecular weight
(g/mol)
|
RB
Rotatable bonds
|
DL |
|
Ref
Reference (pH 7)
|
3.36 |
6.23 |
-10.48 |
2 |
4 |
0 |
67 |
284.311 |
6 |
↓
|
|
|
|
|
|
|
Analogs
-
1707020
-
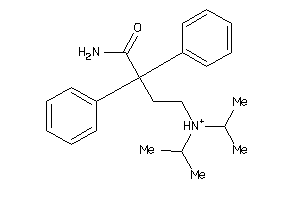
-
1718667
-
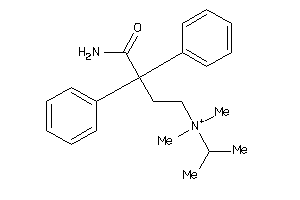
Draw
Identity
99%
90%
80%
70%
Physical Representations
|
Type
pH range
|
xlogP
|
Des A‑Pol
Apolar desolvation
(kcal/mol)
|
Des Pol
Polar desolvation
(kcal/mol)
|
H Don
H-bond donors
|
H Acc
H-bond acceptors
|
Chg
Net charge
|
tPSA
(Ų)
|
MWT
Molecular weight
(g/mol)
|
RB
Rotatable bonds
|
DL |
|
Ref
Reference (pH 7)
|
0.11 |
10 |
-37.7 |
2 |
3 |
1 |
43 |
353.53 |
8 |
↓
|
|
|
|
Analogs
Draw
Identity
99%
90%
80%
70%
Physical Representations
|
Type
pH range
|
xlogP
|
Des A‑Pol
Apolar desolvation
(kcal/mol)
|
Des Pol
Polar desolvation
(kcal/mol)
|
H Don
H-bond donors
|
H Acc
H-bond acceptors
|
Chg
Net charge
|
tPSA
(Ų)
|
MWT
Molecular weight
(g/mol)
|
RB
Rotatable bonds
|
DL |
|
Ref
Reference (pH 7)
|
-0.97 |
-0.4 |
-10.32 |
3 |
4 |
0 |
68 |
137.142 |
1 |
↓
|
|
|
|
Analogs
Draw
Identity
99%
90%
80%
70%
Physical Representations
|
Type
pH range
|
xlogP
|
Des A‑Pol
Apolar desolvation
(kcal/mol)
|
Des Pol
Polar desolvation
(kcal/mol)
|
H Don
H-bond donors
|
H Acc
H-bond acceptors
|
Chg
Net charge
|
tPSA
(Ų)
|
MWT
Molecular weight
(g/mol)
|
RB
Rotatable bonds
|
DL |
|
Ref
Reference (pH 7)
|
3.14 |
-0.57 |
-10.02 |
2 |
3 |
0 |
46 |
238.29 |
0 |
↓
|
|
|
|
Analogs
Draw
Identity
99%
90%
80%
70%
Clustered Target Annotations
| Code |
Organism Class |
Affinity (nM) |
LE (kcal/mol/atom) |
Type |
|
GCR-2-E |
Glucocorticoid Receptor (cluster #2 Of 2), Eukaryotic |
Eukaryotes |
30 |
0.41 |
Binding ≤ 10μM
|
|
Z50594-7-O |
Mus Musculus (cluster #7 Of 9), Other |
Other |
15 |
0.42 |
Functional ≤ 10μM |
|
Z80418-3-O |
RAW264.7 (Monocytic-macrophage Leukemia Cells) (cluster #3 Of 9), Other |
Other |
61 |
0.39 |
Functional ≤ 10μM
|
Physical Representations
|
Type
pH range
|
xlogP
|
Des A‑Pol
Apolar desolvation
(kcal/mol)
|
Des Pol
Polar desolvation
(kcal/mol)
|
H Don
H-bond donors
|
H Acc
H-bond acceptors
|
Chg
Net charge
|
tPSA
(Ų)
|
MWT
Molecular weight
(g/mol)
|
RB
Rotatable bonds
|
DL |
|
Ref
Reference (pH 7)
|
1.62 |
3.13 |
-14.6 |
3 |
5 |
0 |
95 |
362.466 |
2 |
↓
|
|
|
|
|
|
|
Analogs
-
3984042
-
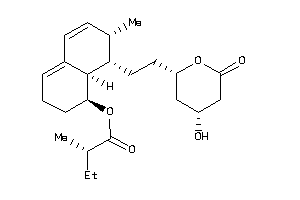
-
4245612
-
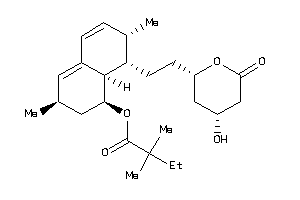
-
4245664
-
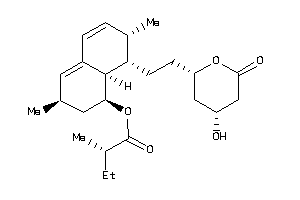
-
4521332
-
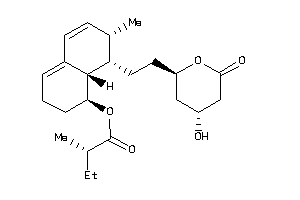
-
26504552
-
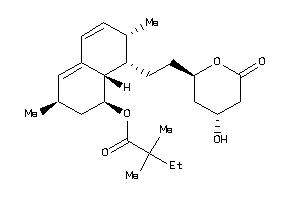
Draw
Identity
99%
90%
80%
70%
Clustered Target Annotations
| Code |
Organism Class |
Affinity (nM) |
LE (kcal/mol/atom) |
Type |
|
HMDH-1-E |
HMG-CoA Reductase (cluster #1 Of 2), Eukaryotic |
Eukaryotes |
8 |
0.39 |
Binding ≤ 10μM
|
|
HMDH-1-E |
HMG-CoA Reductase (cluster #1 Of 2), Eukaryotic |
Eukaryotes |
9 |
0.39 |
Binding ≤ 10μM
|
|
HMDH-1-E |
HMG-CoA Reductase (cluster #1 Of 2), Eukaryotic |
Eukaryotes |
27 |
0.37 |
Binding ≤ 10μM |
|
HMDH-1-E |
HMG-CoA Reductase (cluster #1 Of 1), Eukaryotic |
Eukaryotes |
50 |
0.35 |
Functional ≤ 10μM
|
|
ICAM1-2-E |
Intercellular Adhesion Molecule-1 (cluster #2 Of 2), Eukaryotic |
Eukaryotes |
3780 |
0.26 |
Functional ≤ 10μM
|
|
ITAL-2-E |
Leukocyte Adhesion Glycoprotein LFA-1 Alpha (cluster #2 Of 2), Eukaryotic |
Eukaryotes |
3780 |
0.26 |
Functional ≤ 10μM
|
|
Z50597-11-O |
Rattus Norvegicus (cluster #11 Of 12), Other |
Other |
25 |
0.37 |
Functional ≤ 10μM
|
|
Z80526-1-O |
SW480 (Colon Adenocarcinoma Cells) (cluster #1 Of 6), Other |
Other |
7100 |
0.25 |
Functional ≤ 10μM
|
|
Z80952-1-O |
HES (cluster #1 Of 1), Other |
Other |
17 |
0.38 |
Functional ≤ 10μM
|
|
Z81020-2-O |
HepG2 (Hepatoblastoma Cells) (cluster #2 Of 8), Other |
Other |
50 |
0.35 |
Functional ≤ 10μM
|
|
Z81020-2-O |
HepG2 (Hepatoblastoma Cells) (cluster #2 Of 8), Other |
Other |
79 |
0.34 |
Functional ≤ 10μM
|
Physical Representations
|
Type
pH range
|
xlogP
|
Des A‑Pol
Apolar desolvation
(kcal/mol)
|
Des Pol
Polar desolvation
(kcal/mol)
|
H Don
H-bond donors
|
H Acc
H-bond acceptors
|
Chg
Net charge
|
tPSA
(Ų)
|
MWT
Molecular weight
(g/mol)
|
RB
Rotatable bonds
|
DL |
|
Ref
Reference (pH 7)
|
4.35 |
11.28 |
-12.84 |
1 |
5 |
0 |
73 |
404.547 |
7 |
↓
|
|
|
|
|
|
|
Analogs
-
4212843
-
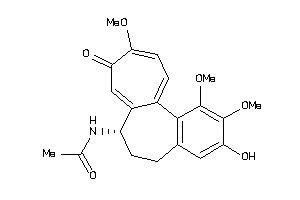
-
607790
-
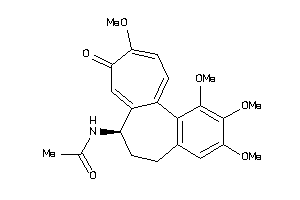
Draw
Identity
99%
90%
80%
70%
Clustered Target Annotations
| Code |
Organism Class |
Affinity (nM) |
LE (kcal/mol/atom) |
Type |
|
Q862F3-2-E |
Tubulin Alpha Chain (cluster #2 Of 2), Eukaryotic |
Eukaryotes |
2500 |
0.27 |
Binding ≤ 10μM |
|
Q862L2-2-E |
Tubulin Alpha-1 Chain (cluster #2 Of 2), Eukaryotic |
Eukaryotes |
2500 |
0.27 |
Binding ≤ 10μM |
|
TBA1A-1-E |
Tubulin Alpha-3 Chain (cluster #1 Of 3), Eukaryotic |
Eukaryotes |
5750 |
0.25 |
Binding ≤ 10μM
|
|
TBA4A-1-E |
Tubulin Alpha-1 Chain (cluster #1 Of 1), Eukaryotic |
Eukaryotes |
2700 |
0.27 |
Binding ≤ 10μM
|
|
TBB-1-E |
Tubulin Beta Chain (cluster #1 Of 1), Eukaryotic |
Eukaryotes |
1260 |
0.28 |
Binding ≤ 10μM
|
|
TBB1-1-E |
Tubulin Beta-1 Chain (cluster #1 Of 2), Eukaryotic |
Eukaryotes |
800 |
0.29 |
Binding ≤ 10μM
|
|
TBB2B-1-E |
Tubulin Beta Chain (cluster #1 Of 1), Eukaryotic |
Eukaryotes |
780 |
0.29 |
Binding ≤ 10μM
|
|
TBB3-1-E |
Tubulin Beta-3 Chain (cluster #1 Of 1), Eukaryotic |
Eukaryotes |
5750 |
0.25 |
Binding ≤ 10μM
|
|
TBB4A-1-E |
Tubulin Beta-4 Chain (cluster #1 Of 1), Eukaryotic |
Eukaryotes |
500 |
0.30 |
Binding ≤ 10μM
|
|
TBB4B-1-E |
Tubulin Beta-2 Chain (cluster #1 Of 1), Eukaryotic |
Eukaryotes |
500 |
0.30 |
Binding ≤ 10μM
|
|
TBB5-1-E |
Tubulin Beta-5 Chain (cluster #1 Of 1), Eukaryotic |
Eukaryotes |
5750 |
0.25 |
Binding ≤ 10μM
|
|
TBB8-1-E |
Tubulin Beta-8 Chain (cluster #1 Of 1), Eukaryotic |
Eukaryotes |
500 |
0.30 |
Binding ≤ 10μM
|
|
TBG1-1-E |
Tubulin Gamma-1 Chain (cluster #1 Of 1), Eukaryotic |
Eukaryotes |
5750 |
0.25 |
Binding ≤ 10μM
|
|
Q862F3-1-E |
Tubulin Alpha Chain (cluster #1 Of 2), Eukaryotic |
Eukaryotes |
8700 |
0.24 |
Functional ≤ 10μM
|
|
Q862L2-1-E |
Tubulin Alpha-1 Chain (cluster #1 Of 2), Eukaryotic |
Eukaryotes |
8700 |
0.24 |
Functional ≤ 10μM
|
|
TBA1A-1-E |
Tubulin Alpha-1 Chain (cluster #1 Of 2), Eukaryotic |
Eukaryotes |
800 |
0.29 |
Functional ≤ 10μM
|
|
TBA4A-1-E |
Tubulin Alpha-1 Chain (cluster #1 Of 1), Eukaryotic |
Eukaryotes |
1700 |
0.28 |
Functional ≤ 10μM
|
|
TBB1-1-E |
Tubulin Beta-1 Chain (cluster #1 Of 2), Eukaryotic |
Eukaryotes |
800 |
0.29 |
Functional ≤ 10μM
|
|
TBB2B-1-E |
Tubulin Beta Chain (cluster #1 Of 2), Eukaryotic |
Eukaryotes |
8700 |
0.24 |
Functional ≤ 10μM
|
|
TBB3-1-E |
Tubulin Beta-3 Chain (cluster #1 Of 3), Eukaryotic |
Eukaryotes |
4200 |
0.26 |
Functional ≤ 10μM
|
|
TBB4A-1-E |
Tubulin Beta-4 Chain (cluster #1 Of 3), Eukaryotic |
Eukaryotes |
4200 |
0.26 |
Functional ≤ 10μM
|
|
TBB4B-1-E |
Tubulin Beta-2 Chain (cluster #1 Of 3), Eukaryotic |
Eukaryotes |
4200 |
0.26 |
Functional ≤ 10μM
|
|
TBB5-1-E |
Tubulin Beta-5 Chain (cluster #1 Of 1), Eukaryotic |
Eukaryotes |
3300 |
0.26 |
Functional ≤ 10μM
|
|
TBB8-1-E |
Tubulin Beta-8 Chain (cluster #1 Of 3), Eukaryotic |
Eukaryotes |
4200 |
0.26 |
Functional ≤ 10μM
|
|
Z101682-1-O |
BK Polyomavirus (cluster #1 Of 2), Other |
Other |
22 |
0.37 |
Functional ≤ 10μM
|
|
Z103203-1-O |
A375 (cluster #1 Of 3), Other |
Other |
20 |
0.37 |
Functional ≤ 10μM |
|
Z103205-1-O |
A431 (cluster #1 Of 4), Other |
Other |
53 |
0.35 |
Functional ≤ 10μM
|
|
Z50425-3-O |
Plasmodium Falciparum (cluster #3 Of 22), Other |
Other |
10000 |
0.24 |
Functional ≤ 10μM
|
|
Z50590-1-O |
Sus Scrofa (cluster #1 Of 1), Other |
Other |
1400 |
0.28 |
Functional ≤ 10μM
|
|
Z50607-1-O |
Human Immunodeficiency Virus 1 (cluster #1 Of 10), Other |
Other |
18 |
0.37 |
Functional ≤ 10μM |
|
Z80002-1-O |
1A9 (Ovarian Adenocarcinoma Cells) (cluster #1 Of 2), Other |
Other |
12 |
0.38 |
Functional ≤ 10μM
|
|
Z80024-1-O |
A9 (Fibroblast Cells) (cluster #1 Of 3), Other |
Other |
14 |
0.38 |
Functional ≤ 10μM
|
|
Z80025-1-O |
ACHN (Renal Adenocarcinoma Cells) (cluster #1 Of 3), Other |
Other |
40 |
0.36 |
Functional ≤ 10μM
|
|
Z80035-1-O |
B16 (Melanoma Cells) (cluster #1 Of 7), Other |
Other |
31 |
0.36 |
Functional ≤ 10μM
|
|
Z80088-1-O |
CHO (Ovarian Cells) (cluster #1 Of 4), Other |
Other |
220 |
0.32 |
Functional ≤ 10μM |
|
Z80096-1-O |
CHO-TAX 5-6 (cluster #1 Of 2), Other |
Other |
140 |
0.33 |
Functional ≤ 10μM |
|
Z80097-1-O |
CHO-VV 3-2 (cluster #1 Of 2), Other |
Other |
620 |
0.30 |
Functional ≤ 10μM |
|
Z80120-1-O |
DLD-1 (Colon Adenocarcinoma Cells) (cluster #1 Of 5), Other |
Other |
190 |
0.32 |
Functional ≤ 10μM
|
|
Z80125-1-O |
DU-145 (Prostate Carcinoma) (cluster #1 Of 9), Other |
Other |
10 |
0.39 |
Functional ≤ 10μM |
|
Z80156-1-O |
HL-60 (Promyeloblast Leukemia Cells) (cluster #1 Of 12), Other |
Other |
53 |
0.35 |
Functional ≤ 10μM
|
|
Z80164-1-O |
HT-1080 (Fibrosarcoma Cells) (cluster #1 Of 6), Other |
Other |
1 |
0.43 |
Functional ≤ 10μM |
|
Z80166-1-O |
HT-29 (Colon Adenocarcinoma Cells) (cluster #1 Of 12), Other |
Other |
22 |
0.37 |
Functional ≤ 10μM
|
|
Z80186-1-O |
K562 (Erythroleukemia Cells) (cluster #1 Of 11), Other |
Other |
7 |
0.39 |
Functional ≤ 10μM |
|
Z80193-2-O |
L1210 (Lymphocytic Leukemia Cells) (cluster #2 Of 12), Other |
Other |
7 |
0.39 |
Functional ≤ 10μM |
|
Z80211-1-O |
LoVo (Colon Adenocarcinoma Cells) (cluster #1 Of 5), Other |
Other |
6 |
0.40 |
Functional ≤ 10μM
|
|
Z80224-1-O |
MCF7 (Breast Carcinoma Cells) (cluster #1 Of 14), Other |
Other |
1900 |
0.28 |
Functional ≤ 10μM |
|
Z80244-4-O |
MDA-MB-468 (Breast Adenocarcinoma) (cluster #4 Of 7), Other |
Other |
7 |
0.39 |
Functional ≤ 10μM
|
|
Z80269-1-O |
MKN-45 (Gastric Adenocarcinoma Cells) (cluster #1 Of 3), Other |
Other |
15 |
0.38 |
Functional ≤ 10μM
|
|
Z80354-1-O |
OVCAR-3 (Ovarian Adenocarcinoma Cells) (cluster #1 Of 4), Other |
Other |
800 |
0.29 |
Functional ≤ 10μM
|
|
Z80362-1-O |
P388 (Lymphoma Cells) (cluster #1 Of 8), Other |
Other |
10 |
0.39 |
Functional ≤ 10μM
|
|
Z80390-1-O |
PC-3 (Prostate Carcinoma Cells) (cluster #1 Of 10), Other |
Other |
33 |
0.36 |
Functional ≤ 10μM |
|
Z80414-1-O |
Raji (B-lymphoblastic Cells) (cluster #1 Of 3), Other |
Other |
14 |
0.38 |
Functional ≤ 10μM
|
|
Z80427-1-O |
RKO (Colon Carcinoma) (cluster #1 Of 1), Other |
Other |
20 |
0.37 |
Functional ≤ 10μM
|
|
Z80466-1-O |
SF268 (cluster #1 Of 4), Other |
Other |
50 |
0.35 |
Functional ≤ 10μM |
|
Z80475-1-O |
SK-BR-3 (Breast Adenocarcinoma) (cluster #1 Of 3), Other |
Other |
5 |
0.40 |
Functional ≤ 10μM
|
|
Z80493-2-O |
SK-OV-3 (Ovarian Carcinoma Cells) (cluster #2 Of 6), Other |
Other |
71 |
0.35 |
Functional ≤ 10μM
|
|
Z80526-1-O |
SW480 (Colon Adenocarcinoma Cells) (cluster #1 Of 6), Other |
Other |
30 |
0.36 |
Functional ≤ 10μM |
|
Z80566-1-O |
U-937 (Histiocytic Lymphoma Cells) (cluster #1 Of 2), Other |
Other |
5 |
0.40 |
Functional ≤ 10μM
|
|
Z80583-1-O |
Vero (Kidney Cells) (cluster #1 Of 7), Other |
Other |
390 |
0.31 |
Functional ≤ 10μM
|
|
Z80608-1-O |
ZR-75-1 (Breast Carcinoma Cells) (cluster #1 Of 4), Other |
Other |
6 |
0.40 |
Functional ≤ 10μM
|
|
Z80682-1-O |
A549 (Lung Carcinoma Cells) (cluster #1 Of 11), Other |
Other |
45 |
0.35 |
Functional ≤ 10μM
|
|
Z80711-1-O |
NCI/ADR-RES (Breast Carcinoma Cells) (cluster #1 Of 2), Other |
Other |
1113 |
0.29 |
Functional ≤ 10μM |
|
Z80712-2-O |
T47D (Breast Carcinoma Cells) (cluster #2 Of 7), Other |
Other |
9 |
0.39 |
Functional ≤ 10μM
|
|
Z80720-1-O |
Burkitts Lymphoma Cells (cluster #1 Of 1), Other |
Other |
50 |
0.35 |
Functional ≤ 10μM
|
|
Z80819-1-O |
J774.2 (cluster #1 Of 1), Other |
Other |
52 |
0.35 |
Functional ≤ 10μM |
|
Z80852-1-O |
A-431 (Epidermoid Carcinoma Cells) (cluster #1 Of 3), Other |
Other |
3 |
0.41 |
Functional ≤ 10μM
|
|
Z80874-1-O |
CEM (T-cell Leukemia) (cluster #1 Of 7), Other |
Other |
8 |
0.39 |
Functional ≤ 10μM |
|
Z80928-3-O |
HCT-116 (Colon Carcinoma Cells) (cluster #3 Of 9), Other |
Other |
40 |
0.36 |
Functional ≤ 10μM
|
|
Z81020-3-O |
HepG2 (Hepatoblastoma Cells) (cluster #3 Of 8), Other |
Other |
50 |
0.35 |
Functional ≤ 10μM |
|
Z81024-1-O |
NCI-H460 (Non-small Cell Lung Carcinoma) (cluster #1 Of 8), Other |
Other |
70 |
0.35 |
Functional ≤ 10μM |
|
Z81054-2-O |
SF-268 (Glioblastoma Cells) (cluster #2 Of 3), Other |
Other |
50 |
0.35 |
Functional ≤ 10μM
|
|
Z81072-1-O |
Jurkat (Acute Leukemic T-cells) (cluster #1 Of 10), Other |
Other |
17 |
0.38 |
Functional ≤ 10μM |
|
Z81115-1-O |
KB (Squamous Cell Carcinoma) (cluster #1 Of 6), Other |
Other |
6 |
0.40 |
Functional ≤ 10μM
|
|
Z81170-1-O |
LNCaP (Prostate Carcinoma) (cluster #1 Of 5), Other |
Other |
20 |
0.37 |
Functional ≤ 10μM |
|
Z81244-1-O |
J774 (Macrophage Cells) (cluster #1 Of 1), Other |
Other |
93 |
0.34 |
Functional ≤ 10μM |
|
Z81245-1-O |
MDA-MB-435 (Breast Carcinoma Cells) (cluster #1 Of 6), Other |
Other |
7 |
0.39 |
Functional ≤ 10μM
|
|
Z81247-1-O |
HeLa (Cervical Adenocarcinoma Cells) (cluster #1 Of 9), Other |
Other |
39 |
0.36 |
Functional ≤ 10μM
|
|
Z81252-3-O |
MDA-MB-231 (Breast Adenocarcinoma Cells) (cluster #3 Of 11), Other |
Other |
70 |
0.35 |
Functional ≤ 10μM
|
|
Z81281-1-O |
NCI-H23 (Non-small Cell Lung Carcinoma Cells) (cluster #1 Of 5), Other |
Other |
13 |
0.38 |
Functional ≤ 10μM |
|
Z81283-1-O |
NCI-H522 (Non-small Cell Lung Carcinoma Cells) (cluster #1 Of 2), Other |
Other |
14 |
0.38 |
Functional ≤ 10μM |
|
Z81331-1-O |
SW-620 (Colon Adenocarcinoma Cells) (cluster #1 Of 6), Other |
Other |
14 |
0.38 |
Functional ≤ 10μM |
|
Z81335-2-O |
HCT-15 (Colon Adenocarcinoma Cells) (cluster #2 Of 5), Other |
Other |
140 |
0.33 |
Functional ≤ 10μM
|
|
Z80583-1-O |
Vero (Kidney Cells) (cluster #1 Of 3), Other |
Other |
530 |
0.30 |
ADME/T ≤ 10μM
|
|
Z80608-1-O |
ZR-75-1 (Breast Carcinoma Cells) (cluster #1 Of 1), Other |
Other |
522 |
0.30 |
ADME/T ≤ 10μM
|
|
Z80897-1-O |
H9 (T-lymphoid Cells) (cluster #1 Of 2), Other |
Other |
10 |
0.39 |
ADME/T ≤ 10μM |
|
Z80928-1-O |
HCT-116 (Colon Carcinoma Cells) (cluster #1 Of 2), Other |
Other |
3 |
0.41 |
ADME/T ≤ 10μM
|
|
Z81244-1-O |
J774 (Macrophage Cells) (cluster #1 Of 3), Other |
Other |
210 |
0.32 |
ADME/T ≤ 10μM
|
|
Z81247-1-O |
HeLa (Cervical Adenocarcinoma Cells) (cluster #1 Of 3), Other |
Other |
2 |
0.42 |
ADME/T ≤ 10μM
|
ChEMBL Target Annotations
| Uniprot |
Swissprot |
Affinity (nM) |
LE (kcal/mol/atom) |
Type |
|
TBA1A_PIG |
P02550
|
Tubulin Alpha Chain, Pig |
800 |
0.29 |
Binding ≤ 1μM
|
|
TBA1A_RAT |
P68370
|
Tubulin Alpha-1 Chain, Rat |
800 |
0.29 |
Binding ≤ 1μM
|
|
TBB2B_BOVIN |
Q6B856
|
Tubulin Beta Chain, Bovin |
780 |
0.29 |
Binding ≤ 1μM
|
|
TBB1_HUMAN |
Q9H4B7
|
Tubulin Beta-1 Chain, Human |
800 |
0.29 |
Binding ≤ 1μM
|
|
TBB4B_HUMAN |
P68371
|
Tubulin Beta-2 Chain, Human |
500 |
0.30 |
Binding ≤ 1μM
|
|
TBB3_HUMAN |
Q13509
|
Tubulin Beta-3 Chain, Human |
500 |
0.30 |
Binding ≤ 1μM
|
|
TBB4A_HUMAN |
P04350
|
Tubulin Beta-4 Chain, Human |
500 |
0.30 |
Binding ≤ 1μM
|
|
TBB5_HUMAN |
P07437
|
Tubulin Beta-5 Chain, Human |
500 |
0.30 |
Binding ≤ 1μM
|
|
TBB8_HUMAN |
Q3ZCM7
|
Tubulin Beta-8 Chain, Human |
500 |
0.30 |
Binding ≤ 1μM
|
|
Q862F3_BOVIN |
Q862F3
|
Tubulin Alpha Chain, Bovin |
1900 |
0.28 |
Binding ≤ 10μM
|
|
TBA1A_PIG |
P02550
|
Tubulin Alpha Chain, Pig |
10000 |
0.24 |
Binding ≤ 10μM
|
|
Q862L2_BOVIN |
Q862L2
|
Tubulin Alpha-1 Chain, Bovin |
1900 |
0.28 |
Binding ≤ 10μM
|
|
TBA4A_HUMAN |
P68366
|
Tubulin Alpha-1 Chain, Human |
2700 |
0.27 |
Binding ≤ 10μM
|
|
TBA1A_RAT |
P68370
|
Tubulin Alpha-1 Chain, Rat |
800 |
0.29 |
Binding ≤ 10μM
|
|
TBA1A_HUMAN |
Q71U36
|
Tubulin Alpha-3 Chain, Human |
5750 |
0.25 |
Binding ≤ 10μM
|
|
TBB2B_BOVIN |
Q6B856
|
Tubulin Beta Chain, Bovin |
1250 |
0.28 |
Binding ≤ 10μM
|
|
TBB_PIG |
P02554
|
Tubulin Beta Chain, Pig |
10000 |
0.24 |
Binding ≤ 10μM
|
|
TBB2B_RAT |
Q3KRE8
|
Tubulin Beta Chain, Rat |
5750 |
0.25 |
Binding ≤ 10μM
|
|
TBB1_HUMAN |
Q9H4B7
|
Tubulin Beta-1 Chain, Human |
1400 |
0.28 |
Binding ≤ 10μM
|
|
TBB4B_HUMAN |
P68371
|
Tubulin Beta-2 Chain, Human |
1400 |
0.28 |
Binding ≤ 10μM
|
|
TBB3_RAT |
Q4QRB4
|
Tubulin Beta-3 Chain, Rat |
5750 |
0.25 |
Binding ≤ 10μM
|
|
TBB3_HUMAN |
Q13509
|
Tubulin Beta-3 Chain, Human |
1400 |
0.28 |
Binding ≤ 10μM
|
|
TBB4A_HUMAN |
P04350
|
Tubulin Beta-4 Chain, Human |
1400 |
0.28 |
Binding ≤ 10μM
|
|
TBB5_HUMAN |
P07437
|
Tubulin Beta-5 Chain, Human |
500 |
0.30 |
Binding ≤ 10μM
|
|
TBB8_HUMAN |
Q3ZCM7
|
Tubulin Beta-8 Chain, Human |
1400 |
0.28 |
Binding ≤ 10μM
|
|
TBG1_RAT |
P83888
|
Tubulin Gamma-1 Chain, Rat |
5750 |
0.25 |
Binding ≤ 10μM
|
|
Z80002 |
Z80002
|
1A9 (Ovarian Adenocarcinoma Cells) |
11.9 |
0.38 |
Functional ≤ 10μM
|
|
Z80852 |
Z80852
|
A-431 (Epidermoid Carcinoma Cells) |
14 |
0.38 |
Functional ≤ 10μM
|
|
Z103203 |
Z103203
|
A375 |
20 |
0.37 |
Functional ≤ 10μM
|
|
Z103205 |
Z103205
|
A431 |
53.2 |
0.35 |
Functional ≤ 10μM
|
|
Z80682 |
Z80682
|
A549 (Lung Carcinoma Cells) |
1000 |
0.29 |
Functional ≤ 10μM
|
|
Z80024 |
Z80024
|
A9 (Fibroblast Cells) |
13.8 |
0.38 |
Functional ≤ 10μM
|
|
Z80025 |
Z80025
|
ACHN (Renal Adenocarcinoma Cells) |
39.8 |
0.36 |
Functional ≤ 10μM
|
|
Z80035 |
Z80035
|
B16 (Melanoma Cells) |
31 |
0.36 |
Functional ≤ 10μM
|
|
Z101682 |
Z101682
|
BK Polyomavirus |
22 |
0.37 |
Functional ≤ 10μM
|
|
Z80720 |
Z80720
|
Burkitts Lymphoma Cells |
50 |
0.35 |
Functional ≤ 10μM
|
|
Z80874 |
Z80874
|
CEM (T-cell Leukemia) |
17.2 |
0.37 |
Functional ≤ 10μM
|
|
Z80088 |
Z80088
|
CHO (Ovarian Cells) |
220 |
0.32 |
Functional ≤ 10μM |
|
Z80096 |
Z80096
|
CHO-TAX 5-6 |
140 |
0.33 |
Functional ≤ 10μM |
|
Z80097 |
Z80097
|
CHO-VV 3-2 |
620 |
0.30 |
Functional ≤ 10μM |
|
Z80120 |
Z80120
|
DLD-1 (Colon Adenocarcinoma Cells) |
190 |
0.32 |
Functional ≤ 10μM
|
|
Z80125 |
Z80125
|
DU-145 (Prostate Carcinoma) |
10 |
0.39 |
Functional ≤ 10μM
|
|
Z80928 |
Z80928
|
HCT-116 (Colon Carcinoma Cells) |
15 |
0.38 |
Functional ≤ 10μM
|
|
Z81335 |
Z81335
|
HCT-15 (Colon Adenocarcinoma Cells) |
100 |
0.34 |
Functional ≤ 10μM
|
|
Z81247 |
Z81247
|
HeLa (Cervical Adenocarcinoma Cells) |
1000 |
0.29 |
Functional ≤ 10μM
|
|
Z81020 |
Z81020
|
HepG2 (Hepatoblastoma Cells) |
1900 |
0.28 |
Functional ≤ 10μM |
|
Z80156 |
Z80156
|
HL-60 (Promyeloblast Leukemia Cells) |
53 |
0.35 |
Functional ≤ 10μM
|
|
Z80164 |
Z80164
|
HT-1080 (Fibrosarcoma Cells) |
1.1 |
0.43 |
Functional ≤ 10μM |
|
Z80166 |
Z80166
|
HT-29 (Colon Adenocarcinoma Cells) |
10 |
0.39 |
Functional ≤ 10μM
|
|
Z50607 |
Z50607
|
Human Immunodeficiency Virus 1 |
18 |
0.37 |
Functional ≤ 10μM
|
|
Z81244 |
Z81244
|
J774 (Macrophage Cells) |
93.1 |
0.34 |
Functional ≤ 10μM
|
|
Z80819 |
Z80819
|
J774.2 |
228.3 |
0.32 |
Functional ≤ 10μM
|
|
Z81072 |
Z81072
|
Jurkat (Acute Leukemic T-cells) |
17 |
0.38 |
Functional ≤ 10μM
|
|
Z80186 |
Z80186
|
K562 (Erythroleukemia Cells) |
14.1 |
0.38 |
Functional ≤ 10μM
|
|
Z81115 |
Z81115
|
KB (Squamous Cell Carcinoma) |
10 |
0.39 |
Functional ≤ 10μM
|
|
Z80193 |
Z80193
|
L1210 (Lymphocytic Leukemia Cells) |
14.7 |
0.38 |
Functional ≤ 10μM
|
|
Z81170 |
Z81170
|
LNCaP (Prostate Carcinoma) |
16 |
0.38 |
Functional ≤ 10μM
|
|
Z80211 |
Z80211
|
LoVo (Colon Adenocarcinoma Cells) |
101 |
0.34 |
Functional ≤ 10μM
|
|
Z80224 |
Z80224
|
MCF7 (Breast Carcinoma Cells) |
12 |
0.38 |
Functional ≤ 10μM
|
|
Z81252 |
Z81252
|
MDA-MB-231 (Breast Adenocarcinoma Cells) |
1.8 |
0.42 |
Functional ≤ 10μM
|
|
Z81245 |
Z81245
|
MDA-MB-435 (Breast Carcinoma Cells) |
2000 |
0.28 |
Functional ≤ 10μM
|
|
Z80244 |
Z80244
|
MDA-MB-468 (Breast Adenocarcinoma) |
6.9 |
0.39 |
Functional ≤ 10μM
|
|
Z80269 |
Z80269
|
MKN-45 (Gastric Adenocarcinoma Cells) |
15 |
0.38 |
Functional ≤ 10μM
|
|
Z81281 |
Z81281
|
NCI-H23 (Non-small Cell Lung Carcinoma Cells) |
13 |
0.38 |
Functional ≤ 10μM
|
|
Z81024 |
Z81024
|
NCI-H460 (Non-small Cell Lung Carcinoma) |
10 |
0.39 |
Functional ≤ 10μM
|
|
Z81283 |
Z81283
|
NCI-H522 (Non-small Cell Lung Carcinoma Cells) |
14 |
0.38 |
Functional ≤ 10μM
|
|
Z80711 |
Z80711
|
NCI/ADR-RES (Breast Carcinoma Cells) |
1113 |
0.29 |
Functional ≤ 10μM |
|
Z80354 |
Z80354
|
OVCAR-3 (Ovarian Adenocarcinoma Cells) |
800 |
0.29 |
Functional ≤ 10μM
|
|
Z80362 |
Z80362
|
P388 (Lymphoma Cells) |
0.62 |
0.44 |
Functional ≤ 10μM
|
|
Z80390 |
Z80390
|
PC-3 (Prostate Carcinoma Cells) |
10 |
0.39 |
Functional ≤ 10μM |
|
Z50425 |
Z50425
|
Plasmodium Falciparum |
10000 |
0.24 |
Functional ≤ 10μM
|
|
Z80414 |
Z80414
|
Raji (B-lymphoblastic Cells) |
14 |
0.38 |
Functional ≤ 10μM
|
|
Z80427 |
Z80427
|
RKO (Colon Carcinoma) |
10 |
0.39 |
Functional ≤ 10μM
|
|
Z81054 |
Z81054
|
SF-268 (Glioblastoma Cells) |
25 |
0.37 |
Functional ≤ 10μM
|
|
Z80466 |
Z80466
|
SF268 |
10 |
0.39 |
Functional ≤ 10μM
|
|
Z80475 |
Z80475
|
SK-BR-3 (Breast Adenocarcinoma) |
5 |
0.40 |
Functional ≤ 10μM
|
|
Z80493 |
Z80493
|
SK-OV-3 (Ovarian Carcinoma Cells) |
10 |
0.39 |
Functional ≤ 10μM
|
|
Z50590 |
Z50590
|
Sus Scrofa |
1400 |
0.28 |
Functional ≤ 10μM
|
|
Z81331 |
Z81331
|
SW-620 (Colon Adenocarcinoma Cells) |
14 |
0.38 |
Functional ≤ 10μM
|
|
Z80526 |
Z80526
|
SW480 (Colon Adenocarcinoma Cells) |
30 |
0.36 |
Functional ≤ 10μM |
|
Z80712 |
Z80712
|
T47D (Breast Carcinoma Cells) |
14 |
0.38 |
Functional ≤ 10μM
|
|
TBA1A_PIG |
P02550
|
Tubulin Alpha Chain, Pig |
1500 |
0.28 |
Functional ≤ 10μM
|
|
Q862F3_BOVIN |
Q862F3
|
Tubulin Alpha Chain, Bovin |
1700 |
0.28 |
Functional ≤ 10μM
|
|
Q862L2_BOVIN |
Q862L2
|
Tubulin Alpha-1 Chain, Bovin |
1700 |
0.28 |
Functional ≤ 10μM
|
|
TBA1A_RAT |
P68370
|
Tubulin Alpha-1 Chain, Rat |
1400 |
0.28 |
Functional ≤ 10μM
|
|
TBA4A_HUMAN |
P68366
|
Tubulin Alpha-1 Chain, Human |
1700 |
0.28 |
Functional ≤ 10μM
|
|
TBB2B_BOVIN |
Q6B856
|
Tubulin Beta Chain, Bovin |
1700 |
0.28 |
Functional ≤ 10μM
|
|
TBB1_HUMAN |
Q9H4B7
|
Tubulin Beta-1 Chain, Human |
1400 |
0.28 |
Functional ≤ 10μM
|
|
TBB4B_HUMAN |
P68371
|
Tubulin Beta-2 Chain, Human |
1500 |
0.28 |
Functional ≤ 10μM
|
|
TBB3_HUMAN |
Q13509
|
Tubulin Beta-3 Chain, Human |
1500 |
0.28 |
Functional ≤ 10μM
|
|
TBB4A_HUMAN |
P04350
|
Tubulin Beta-4 Chain, Human |
1500 |
0.28 |
Functional ≤ 10μM
|
|
TBB5_HUMAN |
P07437
|
Tubulin Beta-5 Chain, Human |
3200 |
0.27 |
Functional ≤ 10μM
|
|
TBB8_HUMAN |
Q3ZCM7
|
Tubulin Beta-8 Chain, Human |
1500 |
0.28 |
Functional ≤ 10μM
|
|
Z80566 |
Z80566
|
U-937 (Histiocytic Lymphoma Cells) |
5.2 |
0.40 |
Functional ≤ 10μM
|
|
Z80583 |
Z80583
|
Vero (Kidney Cells) |
270 |
0.32 |
Functional ≤ 10μM
|
|
Z80608 |
Z80608
|
ZR-75-1 (Breast Carcinoma Cells) |
6 |
0.40 |
Functional ≤ 10μM
|
|
Z80897 |
Z80897
|
H9 (T-lymphoid Cells) |
10 |
0.39 |
ADME/T ≤ 10μM
|
|
Z80928 |
Z80928
|
HCT-116 (Colon Carcinoma Cells) |
2.75 |
0.41 |
ADME/T ≤ 10μM
|
|
Z81247 |
Z81247
|
HeLa (Cervical Adenocarcinoma Cells) |
1.84 |
0.42 |
ADME/T ≤ 10μM
|
|
Z81244 |
Z81244
|
J774 (Macrophage Cells) |
210 |
0.32 |
ADME/T ≤ 10μM
|
|
Z80583 |
Z80583
|
Vero (Kidney Cells) |
530 |
0.30 |
ADME/T ≤ 10μM
|
|
Z80608 |
Z80608
|
ZR-75-1 (Breast Carcinoma Cells) |
522 |
0.30 |
ADME/T ≤ 10μM
|
Physical Representations
|
Type
pH range
|
xlogP
|
Des A‑Pol
Apolar desolvation
(kcal/mol)
|
Des Pol
Polar desolvation
(kcal/mol)
|
H Don
H-bond donors
|
H Acc
H-bond acceptors
|
Chg
Net charge
|
tPSA
(Ų)
|
MWT
Molecular weight
(g/mol)
|
RB
Rotatable bonds
|
DL |
|
Ref
Reference (pH 7)
|
1.10 |
7.99 |
-20.74 |
1 |
7 |
0 |
83 |
399.443 |
5 |
↓
|
|
|
|
Analogs
-
22056030
-
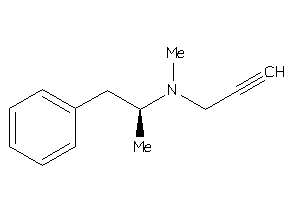
Draw
Identity
99%
90%
80%
70%
Clustered Target Annotations
| Code |
Organism Class |
Affinity (nM) |
LE (kcal/mol/atom) |
Type |
|
AOFA-1-E |
Monoamine Oxidase A (cluster #1 Of 8), Eukaryotic |
Eukaryotes |
3800 |
0.54 |
Binding ≤ 10μM
|
|
AOFB-1-E |
Monoamine Oxidase B (cluster #1 Of 8), Eukaryotic |
Eukaryotes |
970 |
0.60 |
Binding ≤ 10μM
|
ChEMBL Target Annotations
| Uniprot |
Swissprot |
Affinity (nM) |
LE (kcal/mol/atom) |
Type |
|
AOFA_HUMAN |
P21397
|
Monoamine Oxidase A, Human |
67.25 |
0.72 |
Binding ≤ 1μM |
|
AOFA_RAT |
P21396
|
Monoamine Oxidase A, Rat |
13 |
0.79 |
Binding ≤ 1μM
|
|
AOFB_BOVIN |
P56560
|
Monoamine Oxidase B, Bovin |
1000 |
0.60 |
Binding ≤ 1μM
|
|
AOFB_HUMAN |
P27338
|
Monoamine Oxidase B, Human |
0.1 |
1.00 |
Binding ≤ 1μM
|
|
AOFB_RAT |
P19643
|
Monoamine Oxidase B, Rat |
13 |
0.79 |
Binding ≤ 1μM
|
|
AOFA_BOVIN |
P21398
|
Monoamine Oxidase A, Bovin |
3800 |
0.54 |
Binding ≤ 10μM
|
|
AOFA_HUMAN |
P21397
|
Monoamine Oxidase A, Human |
1200 |
0.59 |
Binding ≤ 10μM
|
|
AOFA_RAT |
P21396
|
Monoamine Oxidase A, Rat |
1200 |
0.59 |
Binding ≤ 10μM
|
|
AOFB_HUMAN |
P27338
|
Monoamine Oxidase B, Human |
0.1 |
1.00 |
Binding ≤ 10μM
|
|
AOFB_RAT |
P19643
|
Monoamine Oxidase B, Rat |
13 |
0.79 |
Binding ≤ 10μM
|
|
AOFB_BOVIN |
P56560
|
Monoamine Oxidase B, Bovin |
1000 |
0.60 |
Binding ≤ 10μM
|
Physical Representations
|
Type
pH range
|
xlogP
|
Des A‑Pol
Apolar desolvation
(kcal/mol)
|
Des Pol
Polar desolvation
(kcal/mol)
|
H Don
H-bond donors
|
H Acc
H-bond acceptors
|
Chg
Net charge
|
tPSA
(Ų)
|
MWT
Molecular weight
(g/mol)
|
RB
Rotatable bonds
|
DL |
|
Ref
Reference (pH 7)
|
2.64 |
6.48 |
-3.01 |
0 |
1 |
0 |
3 |
187.286 |
4 |
↓
|
|
|
|
Analogs
Draw
Identity
99%
90%
80%
70%
Physical Representations
|
Type
pH range
|
xlogP
|
Des A‑Pol
Apolar desolvation
(kcal/mol)
|
Des Pol
Polar desolvation
(kcal/mol)
|
H Don
H-bond donors
|
H Acc
H-bond acceptors
|
Chg
Net charge
|
tPSA
(Ų)
|
MWT
Molecular weight
(g/mol)
|
RB
Rotatable bonds
|
DL |
|
Ref
Reference (pH 7)
|
2.74 |
4.71 |
-3.89 |
1 |
5 |
0 |
62 |
247.726 |
4 |
↓
|
|
|
|
Analogs
-
896755
-
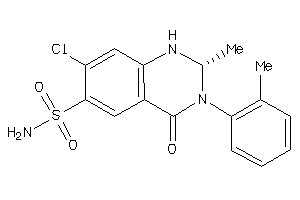
Draw
Identity
99%
90%
80%
70%
Physical Representations
|
Type
pH range
|
xlogP
|
Des A‑Pol
Apolar desolvation
(kcal/mol)
|
Des Pol
Polar desolvation
(kcal/mol)
|
H Don
H-bond donors
|
H Acc
H-bond acceptors
|
Chg
Net charge
|
tPSA
(Ų)
|
MWT
Molecular weight
(g/mol)
|
RB
Rotatable bonds
|
DL |
|
Ref
Reference (pH 7)
|
2.77 |
3.79 |
-17.4 |
3 |
6 |
0 |
93 |
365.842 |
2 |
↓
|
|
|
|
Analogs
-
601254
-
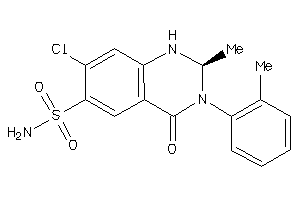
Draw
Identity
99%
90%
80%
70%
Physical Representations
|
Type
pH range
|
xlogP
|
Des A‑Pol
Apolar desolvation
(kcal/mol)
|
Des Pol
Polar desolvation
(kcal/mol)
|
H Don
H-bond donors
|
H Acc
H-bond acceptors
|
Chg
Net charge
|
tPSA
(Ų)
|
MWT
Molecular weight
(g/mol)
|
RB
Rotatable bonds
|
DL |
|
Ref
Reference (pH 7)
|
2.77 |
3.71 |
-17.08 |
3 |
6 |
0 |
93 |
365.842 |
2 |
↓
|
|
|
|
Analogs
-
3630765
-
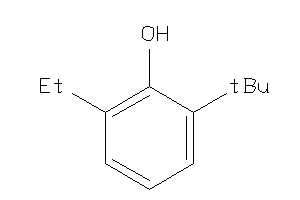
-
5761672
-
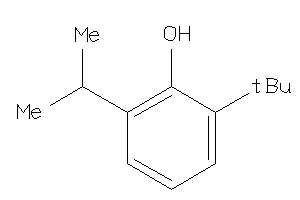
Draw
Identity
99%
90%
80%
70%
Physical Representations
|
Type
pH range
|
xlogP
|
Des A‑Pol
Apolar desolvation
(kcal/mol)
|
Des Pol
Polar desolvation
(kcal/mol)
|
H Don
H-bond donors
|
H Acc
H-bond acceptors
|
Chg
Net charge
|
tPSA
(Ų)
|
MWT
Molecular weight
(g/mol)
|
RB
Rotatable bonds
|
DL |
|
Ref
Reference (pH 7)
|
3.70 |
5.68 |
-3.07 |
1 |
1 |
0 |
20 |
178.275 |
2 |
↓
|
|
|
|
Analogs
-
34604201
-
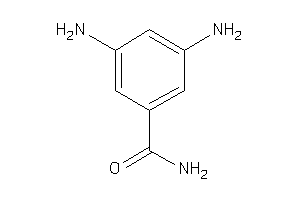
Draw
Identity
99%
90%
80%
70%
Clustered Target Annotations
| Code |
Organism Class |
Affinity (nM) |
LE (kcal/mol/atom) |
Type |
|
PARP1-3-E |
Poly [ADP-ribose] Polymerase 1 (cluster #3 Of 3), Eukaryotic |
Eukaryotes |
9005 |
0.71 |
Binding ≤ 10μM
|
ChEMBL Target Annotations
| Uniprot |
Swissprot |
Affinity (nM) |
LE (kcal/mol/atom) |
Type |
|
PARP1_HUMAN |
P09874
|
Poly [ADP-ribose] Polymerase-1, Human |
3100 |
0.77 |
Binding ≤ 10μM
|
Physical Representations
|
Type
pH range
|
xlogP
|
Des A‑Pol
Apolar desolvation
(kcal/mol)
|
Des Pol
Polar desolvation
(kcal/mol)
|
H Don
H-bond donors
|
H Acc
H-bond acceptors
|
Chg
Net charge
|
tPSA
(Ų)
|
MWT
Molecular weight
(g/mol)
|
RB
Rotatable bonds
|
DL |
|
Ref
Reference (pH 7)
|
-0.19 |
-0.85 |
-9.27 |
4 |
3 |
0 |
69 |
136.154 |
1 |
↓
|
|
|
|
Analogs
-
17027441
-
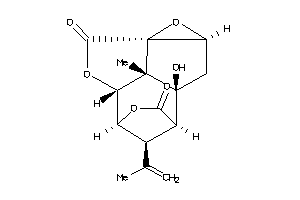
Draw
Identity
99%
90%
80%
70%
Physical Representations
|
Type
pH range
|
xlogP
|
Des A‑Pol
Apolar desolvation
(kcal/mol)
|
Des Pol
Polar desolvation
(kcal/mol)
|
H Don
H-bond donors
|
H Acc
H-bond acceptors
|
Chg
Net charge
|
tPSA
(Ų)
|
MWT
Molecular weight
(g/mol)
|
RB
Rotatable bonds
|
DL |
|
Ref
Reference (pH 7)
|
-1.21 |
-1.22 |
-15.29 |
1 |
6 |
0 |
85 |
292.287 |
1 |
↓
|
|
|
|
Analogs
-
7996793
-
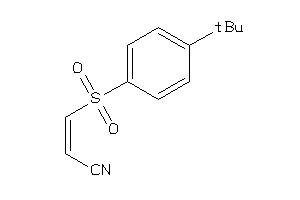
Draw
Identity
99%
90%
80%
70%
Clustered Target Annotations
| Code |
Organism Class |
Affinity (nM) |
LE (kcal/mol/atom) |
Type |
|
Z50380-1-O |
Mycobacterium Smegmatis (cluster #1 Of 4), Other |
Other |
6220 |
0.43 |
Functional ≤ 10μM
|
|
Z50425-2-O |
Plasmodium Falciparum (cluster #2 Of 22), Other |
Other |
6310 |
0.43 |
Functional ≤ 10μM
|
Physical Representations
|
Type
pH range
|
xlogP
|
Des A‑Pol
Apolar desolvation
(kcal/mol)
|
Des Pol
Polar desolvation
(kcal/mol)
|
H Don
H-bond donors
|
H Acc
H-bond acceptors
|
Chg
Net charge
|
tPSA
(Ų)
|
MWT
Molecular weight
(g/mol)
|
RB
Rotatable bonds
|
DL |
|
Ref
Reference (pH 7)
|
2.48 |
5.59 |
-9.72 |
0 |
3 |
0 |
58 |
249.335 |
3 |
↓
|
|
|
|
Analogs
-
11616249
-
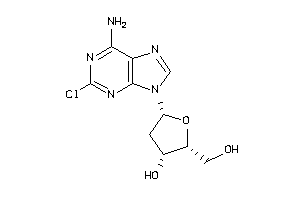
-
1545060
-
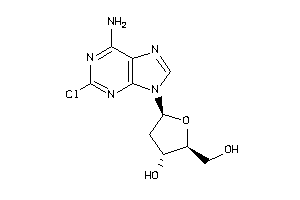
Draw
Identity
99%
90%
80%
70%
Clustered Target Annotations
| Code |
Organism Class |
Affinity (nM) |
LE (kcal/mol/atom) |
Type |
|
Z100515-1-O |
HPAC (Pancreatic Adenocarcinoma) (cluster #1 Of 2), Other |
Other |
9320 |
0.37 |
Functional ≤ 10μM |
|
Z100733-1-O |
CT26 (Colon Carcinoma Cells) (cluster #1 Of 1), Other |
Other |
131 |
0.51 |
Functional ≤ 10μM |
|
Z80064-1-O |
CCRF-CEM (T-cell Leukemia) (cluster #1 Of 9), Other |
Other |
1 |
0.66 |
Functional ≤ 10μM |
|
Z80132-1-O |
EL4 (Thymoma Cells) (cluster #1 Of 2), Other |
Other |
848 |
0.45 |
Functional ≤ 10μM |
|
Z80166-12-O |
HT-29 (Colon Adenocarcinoma Cells) (cluster #12 Of 12), Other |
Other |
9440 |
0.37 |
Functional ≤ 10μM |
|
Z80186-1-O |
K562 (Erythroleukemia Cells) (cluster #1 Of 11), Other |
Other |
7690 |
0.38 |
Functional ≤ 10μM |
|
Z80193-2-O |
L1210 (Lymphocytic Leukemia Cells) (cluster #2 Of 12), Other |
Other |
393 |
0.47 |
Functional ≤ 10μM |
|
Z80224-1-O |
MCF7 (Breast Carcinoma Cells) (cluster #1 Of 14), Other |
Other |
2350 |
0.41 |
Functional ≤ 10μM |
|
Z80390-1-O |
PC-3 (Prostate Carcinoma Cells) (cluster #1 Of 10), Other |
Other |
8280 |
0.37 |
Functional ≤ 10μM |
|
Z80414-1-O |
Raji (B-lymphoblastic Cells) (cluster #1 Of 3), Other |
Other |
9 |
0.59 |
Functional ≤ 10μM |
|
Z80742-1-O |
C6 (Glioma Cells) (cluster #1 Of 3), Other |
Other |
9070 |
0.37 |
Functional ≤ 10μM |
|
Z80928-2-O |
HCT-116 (Colon Carcinoma Cells) (cluster #2 Of 9), Other |
Other |
9430 |
0.37 |
Functional ≤ 10μM |
ChEMBL Target Annotations
| Uniprot |
Swissprot |
Affinity (nM) |
LE (kcal/mol/atom) |
Type |
|
Z80742 |
Z80742
|
C6 (Glioma Cells) |
9070 |
0.37 |
Functional ≤ 10μM |
|
Z80064 |
Z80064
|
CCRF-CEM (T-cell Leukemia) |
0.5 |
0.69 |
Functional ≤ 10μM |
|
Z100733 |
Z100733
|
CT26 (Colon Carcinoma Cells) |
131 |
0.51 |
Functional ≤ 10μM |
|
Z80132 |
Z80132
|
EL4 (Thymoma Cells) |
848 |
0.45 |
Functional ≤ 10μM |
|
Z80928 |
Z80928
|
HCT-116 (Colon Carcinoma Cells) |
9430 |
0.37 |
Functional ≤ 10μM |
|
Z100515 |
Z100515
|
HPAC (Pancreatic Adenocarcinoma) |
9320 |
0.37 |
Functional ≤ 10μM |
|
Z80166 |
Z80166
|
HT-29 (Colon Adenocarcinoma Cells) |
9440 |
0.37 |
Functional ≤ 10μM |
|
Z80186 |
Z80186
|
K562 (Erythroleukemia Cells) |
170 |
0.50 |
Functional ≤ 10μM |
|
Z80193 |
Z80193
|
L1210 (Lymphocytic Leukemia Cells) |
393 |
0.47 |
Functional ≤ 10μM |
|
Z80224 |
Z80224
|
MCF7 (Breast Carcinoma Cells) |
2350 |
0.41 |
Functional ≤ 10μM |
|
Z80390 |
Z80390
|
PC-3 (Prostate Carcinoma Cells) |
8280 |
0.37 |
Functional ≤ 10μM |
|
Z80414 |
Z80414
|
Raji (B-lymphoblastic Cells) |
9 |
0.59 |
Functional ≤ 10μM |
Physical Representations
|
Type
pH range
|
xlogP
|
Des A‑Pol
Apolar desolvation
(kcal/mol)
|
Des Pol
Polar desolvation
(kcal/mol)
|
H Don
H-bond donors
|
H Acc
H-bond acceptors
|
Chg
Net charge
|
tPSA
(Ų)
|
MWT
Molecular weight
(g/mol)
|
RB
Rotatable bonds
|
DL |
|
Ref
Reference (pH 7)
|
0.10 |
-2.49 |
-11.31 |
4 |
8 |
0 |
119 |
285.691 |
2 |
↓
|
|
|
|
Analogs
-
4098919
-
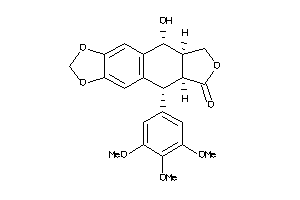
-
4098920
-
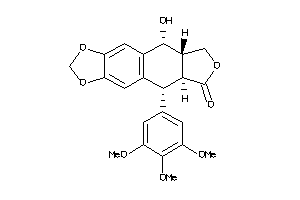
-
4475321
-
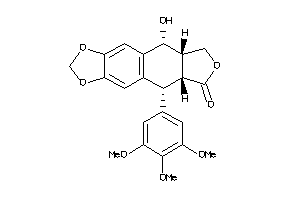
-
11682059
-
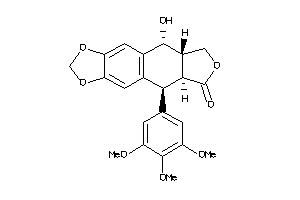
-
16969582
-
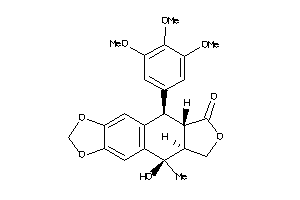
Draw
Identity
99%
90%
80%
70%
Clustered Target Annotations
| Code |
Organism Class |
Affinity (nM) |
LE (kcal/mol/atom) |
Type |
|
GCR-1-E |
Glucocorticoid Receptor (cluster #1 Of 2), Eukaryotic |
Eukaryotes |
14 |
0.37 |
Binding ≤ 10μM
|
|
O46399-1-E |
Beta Tubulin (cluster #1 Of 1), Eukaryotic |
Eukaryotes |
3000 |
0.26 |
Binding ≤ 10μM
|
|
Q862F3-2-E |
Tubulin Alpha Chain (cluster #2 Of 2), Eukaryotic |
Eukaryotes |
2500 |
0.26 |
Binding ≤ 10μM |
|
Q862L2-2-E |
Tubulin Alpha-1 Chain (cluster #2 Of 2), Eukaryotic |
Eukaryotes |
2500 |
0.26 |
Binding ≤ 10μM |
|
Q9MZB0-1-E |
Tubulin Alpha-1 Chain (cluster #1 Of 1), Eukaryotic |
Eukaryotes |
3000 |
0.26 |
Binding ≤ 10μM
|
|
TBA1A-1-E |
Tubulin Alpha-3 Chain (cluster #1 Of 3), Eukaryotic |
Eukaryotes |
2180 |
0.26 |
Binding ≤ 10μM
|
|
TBA4A-1-E |
Tubulin Alpha-1 Chain (cluster #1 Of 1), Eukaryotic |
Eukaryotes |
1700 |
0.27 |
Binding ≤ 10μM
|
|
TBB-1-E |
Tubulin Beta Chain (cluster #1 Of 1), Eukaryotic |
Eukaryotes |
1560 |
0.27 |
Binding ≤ 10μM
|
|
TBB1-1-E |
Tubulin Beta-1 Chain (cluster #1 Of 2), Eukaryotic |
Eukaryotes |
460 |
0.30 |
Binding ≤ 10μM
|
|
TBB2B-1-E |
Tubulin Beta Chain (cluster #1 Of 1), Eukaryotic |
Eukaryotes |
2500 |
0.26 |
Binding ≤ 10μM |
|
TBB3-1-E |
Tubulin Beta-3 Chain (cluster #1 Of 1), Eukaryotic |
Eukaryotes |
2180 |
0.26 |
Binding ≤ 10μM
|
|
TBB4A-1-E |
Tubulin Beta-4 Chain (cluster #1 Of 1), Eukaryotic |
Eukaryotes |
4000 |
0.25 |
Binding ≤ 10μM
|
|
TBB4B-1-E |
Tubulin Beta-2 Chain (cluster #1 Of 1), Eukaryotic |
Eukaryotes |
4000 |
0.25 |
Binding ≤ 10μM
|
|
TBB5-1-E |
Tubulin Beta-5 Chain (cluster #1 Of 1), Eukaryotic |
Eukaryotes |
4000 |
0.25 |
Binding ≤ 10μM
|
|
TBB8-1-E |
Tubulin Beta-8 Chain (cluster #1 Of 1), Eukaryotic |
Eukaryotes |
4000 |
0.25 |
Binding ≤ 10μM
|
|
TBG1-1-E |
Tubulin Gamma-1 Chain (cluster #1 Of 1), Eukaryotic |
Eukaryotes |
2180 |
0.26 |
Binding ≤ 10μM
|
|
Q862F3-1-E |
Tubulin Alpha Chain (cluster #1 Of 2), Eukaryotic |
Eukaryotes |
590 |
0.29 |
Functional ≤ 10μM
|
|
Q862L2-1-E |
Tubulin Alpha-1 Chain (cluster #1 Of 2), Eukaryotic |
Eukaryotes |
590 |
0.29 |
Functional ≤ 10μM
|
|
TBA1A-1-E |
Tubulin Alpha-1 Chain (cluster #1 Of 2), Eukaryotic |
Eukaryotes |
460 |
0.30 |
Functional ≤ 10μM
|
|
TBB1-1-E |
Tubulin Beta-1 Chain (cluster #1 Of 2), Eukaryotic |
Eukaryotes |
460 |
0.30 |
Functional ≤ 10μM
|
|
TBB2B-1-E |
Tubulin Beta Chain (cluster #1 Of 2), Eukaryotic |
Eukaryotes |
590 |
0.29 |
Functional ≤ 10μM
|
|
Z100695-1-O |
WRL68 (Embryonic Hepatoma Cells) (cluster #1 Of 1), Other |
Other |
4800 |
0.25 |
Functional ≤ 10μM
|
|
Z101973-1-O |
Paracentrotus Lividus (cluster #1 Of 1), Other |
Other |
500 |
0.29 |
Functional ≤ 10μM
|
|
Z50425-1-O |
Plasmodium Falciparum (cluster #1 Of 22), Other |
Other |
10000 |
0.23 |
Functional ≤ 10μM
|
|
Z50426-3-O |
Plasmodium Falciparum (isolate K1 / Thailand) (cluster #3 Of 9), Other |
Other |
12 |
0.37 |
Functional ≤ 10μM
|
|
Z50602-2-O |
Human Herpesvirus 1 (cluster #2 Of 5), Other |
Other |
50 |
0.34 |
Functional ≤ 10μM
|
|
Z50607-1-O |
Human Immunodeficiency Virus 1 (cluster #1 Of 10), Other |
Other |
3 |
0.40 |
Functional ≤ 10μM
|
|
Z50651-2-O |
Vesicular Stomatitis Virus (cluster #2 Of 2), Other |
Other |
100 |
0.33 |
Functional ≤ 10μM
|
|
Z80002-1-O |
1A9 (Ovarian Adenocarcinoma Cells) (cluster #1 Of 2), Other |
Other |
3 |
0.40 |
Functional ≤ 10μM
|
|
Z80054-1-O |
Caco-2 (Colon Adenocarcinoma Cells) (cluster #1 Of 4), Other |
Other |
500 |
0.29 |
Functional ≤ 10μM
|
|
Z80110-1-O |
CV-1 (Kidney Cells) (cluster #1 Of 2), Other |
Other |
29 |
0.35 |
Functional ≤ 10μM |
|
Z80121-1-O |
DMS-79 (Small Cell Lung Carcinoma Cells) (cluster #1 Of 1), Other |
Other |
23 |
0.36 |
Functional ≤ 10μM
|
|
Z80125-1-O |
DU-145 (Prostate Carcinoma) (cluster #1 Of 9), Other |
Other |
52 |
0.34 |
Functional ≤ 10μM
|
|
Z80156-1-O |
HL-60 (Promyeloblast Leukemia Cells) (cluster #1 Of 12), Other |
Other |
2750 |
0.26 |
Functional ≤ 10μM
|
|
Z80164-1-O |
HT-1080 (Fibrosarcoma Cells) (cluster #1 Of 6), Other |
Other |
8100 |
0.24 |
Functional ≤ 10μM
|
|
Z80166-1-O |
HT-29 (Colon Adenocarcinoma Cells) (cluster #1 Of 12), Other |
Other |
50 |
0.34 |
Functional ≤ 10μM |
|
Z80186-6-O |
K562 (Erythroleukemia Cells) (cluster #6 Of 11), Other |
Other |
30 |
0.35 |
Functional ≤ 10μM |
|
Z80224-1-O |
MCF7 (Breast Carcinoma Cells) (cluster #1 Of 14), Other |
Other |
8500 |
0.24 |
Functional ≤ 10μM
|
|
Z80284-3-O |
MOLT-3 (T-lymphoblastic Leukemia Cells) (cluster #3 Of 3), Other |
Other |
14 |
0.37 |
Functional ≤ 10μM
|
|
Z80354-4-O |
OVCAR-3 (Ovarian Adenocarcinoma Cells) (cluster #4 Of 4), Other |
Other |
460 |
0.30 |
Functional ≤ 10μM
|
|
Z80362-1-O |
P388 (Lymphoma Cells) (cluster #1 Of 8), Other |
Other |
50 |
0.34 |
Functional ≤ 10μM |
|
Z80390-1-O |
PC-3 (Prostate Carcinoma Cells) (cluster #1 Of 10), Other |
Other |
13 |
0.37 |
Functional ≤ 10μM
|
|
Z80414-1-O |
Raji (B-lymphoblastic Cells) (cluster #1 Of 3), Other |
Other |
18 |
0.36 |
Functional ≤ 10μM
|
|
Z80427-1-O |
RKO (Colon Carcinoma) (cluster #1 Of 1), Other |
Other |
29 |
0.35 |
Functional ≤ 10μM
|
|
Z80682-1-O |
A549 (Lung Carcinoma Cells) (cluster #1 Of 11), Other |
Other |
7630 |
0.24 |
Functional ≤ 10μM
|
|
Z80697-1-O |
Bel-7402 (Hepatoma Cells) (cluster #1 Of 3), Other |
Other |
9 |
0.38 |
Functional ≤ 10μM
|
|
Z80819-1-O |
J774.2 (cluster #1 Of 1), Other |
Other |
13 |
0.37 |
Functional ≤ 10μM |
|
Z80847-1-O |
FaDu (Pharyngeal Carcinoma Cells) (cluster #1 Of 3), Other |
Other |
7 |
0.38 |
Functional ≤ 10μM
|
|
Z80866-1-O |
GLC4 Cell Line (cluster #1 Of 1), Other |
Other |
60 |
0.34 |
Functional ≤ 10μM
|
|
Z80874-1-O |
CEM (T-cell Leukemia) (cluster #1 Of 7), Other |
Other |
7 |
0.38 |
Functional ≤ 10μM
|
|
Z80936-1-O |
HEK293 (Embryonic Kidney Fibroblasts) (cluster #1 Of 4), Other |
Other |
17 |
0.36 |
Functional ≤ 10μM
|
|
Z81020-3-O |
HepG2 (Hepatoblastoma Cells) (cluster #3 Of 8), Other |
Other |
500 |
0.29 |
Functional ≤ 10μM
|
|
Z81115-1-O |
KB (Squamous Cell Carcinoma) (cluster #1 Of 6), Other |
Other |
8 |
0.38 |
Functional ≤ 10μM
|
|
Z81135-1-O |
L6 (Skeletal Muscle Myoblast Cells) (cluster #1 Of 4), Other |
Other |
150 |
0.32 |
Functional ≤ 10μM
|
|
Z81244-1-O |
J774 (Macrophage Cells) (cluster #1 Of 1), Other |
Other |
16 |
0.36 |
Functional ≤ 10μM |
|
Z81247-2-O |
HeLa (Cervical Adenocarcinoma Cells) (cluster #2 Of 9), Other |
Other |
69 |
0.33 |
Functional ≤ 10μM
|
|
Z81252-3-O |
MDA-MB-231 (Breast Adenocarcinoma Cells) (cluster #3 Of 11), Other |
Other |
8 |
0.38 |
Functional ≤ 10μM
|
|
Z81335-2-O |
HCT-15 (Colon Adenocarcinoma Cells) (cluster #2 Of 5), Other |
Other |
1000 |
0.28 |
Functional ≤ 10μM
|
|
Z80052-1-O |
C8166 (Leukemic T-cells) (cluster #1 Of 1), Other |
Other |
150 |
0.32 |
ADME/T ≤ 10μM
|
|
Z80390-1-O |
PC-3 (Prostate Carcinoma Cells) (cluster #1 Of 2), Other |
Other |
34 |
0.35 |
ADME/T ≤ 10μM
|
|
Z80583-1-O |
Vero (Kidney Cells) (cluster #1 Of 3), Other |
Other |
23 |
0.36 |
ADME/T ≤ 10μM
|
|
Z81115-2-O |
KB (Squamous Cell Carcinoma) (cluster #2 Of 3), Other |
Other |
5 |
0.39 |
ADME/T ≤ 10μM
|
|
Z81135-3-O |
L6 (Skeletal Muscle Myoblast Cells) (cluster #3 Of 6), Other |
Other |
9 |
0.38 |
ADME/T ≤ 10μM |
|
Z81170-1-O |
LNCaP (Prostate Carcinoma) (cluster #1 Of 1), Other |
Other |
31 |
0.35 |
ADME/T ≤ 10μM
|
|
VE2-1-V |
Human Papillomavirus Regulatory Protein E2 (cluster #1 Of 1), Viral |
Viruses |
1050 |
0.28 |
Binding ≤ 10μM
|
ChEMBL Target Annotations
| Uniprot |
Swissprot |
Affinity (nM) |
LE (kcal/mol/atom) |
Type |
|
GCR_HUMAN |
P04150
|
Glucocorticoid Receptor, Human |
14 |
0.37 |
Binding ≤ 1μM
|
|
TBA1A_PIG |
P02550
|
Tubulin Alpha Chain, Pig |
460 |
0.30 |
Binding ≤ 1μM
|
|
TBA1A_RAT |
P68370
|
Tubulin Alpha-1 Chain, Rat |
460 |
0.30 |
Binding ≤ 1μM
|
|
TBB1_HUMAN |
Q9H4B7
|
Tubulin Beta-1 Chain, Human |
1000 |
0.28 |
Binding ≤ 1μM
|
|
TBB4B_HUMAN |
P68371
|
Tubulin Beta-2 Chain, Human |
1000 |
0.28 |
Binding ≤ 1μM
|
|
TBB3_HUMAN |
Q13509
|
Tubulin Beta-3 Chain, Human |
1000 |
0.28 |
Binding ≤ 1μM
|
|
TBB4A_HUMAN |
P04350
|
Tubulin Beta-4 Chain, Human |
1000 |
0.28 |
Binding ≤ 1μM
|
|
TBB8_HUMAN |
Q3ZCM7
|
Tubulin Beta-8 Chain, Human |
1000 |
0.28 |
Binding ≤ 1μM
|
|
O46399_SHEEP |
O46399
|
Beta Tubulin, Sheep |
3000 |
0.26 |
Binding ≤ 10μM
|
|
GCR_HUMAN |
P04150
|
Glucocorticoid Receptor, Human |
14 |
0.37 |
Binding ≤ 10μM
|
|
VE2_HPV1A |
P03118
|
Regulatory Protein E2, Hpv1a |
1050 |
0.28 |
Binding ≤ 10μM
|
|
TBA1A_PIG |
P02550
|
Tubulin Alpha Chain, Pig |
1560 |
0.27 |
Binding ≤ 10μM
|
|
Q862F3_BOVIN |
Q862F3
|
Tubulin Alpha Chain, Bovin |
1700 |
0.27 |
Binding ≤ 10μM
|
|
Q9MZB0_SHEEP |
Q9MZB0
|
Tubulin Alpha-1 Chain, Sheep |
3000 |
0.26 |
Binding ≤ 10μM
|
|
TBA1A_RAT |
P68370
|
Tubulin Alpha-1 Chain, Rat |
460 |
0.30 |
Binding ≤ 10μM
|
|
Q862L2_BOVIN |
Q862L2
|
Tubulin Alpha-1 Chain, Bovin |
1700 |
0.27 |
Binding ≤ 10μM
|
|
TBA4A_HUMAN |
P68366
|
Tubulin Alpha-1 Chain, Human |
1700 |
0.27 |
Binding ≤ 10μM
|
|
TBA1A_HUMAN |
Q71U36
|
Tubulin Alpha-3 Chain, Human |
2180 |
0.26 |
Binding ≤ 10μM
|
|
TBB2B_BOVIN |
Q6B856
|
Tubulin Beta Chain, Bovin |
1700 |
0.27 |
Binding ≤ 10μM
|
|
TBB_PIG |
P02554
|
Tubulin Beta Chain, Pig |
1560 |
0.27 |
Binding ≤ 10μM
|
|
TBB2B_RAT |
Q3KRE8
|
Tubulin Beta Chain, Rat |
2180 |
0.26 |
Binding ≤ 10μM
|
|
TBB1_HUMAN |
Q9H4B7
|
Tubulin Beta-1 Chain, Human |
1000 |
0.28 |
Binding ≤ 10μM
|
|
TBB4B_HUMAN |
P68371
|
Tubulin Beta-2 Chain, Human |
1000 |
0.28 |
Binding ≤ 10μM
|
|
TBB3_RAT |
Q4QRB4
|
Tubulin Beta-3 Chain, Rat |
2180 |
0.26 |
Binding ≤ 10μM
|
|
TBB3_HUMAN |
Q13509
|
Tubulin Beta-3 Chain, Human |
1000 |
0.28 |
Binding ≤ 10μM
|
|
TBB4A_HUMAN |
P04350
|
Tubulin Beta-4 Chain, Human |
1000 |
0.28 |
Binding ≤ 10μM
|
|
TBB5_HUMAN |
P07437
|
Tubulin Beta-5 Chain, Human |
2180 |
0.26 |
Binding ≤ 10μM
|
|
TBB8_HUMAN |
Q3ZCM7
|
Tubulin Beta-8 Chain, Human |
1000 |
0.28 |
Binding ≤ 10μM
|
|
TBG1_RAT |
P83888
|
Tubulin Gamma-1 Chain, Rat |
2180 |
0.26 |
Binding ≤ 10μM
|
|
Z80002 |
Z80002
|
1A9 (Ovarian Adenocarcinoma Cells) |
3 |
0.40 |
Functional ≤ 10μM
|
|
Z80682 |
Z80682
|
A549 (Lung Carcinoma Cells) |
12 |
0.37 |
Functional ≤ 10μM
|
|
Z80697 |
Z80697
|
Bel-7402 (Hepatoma Cells) |
9.1 |
0.38 |
Functional ≤ 10μM
|
|
Z80054 |
Z80054
|
Caco-2 (Colon Adenocarcinoma Cells) |
500 |
0.29 |
Functional ≤ 10μM
|
|
Z80874 |
Z80874
|
CEM (T-cell Leukemia) |
7.2 |
0.38 |
Functional ≤ 10μM
|
|
Z80110 |
Z80110
|
CV-1 (Kidney Cells) |
29 |
0.35 |
Functional ≤ 10μM
|
|
Z80121 |
Z80121
|
DMS-79 (Small Cell Lung Carcinoma Cells) |
23 |
0.36 |
Functional ≤ 10μM
|
|
Z80125 |
Z80125
|
DU-145 (Prostate Carcinoma) |
2970 |
0.26 |
Functional ≤ 10μM
|
|
Z80847 |
Z80847
|
FaDu (Pharyngeal Carcinoma Cells) |
7.2 |
0.38 |
Functional ≤ 10μM
|
|
Z80866 |
Z80866
|
GLC4 Cell Line |
150 |
0.32 |
Functional ≤ 10μM
|
|
Z81335 |
Z81335
|
HCT-15 (Colon Adenocarcinoma Cells) |
1000 |
0.28 |
Functional ≤ 10μM
|
|
Z80936 |
Z80936
|
HEK293 (Embryonic Kidney Fibroblasts) |
17 |
0.36 |
Functional ≤ 10μM
|
|
Z81247 |
Z81247
|
HeLa (Cervical Adenocarcinoma Cells) |
100 |
0.33 |
Functional ≤ 10μM |
|
Z81020 |
Z81020
|
HepG2 (Hepatoblastoma Cells) |
24 |
0.36 |
Functional ≤ 10μM
|
|
Z80156 |
Z80156
|
HL-60 (Promyeloblast Leukemia Cells) |
2750 |
0.26 |
Functional ≤ 10μM
|
|
Z80164 |
Z80164
|
HT-1080 (Fibrosarcoma Cells) |
8100 |
0.24 |
Functional ≤ 10μM
|
|
Z80166 |
Z80166
|
HT-29 (Colon Adenocarcinoma Cells) |
11 |
0.37 |
Functional ≤ 10μM
|
|
Z50602 |
Z50602
|
Human Herpesvirus 1 |
50 |
0.34 |
Functional ≤ 10μM
|
|
Z50607 |
Z50607
|
Human Immunodeficiency Virus 1 |
2.9 |
0.40 |
Functional ≤ 10μM
|
|
Z81244 |
Z81244
|
J774 (Macrophage Cells) |
16.4 |
0.36 |
Functional ≤ 10μM
|
|
Z80819 |
Z80819
|
J774.2 |
11.3 |
0.37 |
Functional ≤ 10μM
|
|
Z80186 |
Z80186
|
K562 (Erythroleukemia Cells) |
30 |
0.35 |
Functional ≤ 10μM |
|
Z81115 |
Z81115
|
KB (Squamous Cell Carcinoma) |
0.5 |
0.43 |
Functional ≤ 10μM |
|
Z81135 |
Z81135
|
L6 (Skeletal Muscle Myoblast Cells) |
12 |
0.37 |
Functional ≤ 10μM
|
|
Z80224 |
Z80224
|
MCF7 (Breast Carcinoma Cells) |
15 |
0.37 |
Functional ≤ 10μM
|
|
Z81252 |
Z81252
|
MDA-MB-231 (Breast Adenocarcinoma Cells) |
26 |
0.35 |
Functional ≤ 10μM
|
|
Z80284 |
Z80284
|
MOLT-3 (T-lymphoblastic Leukemia Cells) |
14 |
0.37 |
Functional ≤ 10μM
|
|
Z80354 |
Z80354
|
OVCAR-3 (Ovarian Adenocarcinoma Cells) |
460 |
0.30 |
Functional ≤ 10μM
|
|
Z80362 |
Z80362
|
P388 (Lymphoma Cells) |
12 |
0.37 |
Functional ≤ 10μM
|
|
Z101973 |
Z101973
|
Paracentrotus Lividus |
20 |
0.36 |
Functional ≤ 10μM
|
|
Z80390 |
Z80390
|
PC-3 (Prostate Carcinoma Cells) |
10 |
0.37 |
Functional ≤ 10μM
|
|
Z50425 |
Z50425
|
Plasmodium Falciparum |
10000 |
0.23 |
Functional ≤ 10μM
|
|
Z50426 |
Z50426
|
Plasmodium Falciparum (isolate K1 / Thailand) |
12 |
0.37 |
Functional ≤ 10μM
|
|
Z80414 |
Z80414
|
Raji (B-lymphoblastic Cells) |
18 |
0.36 |
Functional ≤ 10μM
|
|
Z80427 |
Z80427
|
RKO (Colon Carcinoma) |
29 |
0.35 |
Functional ≤ 10μM
|
|
Q862F3_BOVIN |
Q862F3
|
Tubulin Alpha Chain, Bovin |
1200 |
0.28 |
Functional ≤ 10μM
|
|
Q862L2_BOVIN |
Q862L2
|
Tubulin Alpha-1 Chain, Bovin |
1200 |
0.28 |
Functional ≤ 10μM
|
|
TBA1A_RAT |
P68370
|
Tubulin Alpha-1 Chain, Rat |
350 |
0.30 |
Functional ≤ 10μM
|
|
TBB2B_BOVIN |
Q6B856
|
Tubulin Beta Chain, Bovin |
1200 |
0.28 |
Functional ≤ 10μM
|
|
TBB1_HUMAN |
Q9H4B7
|
Tubulin Beta-1 Chain, Human |
350 |
0.30 |
Functional ≤ 10μM
|
|
Z50651 |
Z50651
|
Vesicular Stomatitis Virus |
100 |
0.33 |
Functional ≤ 10μM
|
|
Z100695 |
Z100695
|
WRL68 (Embryonic Hepatoma Cells) |
4800 |
0.25 |
Functional ≤ 10μM
|
|
Z80052 |
Z80052
|
C8166 (Leukemic T-cells) |
150 |
0.32 |
ADME/T ≤ 10μM
|
|
Z81115 |
Z81115
|
KB (Squamous Cell Carcinoma) |
3 |
0.40 |
ADME/T ≤ 10μM
|
|
Z81135 |
Z81135
|
L6 (Skeletal Muscle Myoblast Cells) |
10 |
0.37 |
ADME/T ≤ 10μM
|
|
Z81170 |
Z81170
|
LNCaP (Prostate Carcinoma) |
31 |
0.35 |
ADME/T ≤ 10μM
|
|
Z80390 |
Z80390
|
PC-3 (Prostate Carcinoma Cells) |
12.5 |
0.37 |
ADME/T ≤ 10μM
|
|
Z80583 |
Z80583
|
Vero (Kidney Cells) |
16 |
0.36 |
ADME/T ≤ 10μM
|
Physical Representations
|
Type
pH range
|
xlogP
|
Des A‑Pol
Apolar desolvation
(kcal/mol)
|
Des Pol
Polar desolvation
(kcal/mol)
|
H Don
H-bond donors
|
H Acc
H-bond acceptors
|
Chg
Net charge
|
tPSA
(Ų)
|
MWT
Molecular weight
(g/mol)
|
RB
Rotatable bonds
|
DL |
|
Ref
Reference (pH 7)
|
1.32 |
4.95 |
-16.81 |
1 |
8 |
0 |
93 |
414.41 |
4 |
↓
|
|
|
|
Analogs
Draw
Identity
99%
90%
80%
70%
Physical Representations
|
Type
pH range
|
xlogP
|
Des A‑Pol
Apolar desolvation
(kcal/mol)
|
Des Pol
Polar desolvation
(kcal/mol)
|
H Don
H-bond donors
|
H Acc
H-bond acceptors
|
Chg
Net charge
|
tPSA
(Ų)
|
MWT
Molecular weight
(g/mol)
|
RB
Rotatable bonds
|
DL |
|
Ref
Reference (pH 7)
|
3.64 |
5.8 |
-5.3 |
0 |
4 |
0 |
31 |
293.407 |
9 |
↓
|
|
|
|
Analogs
Draw
Identity
99%
90%
80%
70%
Clustered Target Annotations
| Code |
Organism Class |
Affinity (nM) |
LE (kcal/mol/atom) |
Type |
|
CAH1-5-E |
Carbonic Anhydrase I (cluster #5 Of 12), Eukaryotic |
Eukaryotes |
328 |
0.53 |
Binding ≤ 10μM
|
|
CAH2-6-E |
Carbonic Anhydrase II (cluster #6 Of 15), Eukaryotic |
Eukaryotes |
290 |
0.54 |
Binding ≤ 10μM
|
Physical Representations
|
Type
pH range
|
xlogP
|
Des A‑Pol
Apolar desolvation
(kcal/mol)
|
Des Pol
Polar desolvation
(kcal/mol)
|
H Don
H-bond donors
|
H Acc
H-bond acceptors
|
Chg
Net charge
|
tPSA
(Ų)
|
MWT
Molecular weight
(g/mol)
|
RB
Rotatable bonds
|
DL |
|
Ref
Reference (pH 7)
|
-0.06 |
-5.31 |
-19.65 |
4 |
7 |
0 |
118 |
297.745 |
1 |
↓
|
|
|
|
Analogs
-
39378571
-
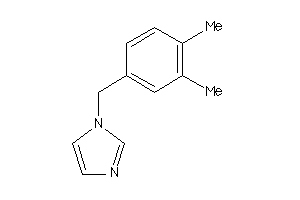
Draw
Identity
99%
90%
80%
70%
Clustered Target Annotations
| Code |
Organism Class |
Affinity (nM) |
LE (kcal/mol/atom) |
Type |
|
C11B1-2-E |
Cytochrome P450 11B1 (cluster #2 Of 2), Eukaryotic |
Eukaryotes |
709 |
0.72 |
Binding ≤ 10μM
|
|
C11B2-1-E |
Cytochrome P450 11B2 (cluster #1 Of 2), Eukaryotic |
Eukaryotes |
456 |
0.74 |
Binding ≤ 10μM |
|
CP19A-3-E |
Cytochrome P450 19A1 (cluster #3 Of 3), Eukaryotic |
Eukaryotes |
150 |
0.80 |
Binding ≤ 10μM |
Physical Representations
|
Type
pH range
|
xlogP
|
Des A‑Pol
Apolar desolvation
(kcal/mol)
|
Des Pol
Polar desolvation
(kcal/mol)
|
H Don
H-bond donors
|
H Acc
H-bond acceptors
|
Chg
Net charge
|
tPSA
(Ų)
|
MWT
Molecular weight
(g/mol)
|
RB
Rotatable bonds
|
DL |
|
Ref
Reference (pH 7)
|
1.59 |
7.76 |
-7.27 |
0 |
2 |
0 |
18 |
158.204 |
2 |
↓
|
|
Mid
Mid (pH 6-8)
|
1.59 |
8.27 |
-32.69 |
1 |
2 |
1 |
19 |
159.212 |
2 |
↓
|
|
|
|
Analogs
Draw
Identity
99%
90%
80%
70%
Clustered Target Annotations
| Code |
Organism Class |
Affinity (nM) |
LE (kcal/mol/atom) |
Type |
|
C11B1-2-E |
Cytochrome P450 11B1 (cluster #2 Of 2), Eukaryotic |
Eukaryotes |
15 |
0.64 |
Binding ≤ 10μM |
|
C11B2-1-E |
Cytochrome P450 11B2 (cluster #1 Of 2), Eukaryotic |
Eukaryotes |
72 |
0.59 |
Binding ≤ 10μM |
|
C11B1-1-E |
Cytochrome P450 11B1 (cluster #1 Of 1), Eukaryotic |
Eukaryotes |
7830 |
0.42 |
Functional ≤ 10μM
|
|
CP3A4-2-E |
Cytochrome P450 3A4 (cluster #2 Of 4), Eukaryotic |
Eukaryotes |
4932 |
0.44 |
ADME/T ≤ 10μM
|
Physical Representations
|
Type
pH range
|
xlogP
|
Des A‑Pol
Apolar desolvation
(kcal/mol)
|
Des Pol
Polar desolvation
(kcal/mol)
|
H Don
H-bond donors
|
H Acc
H-bond acceptors
|
Chg
Net charge
|
tPSA
(Ų)
|
MWT
Molecular weight
(g/mol)
|
RB
Rotatable bonds
|
DL |
|
Ref
Reference (pH 7)
|
1.76 |
5.36 |
-9.29 |
0 |
3 |
0 |
43 |
226.279 |
3 |
↓
|
|
Lo
Low (pH 4.5-6)
|
1.76 |
5.83 |
-40.25 |
1 |
3 |
1 |
44 |
227.287 |
3 |
↓
|
|
|
|
Analogs
-
4216909
-
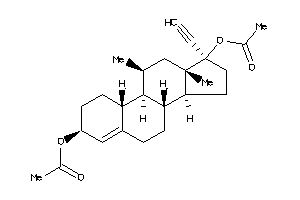
Draw
Identity
99%
90%
80%
70%
Physical Representations
|
Type
pH range
|
xlogP
|
Des A‑Pol
Apolar desolvation
(kcal/mol)
|
Des Pol
Polar desolvation
(kcal/mol)
|
H Don
H-bond donors
|
H Acc
H-bond acceptors
|
Chg
Net charge
|
tPSA
(Ų)
|
MWT
Molecular weight
(g/mol)
|
RB
Rotatable bonds
|
DL |
|
Ref
Reference (pH 7)
|
4.82 |
13.58 |
-12.82 |
0 |
4 |
0 |
53 |
384.516 |
4 |
↓
|
|
|
|
|
|
|
Analogs
Draw
Identity
99%
90%
80%
70%
Physical Representations
|
Type
pH range
|
xlogP
|
Des A‑Pol
Apolar desolvation
(kcal/mol)
|
Des Pol
Polar desolvation
(kcal/mol)
|
H Don
H-bond donors
|
H Acc
H-bond acceptors
|
Chg
Net charge
|
tPSA
(Ų)
|
MWT
Molecular weight
(g/mol)
|
RB
Rotatable bonds
|
DL |
|
Ref
Reference (pH 7)
|
0.92 |
1.9 |
-12.3 |
2 |
4 |
0 |
58 |
218.256 |
2 |
↓
|
|
|
|
Analogs
-
3977743
-
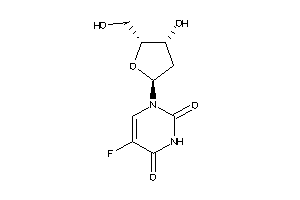
-
3977744
-
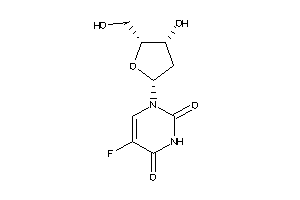
-
4045293
-
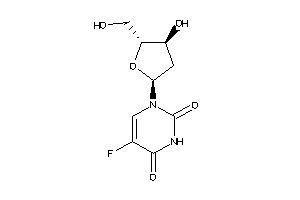
-
1457
-
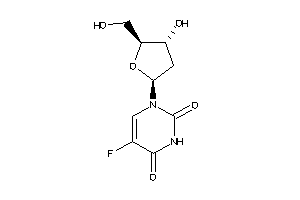
Draw
Identity
99%
90%
80%
70%
Clustered Target Annotations
| Code |
Organism Class |
Affinity (nM) |
LE (kcal/mol/atom) |
Type |
|
TYSY-1-E |
Thymidylate Synthase (cluster #1 Of 3), Eukaryotic |
Eukaryotes |
1 |
0.74 |
Binding ≤ 10μM
|
|
Z50472-2-O |
Toxoplasma Gondii (cluster #2 Of 4), Other |
Other |
960 |
0.50 |
Functional ≤ 10μM
|
|
Z80005-1-O |
3T3 (Fibroblast Cells) (cluster #1 Of 2), Other |
Other |
600 |
0.51 |
Functional ≤ 10μM
|
|
Z80064-6-O |
CCRF-CEM (T-cell Leukemia) (cluster #6 Of 9), Other |
Other |
17 |
0.64 |
Functional ≤ 10μM
|
|
Z80136-1-O |
FM3A (Breast Carcinoma Cells) (cluster #1 Of 6), Other |
Other |
9 |
0.66 |
Functional ≤ 10μM
|
|
Z80156-6-O |
HL-60 (Promyeloblast Leukemia Cells) (cluster #6 Of 12), Other |
Other |
12 |
0.65 |
Functional ≤ 10μM
|
|
Z80164-4-O |
HT-1080 (Fibrosarcoma Cells) (cluster #4 Of 6), Other |
Other |
180 |
0.56 |
Functional ≤ 10μM
|
|
Z80193-2-O |
L1210 (Lymphocytic Leukemia Cells) (cluster #2 Of 12), Other |
Other |
5 |
0.68 |
Functional ≤ 10μM
|
|
Z80208-1-O |
L5178Y (Lymphoma Cells) (cluster #1 Of 2), Other |
Other |
9 |
0.66 |
Functional ≤ 10μM
|
|
Z80682-9-O |
A549 (Lung Carcinoma Cells) (cluster #9 Of 11), Other |
Other |
9740 |
0.41 |
Functional ≤ 10μM
|
|
Z81247-7-O |
HeLa (Cervical Adenocarcinoma Cells) (cluster #7 Of 9), Other |
Other |
8500 |
0.42 |
Functional ≤ 10μM
|
|
Z81252-9-O |
MDA-MB-231 (Breast Adenocarcinoma Cells) (cluster #9 Of 11), Other |
Other |
210 |
0.55 |
Functional ≤ 10μM
|
Physical Representations
|
Type
pH range
|
xlogP
|
Des A‑Pol
Apolar desolvation
(kcal/mol)
|
Des Pol
Polar desolvation
(kcal/mol)
|
H Don
H-bond donors
|
H Acc
H-bond acceptors
|
Chg
Net charge
|
tPSA
(Ų)
|
MWT
Molecular weight
(g/mol)
|
RB
Rotatable bonds
|
DL |
|
Ref
Reference (pH 7)
|
-1.72 |
-4.38 |
-16.24 |
3 |
7 |
0 |
105 |
246.194 |
2 |
↓
|
|
Hi
High (pH 8-9.5)
|
-1.26 |
-7.12 |
-54.96 |
2 |
7 |
-1 |
108 |
245.186 |
2 |
↓
|
|
|
|
Analogs
Draw
Identity
99%
90%
80%
70%
Physical Representations
|
Type
pH range
|
xlogP
|
Des A‑Pol
Apolar desolvation
(kcal/mol)
|
Des Pol
Polar desolvation
(kcal/mol)
|
H Don
H-bond donors
|
H Acc
H-bond acceptors
|
Chg
Net charge
|
tPSA
(Ų)
|
MWT
Molecular weight
(g/mol)
|
RB
Rotatable bonds
|
DL |
|
Ref
Reference (pH 7)
|
9.46 |
15.79 |
-5.38 |
2 |
2 |
0 |
40 |
516.857 |
8 |
↓
|
|
|
|
Analogs
Draw
Identity
99%
90%
80%
70%
Physical Representations
|
Type
pH range
|
xlogP
|
Des A‑Pol
Apolar desolvation
(kcal/mol)
|
Des Pol
Polar desolvation
(kcal/mol)
|
H Don
H-bond donors
|
H Acc
H-bond acceptors
|
Chg
Net charge
|
tPSA
(Ų)
|
MWT
Molecular weight
(g/mol)
|
RB
Rotatable bonds
|
DL |
|
Ref
Reference (pH 7)
|
1.59 |
3.6 |
-9.37 |
1 |
3 |
0 |
38 |
179.219 |
3 |
↓
|
|
|
|
|
|
|
Analogs
-
3947513
-
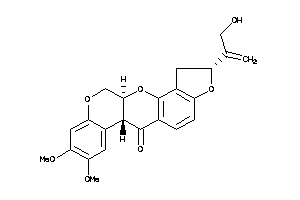
-
3947514
-
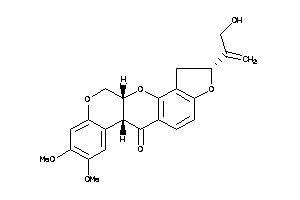
-
3947515
-
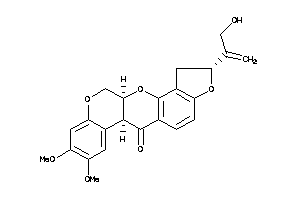
-
3947516
-
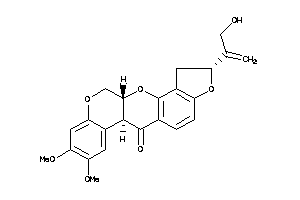
-
3978464
-
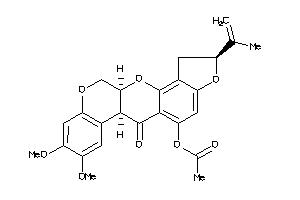
Draw
Identity
99%
90%
80%
70%
Clustered Target Annotations
| Code |
Organism Class |
Affinity (nM) |
LE (kcal/mol/atom) |
Type |
|
DUOX2-2-E |
Thyroid Oxidase 2 (cluster #2 Of 2), Eukaryotic |
Eukaryotes |
5 |
0.40 |
Binding ≤ 10μM
|
|
NDUA4-2-E |
NADH-ubiquinone Oxidoreductase MLRQ Subunit (cluster #2 Of 2), Eukaryotic |
Eukaryotes |
29 |
0.36 |
Binding ≤ 10μM
|
|
NDUA6-2-E |
NADH-ubiquinone Oxidoreductase B14 Subunit (cluster #2 Of 2), Eukaryotic |
Eukaryotes |
29 |
0.36 |
Binding ≤ 10μM
|
|
NDUA8-2-E |
NADH-ubiquinone Oxidoreductase 19 KDa Subunit (cluster #2 Of 2), Eukaryotic |
Eukaryotes |
29 |
0.36 |
Binding ≤ 10μM
|
|
NDUAA-2-E |
NADH-ubiquinone Oxidoreductase 42 KDa Subunit (cluster #2 Of 2), Eukaryotic |
Eukaryotes |
29 |
0.36 |
Binding ≤ 10μM
|
|
NDUAB-2-E |
NADH-ubiquinone Oxidoreductase Subunit B14.7 (cluster #2 Of 2), Eukaryotic |
Eukaryotes |
29 |
0.36 |
Binding ≤ 10μM
|
|
NDUB5-2-E |
NADH-ubiquinone Oxidoreductase SGDH Subunit (cluster #2 Of 2), Eukaryotic |
Eukaryotes |
29 |
0.36 |
Binding ≤ 10μM
|
|
NDUB6-2-E |
NADH-ubiquinone Oxidoreductase B17 Subunit (cluster #2 Of 2), Eukaryotic |
Eukaryotes |
29 |
0.36 |
Binding ≤ 10μM
|
|
NDUB7-2-E |
NADH-ubiquinone Oxidoreductase B18 Subunit (cluster #2 Of 2), Eukaryotic |
Eukaryotes |
29 |
0.36 |
Binding ≤ 10μM
|
|
NDUS2-2-E |
NADH-ubiquinone Oxidoreductase 49 KDa Subunit (cluster #2 Of 2), Eukaryotic |
Eukaryotes |
29 |
0.36 |
Binding ≤ 10μM
|
|
NDUS8-2-E |
NADH-ubiquinone Oxidoreductase 23 KDa Subunit, (cluster #2 Of 2), Eukaryotic |
Eukaryotes |
29 |
0.36 |
Binding ≤ 10μM
|
|
NU1M-1-E |
NADH-ubiquinone Oxidoreductase Chain 1 (cluster #1 Of 1), Eukaryotic |
Eukaryotes |
2 |
0.42 |
Binding ≤ 10μM |
|
NU2M-1-E |
NADH-ubiquinone Oxidoreductase Chain 2 (cluster #1 Of 1), Eukaryotic |
Eukaryotes |
2 |
0.42 |
Binding ≤ 10μM |
|
NU3M-1-E |
NADH-ubiquinone Oxidoreductase Chain 3 (cluster #1 Of 1), Eukaryotic |
Eukaryotes |
2 |
0.42 |
Binding ≤ 10μM |
|
NU4M-1-E |
NADH-ubiquinone Oxidoreductase Chain 4 (cluster #1 Of 1), Eukaryotic |
Eukaryotes |
4 |
0.41 |
Binding ≤ 10μM |
|
NU5M-1-E |
NADH-ubiquinone Oxidoreductase Chain 5 (cluster #1 Of 1), Eukaryotic |
Eukaryotes |
2 |
0.42 |
Binding ≤ 10μM |
|
NU6M-1-E |
NADH-ubiquinone Oxidoreductase Chain 6 (cluster #1 Of 1), Eukaryotic |
Eukaryotes |
2 |
0.42 |
Binding ≤ 10μM |
|
Z101775-1-O |
Drosophila (cluster #1 Of 1), Other |
Other |
10000 |
0.24 |
Functional ≤ 10μM
|
|
Z50425-3-O |
Plasmodium Falciparum (cluster #3 Of 22), Other |
Other |
10000 |
0.24 |
Functional ≤ 10μM
|
|
Z50531-3-O |
Caenorhabditis Elegans (cluster #3 Of 3), Other |
Other |
2000 |
0.28 |
Functional ≤ 10μM
|
|
Z50531-1-O |
Caenorhabditis Elegans (cluster #1 Of 1), Other |
Other |
2000 |
0.28 |
ADME/T ≤ 10μM
|
ChEMBL Target Annotations
| Uniprot |
Swissprot |
Affinity (nM) |
LE (kcal/mol/atom) |
Type |
|
NDUA8_HUMAN |
P51970
|
NADH-ubiquinone Oxidoreductase 19 KDa Subunit, Human |
28.8 |
0.36 |
Binding ≤ 1μM
|
|
NDUS8_HUMAN |
O00217
|
NADH-ubiquinone Oxidoreductase 23 KDa Subunit,, Human |
28.8 |
0.36 |
Binding ≤ 1μM
|
|
NDUAA_HUMAN |
O95299
|
NADH-ubiquinone Oxidoreductase 42 KDa Subunit, Human |
28.8 |
0.36 |
Binding ≤ 1μM
|
|
NDUS2_HUMAN |
O75306
|
NADH-ubiquinone Oxidoreductase 49 KDa Subunit, Human |
28.8 |
0.36 |
Binding ≤ 1μM
|
|
NDUA6_HUMAN |
P56556
|
NADH-ubiquinone Oxidoreductase B14 Subunit, Human |
28.8 |
0.36 |
Binding ≤ 1μM
|
|
NDUB6_HUMAN |
O95139
|
NADH-ubiquinone Oxidoreductase B17 Subunit, Human |
28.8 |
0.36 |
Binding ≤ 1μM
|
|
NDUB7_HUMAN |
P17568
|
NADH-ubiquinone Oxidoreductase B18 Subunit, Human |
28.8 |
0.36 |
Binding ≤ 1μM
|
|
NU1M_HUMAN |
P03886
|
NADH-ubiquinone Oxidoreductase Chain 1, Human |
1.99526231 |
0.42 |
Binding ≤ 1μM
|
|
NU2M_HUMAN |
P03891
|
NADH-ubiquinone Oxidoreductase Chain 2, Human |
1.99526231 |
0.42 |
Binding ≤ 1μM
|
|
NU3M_HUMAN |
P03897
|
NADH-ubiquinone Oxidoreductase Chain 3, Human |
1.99526231 |
0.42 |
Binding ≤ 1μM
|
|
NU4M_HUMAN |
P03905
|
NADH-ubiquinone Oxidoreductase Chain 4, Human |
1.99526231 |
0.42 |
Binding ≤ 1μM
|
|
NU5M_HUMAN |
P03915
|
NADH-ubiquinone Oxidoreductase Chain 5, Human |
1.99526231 |
0.42 |
Binding ≤ 1μM
|
|
NU6M_HUMAN |
P03923
|
NADH-ubiquinone Oxidoreductase Chain 6, Human |
1.99526231 |
0.42 |
Binding ≤ 1μM
|
|
NDUA4_HUMAN |
O00483
|
NADH-ubiquinone Oxidoreductase MLRQ Subunit, Human |
28.8 |
0.36 |
Binding ≤ 1μM
|
|
NDUB5_HUMAN |
O43674
|
NADH-ubiquinone Oxidoreductase SGDH Subunit, Human |
28.8 |
0.36 |
Binding ≤ 1μM
|
|
NDUAB_HUMAN |
Q86Y39
|
NADH-ubiquinone Oxidoreductase Subunit B14.7, Human |
28.8 |
0.36 |
Binding ≤ 1μM
|
|
DUOX2_HUMAN |
Q9NRD8
|
Thyroid Oxidase 2, Human |
5.1 |
0.40 |
Binding ≤ 1μM
|
|
NDUA8_HUMAN |
P51970
|
NADH-ubiquinone Oxidoreductase 19 KDa Subunit, Human |
28.8 |
0.36 |
Binding ≤ 10μM
|
|
NDUS8_HUMAN |
O00217
|
NADH-ubiquinone Oxidoreductase 23 KDa Subunit,, Human |
28.8 |
0.36 |
Binding ≤ 10μM
|
|
NDUAA_HUMAN |
O95299
|
NADH-ubiquinone Oxidoreductase 42 KDa Subunit, Human |
28.8 |
0.36 |
Binding ≤ 10μM
|
|
NDUS2_HUMAN |
O75306
|
NADH-ubiquinone Oxidoreductase 49 KDa Subunit, Human |
28.8 |
0.36 |
Binding ≤ 10μM
|
|
NDUA6_HUMAN |
P56556
|
NADH-ubiquinone Oxidoreductase B14 Subunit, Human |
28.8 |
0.36 |
Binding ≤ 10μM
|
|
NDUB6_HUMAN |
O95139
|
NADH-ubiquinone Oxidoreductase B17 Subunit, Human |
28.8 |
0.36 |
Binding ≤ 10μM
|
|
NDUB7_HUMAN |
P17568
|
NADH-ubiquinone Oxidoreductase B18 Subunit, Human |
28.8 |
0.36 |
Binding ≤ 10μM
|
|
NU1M_HUMAN |
P03886
|
NADH-ubiquinone Oxidoreductase Chain 1, Human |
1.99526231 |
0.42 |
Binding ≤ 10μM
|
|
NU2M_HUMAN |
P03891
|
NADH-ubiquinone Oxidoreductase Chain 2, Human |
1.99526231 |
0.42 |
Binding ≤ 10μM
|
|
NU3M_HUMAN |
P03897
|
NADH-ubiquinone Oxidoreductase Chain 3, Human |
1.99526231 |
0.42 |
Binding ≤ 10μM
|
|
NU4M_HUMAN |
P03905
|
NADH-ubiquinone Oxidoreductase Chain 4, Human |
1.99526231 |
0.42 |
Binding ≤ 10μM
|
|
NU5M_HUMAN |
P03915
|
NADH-ubiquinone Oxidoreductase Chain 5, Human |
1.99526231 |
0.42 |
Binding ≤ 10μM
|
|
NU6M_HUMAN |
P03923
|
NADH-ubiquinone Oxidoreductase Chain 6, Human |
1.99526231 |
0.42 |
Binding ≤ 10μM
|
|
NDUA4_HUMAN |
O00483
|
NADH-ubiquinone Oxidoreductase MLRQ Subunit, Human |
28.8 |
0.36 |
Binding ≤ 10μM
|
|
NDUB5_HUMAN |
O43674
|
NADH-ubiquinone Oxidoreductase SGDH Subunit, Human |
28.8 |
0.36 |
Binding ≤ 10μM
|
|
NDUAB_HUMAN |
Q86Y39
|
NADH-ubiquinone Oxidoreductase Subunit B14.7, Human |
28.8 |
0.36 |
Binding ≤ 10μM
|
|
DUOX2_HUMAN |
Q9NRD8
|
Thyroid Oxidase 2, Human |
5.1 |
0.40 |
Binding ≤ 10μM
|
|
Z50531 |
Z50531
|
Caenorhabditis Elegans |
2000 |
0.28 |
Functional ≤ 10μM
|
|
Z101775 |
Z101775
|
Drosophila |
10000 |
0.24 |
Functional ≤ 10μM
|
|
Z50425 |
Z50425
|
Plasmodium Falciparum |
10000 |
0.24 |
Functional ≤ 10μM
|
|
Z50531 |
Z50531
|
Caenorhabditis Elegans |
2000 |
0.28 |
ADME/T ≤ 10μM
|
Physical Representations
|
Type
pH range
|
xlogP
|
Des A‑Pol
Apolar desolvation
(kcal/mol)
|
Des Pol
Polar desolvation
(kcal/mol)
|
H Don
H-bond donors
|
H Acc
H-bond acceptors
|
Chg
Net charge
|
tPSA
(Ų)
|
MWT
Molecular weight
(g/mol)
|
RB
Rotatable bonds
|
DL |
|
Ref
Reference (pH 7)
|
3.59 |
8.74 |
-11.43 |
0 |
6 |
0 |
63 |
394.423 |
3 |
↓
|
|
|
|
|
|
|
Analogs
-
8660420
-
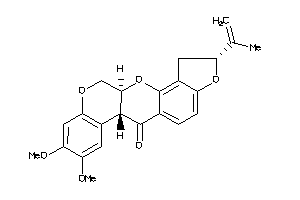
-
1705443
-
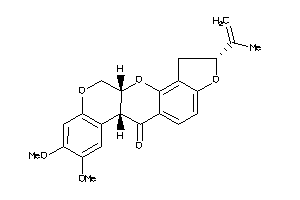
Draw
Identity
99%
90%
80%
70%
Physical Representations
|
Type
pH range
|
xlogP
|
Des A‑Pol
Apolar desolvation
(kcal/mol)
|
Des Pol
Polar desolvation
(kcal/mol)
|
H Don
H-bond donors
|
H Acc
H-bond acceptors
|
Chg
Net charge
|
tPSA
(Ų)
|
MWT
Molecular weight
(g/mol)
|
RB
Rotatable bonds
|
DL |
|
Ref
Reference (pH 7)
|
3.59 |
7.97 |
-9.53 |
0 |
6 |
0 |
63 |
394.423 |
3 |
↓
|
|