|
|
Analogs
-
14263142
-
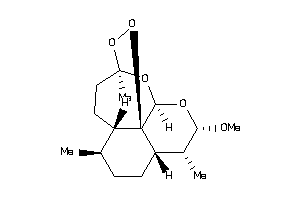
Draw
Identity
99%
90%
80%
70%
Physical Representations
|
Type
pH range
|
xlogP
|
Des A‑Pol
Apolar desolvation
(kcal/mol)
|
Des Pol
Polar desolvation
(kcal/mol)
|
H Don
H-bond donors
|
H Acc
H-bond acceptors
|
Chg
Net charge
|
tPSA
(Ų)
|
MWT
Molecular weight
(g/mol)
|
RB
Rotatable bonds
|
DL |
|
Ref
Reference (pH 7)
|
3.40 |
5.87 |
-6.03 |
0 |
5 |
0 |
46 |
298.379 |
1 |
↓
|
|
|
|
|
|
|
Analogs
Draw
Identity
99%
90%
80%
70%
Clustered Target Annotations
| Code |
Organism Class |
Affinity (nM) |
LE (kcal/mol/atom) |
Type |
|
Z50425-3-O |
Plasmodium Falciparum (cluster #3 Of 22), Other |
Other |
3162 |
0.31 |
Functional ≤ 10μM
|
ChEMBL Target Annotations
| Uniprot |
Swissprot |
Affinity (nM) |
LE (kcal/mol/atom) |
Type |
|
Z50425 |
Z50425
|
Plasmodium Falciparum |
2511.88643 |
0.31 |
Functional ≤ 10μM
|
Physical Representations
|
Type
pH range
|
xlogP
|
Des A‑Pol
Apolar desolvation
(kcal/mol)
|
Des Pol
Polar desolvation
(kcal/mol)
|
H Don
H-bond donors
|
H Acc
H-bond acceptors
|
Chg
Net charge
|
tPSA
(Ų)
|
MWT
Molecular weight
(g/mol)
|
RB
Rotatable bonds
|
DL |
|
Ref
Reference (pH 7)
|
0.80 |
8.33 |
-30.58 |
0 |
5 |
1 |
41 |
332.335 |
0 |
↓
|
|
|
|
|
|
|
|
|
|
|
|
|
|
|
|
Analogs
Draw
Identity
99%
90%
80%
70%
Physical Representations
|
Type
pH range
|
xlogP
|
Des A‑Pol
Apolar desolvation
(kcal/mol)
|
Des Pol
Polar desolvation
(kcal/mol)
|
H Don
H-bond donors
|
H Acc
H-bond acceptors
|
Chg
Net charge
|
tPSA
(Ų)
|
MWT
Molecular weight
(g/mol)
|
RB
Rotatable bonds
|
DL |
|
Ref
Reference (pH 7)
|
4.09 |
11.67 |
-16.33 |
0 |
4 |
0 |
60 |
384.516 |
3 |
↓
|
|
|
|
Analogs
Draw
Identity
99%
90%
80%
70%
Physical Representations
|
Type
pH range
|
xlogP
|
Des A‑Pol
Apolar desolvation
(kcal/mol)
|
Des Pol
Polar desolvation
(kcal/mol)
|
H Don
H-bond donors
|
H Acc
H-bond acceptors
|
Chg
Net charge
|
tPSA
(Ų)
|
MWT
Molecular weight
(g/mol)
|
RB
Rotatable bonds
|
DL |
|
Ref
Reference (pH 7)
|
4.09 |
3.88 |
-12.95 |
0 |
4 |
0 |
60 |
384.516 |
3 |
↓
|
|
|
|
|
|
|
|
|
|
Analogs
Draw
Identity
99%
90%
80%
70%
Physical Representations
|
Type
pH range
|
xlogP
|
Des A‑Pol
Apolar desolvation
(kcal/mol)
|
Des Pol
Polar desolvation
(kcal/mol)
|
H Don
H-bond donors
|
H Acc
H-bond acceptors
|
Chg
Net charge
|
tPSA
(Ų)
|
MWT
Molecular weight
(g/mol)
|
RB
Rotatable bonds
|
DL |
|
Ref
Reference (pH 7)
|
1.74 |
8.65 |
-16.75 |
0 |
6 |
0 |
74 |
305.341 |
3 |
↓
|
|
|
|
Analogs
Draw
Identity
99%
90%
80%
70%
Physical Representations
|
Type
pH range
|
xlogP
|
Des A‑Pol
Apolar desolvation
(kcal/mol)
|
Des Pol
Polar desolvation
(kcal/mol)
|
H Don
H-bond donors
|
H Acc
H-bond acceptors
|
Chg
Net charge
|
tPSA
(Ų)
|
MWT
Molecular weight
(g/mol)
|
RB
Rotatable bonds
|
DL |
|
Ref
Reference (pH 7)
|
-0.02 |
3.82 |
-17.6 |
1 |
2 |
0 |
21 |
114.173 |
0 |
↓
|
|
|
|
Analogs
Draw
Identity
99%
90%
80%
70%
Physical Representations
|
Type
pH range
|
xlogP
|
Des A‑Pol
Apolar desolvation
(kcal/mol)
|
Des Pol
Polar desolvation
(kcal/mol)
|
H Don
H-bond donors
|
H Acc
H-bond acceptors
|
Chg
Net charge
|
tPSA
(Ų)
|
MWT
Molecular weight
(g/mol)
|
RB
Rotatable bonds
|
DL |
|
Ref
Reference (pH 7)
|
0.45 |
-1.29 |
-12.85 |
3 |
6 |
0 |
91 |
241.243 |
7 |
↓
|
|
|
|
Analogs
Draw
Identity
99%
90%
80%
70%
Physical Representations
|
Type
pH range
|
xlogP
|
Des A‑Pol
Apolar desolvation
(kcal/mol)
|
Des Pol
Polar desolvation
(kcal/mol)
|
H Don
H-bond donors
|
H Acc
H-bond acceptors
|
Chg
Net charge
|
tPSA
(Ų)
|
MWT
Molecular weight
(g/mol)
|
RB
Rotatable bonds
|
DL |
|
Ref
Reference (pH 7)
|
0.45 |
-1.29 |
-12.84 |
3 |
6 |
0 |
91 |
241.243 |
7 |
↓
|
|
|
|
Analogs
-
3831086
-
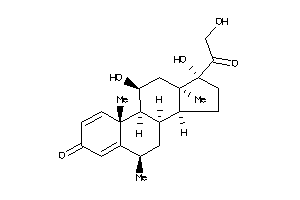
-
3831087
-
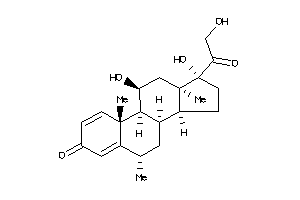
Draw
Identity
99%
90%
80%
70%
Physical Representations
|
Type
pH range
|
xlogP
|
Des A‑Pol
Apolar desolvation
(kcal/mol)
|
Des Pol
Polar desolvation
(kcal/mol)
|
H Don
H-bond donors
|
H Acc
H-bond acceptors
|
Chg
Net charge
|
tPSA
(Ų)
|
MWT
Molecular weight
(g/mol)
|
RB
Rotatable bonds
|
DL |
|
Ref
Reference (pH 7)
|
2.07 |
3.12 |
-16.05 |
3 |
5 |
0 |
95 |
374.477 |
2 |
↓
|
|
|
|
Analogs
Draw
Identity
99%
90%
80%
70%
Physical Representations
|
Type
pH range
|
xlogP
|
Des A‑Pol
Apolar desolvation
(kcal/mol)
|
Des Pol
Polar desolvation
(kcal/mol)
|
H Don
H-bond donors
|
H Acc
H-bond acceptors
|
Chg
Net charge
|
tPSA
(Ų)
|
MWT
Molecular weight
(g/mol)
|
RB
Rotatable bonds
|
DL |
|
Ref
Reference (pH 7)
|
2.07 |
3.59 |
-15.94 |
3 |
5 |
0 |
95 |
374.477 |
2 |
↓
|
|
|
|
Analogs
-
3831086
-

-
3831087
-

Draw
Identity
99%
90%
80%
70%
Physical Representations
|
Type
pH range
|
xlogP
|
Des A‑Pol
Apolar desolvation
(kcal/mol)
|
Des Pol
Polar desolvation
(kcal/mol)
|
H Don
H-bond donors
|
H Acc
H-bond acceptors
|
Chg
Net charge
|
tPSA
(Ų)
|
MWT
Molecular weight
(g/mol)
|
RB
Rotatable bonds
|
DL |
|
Ref
Reference (pH 7)
|
2.07 |
3.85 |
-16.4 |
3 |
5 |
0 |
95 |
374.477 |
2 |
↓
|
|
|
|
Analogs
-
3831086
-

-
3831087
-

Draw
Identity
99%
90%
80%
70%
Physical Representations
|
Type
pH range
|
xlogP
|
Des A‑Pol
Apolar desolvation
(kcal/mol)
|
Des Pol
Polar desolvation
(kcal/mol)
|
H Don
H-bond donors
|
H Acc
H-bond acceptors
|
Chg
Net charge
|
tPSA
(Ų)
|
MWT
Molecular weight
(g/mol)
|
RB
Rotatable bonds
|
DL |
|
Ref
Reference (pH 7)
|
2.07 |
3.49 |
-16.25 |
3 |
5 |
0 |
95 |
374.477 |
2 |
↓
|
|
|
|
Analogs
-
5157919
-
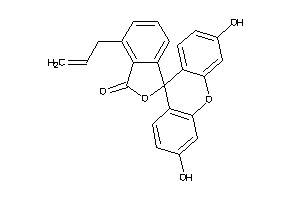
-
6117108
-
Draw
Identity
99%
90%
80%
70%
Physical Representations
|
Type
pH range
|
xlogP
|
Des A‑Pol
Apolar desolvation
(kcal/mol)
|
Des Pol
Polar desolvation
(kcal/mol)
|
H Don
H-bond donors
|
H Acc
H-bond acceptors
|
Chg
Net charge
|
tPSA
(Ų)
|
MWT
Molecular weight
(g/mol)
|
RB
Rotatable bonds
|
DL |
|
Ref
Reference (pH 7)
|
3.69 |
5.23 |
-12.47 |
2 |
5 |
0 |
76 |
332.311 |
0 |
↓
|
|
Hi
High (pH 8-9.5)
|
3.69 |
6 |
-49.46 |
1 |
5 |
-1 |
79 |
331.303 |
0 |
↓
|
|
|
|
Analogs
Draw
Identity
99%
90%
80%
70%
Physical Representations
|
Type
pH range
|
xlogP
|
Des A‑Pol
Apolar desolvation
(kcal/mol)
|
Des Pol
Polar desolvation
(kcal/mol)
|
H Don
H-bond donors
|
H Acc
H-bond acceptors
|
Chg
Net charge
|
tPSA
(Ų)
|
MWT
Molecular weight
(g/mol)
|
RB
Rotatable bonds
|
DL |
|
Ref
Reference (pH 7)
|
-1.06 |
-4.18 |
-8.88 |
4 |
5 |
0 |
90 |
205.254 |
6 |
↓
|
|
|
|
Analogs
Draw
Identity
99%
90%
80%
70%
Physical Representations
|
Type
pH range
|
xlogP
|
Des A‑Pol
Apolar desolvation
(kcal/mol)
|
Des Pol
Polar desolvation
(kcal/mol)
|
H Don
H-bond donors
|
H Acc
H-bond acceptors
|
Chg
Net charge
|
tPSA
(Ų)
|
MWT
Molecular weight
(g/mol)
|
RB
Rotatable bonds
|
DL |
|
Ref
Reference (pH 7)
|
-1.06 |
-4.06 |
-8.96 |
4 |
5 |
0 |
90 |
205.254 |
6 |
↓
|
|
|
|
Analogs
-
1849618
-
Draw
Identity
99%
90%
80%
70%
Physical Representations
|
Type
pH range
|
xlogP
|
Des A‑Pol
Apolar desolvation
(kcal/mol)
|
Des Pol
Polar desolvation
(kcal/mol)
|
H Don
H-bond donors
|
H Acc
H-bond acceptors
|
Chg
Net charge
|
tPSA
(Ų)
|
MWT
Molecular weight
(g/mol)
|
RB
Rotatable bonds
|
DL |
|
Ref
Reference (pH 7)
|
3.23 |
7.81 |
-8.09 |
1 |
2 |
0 |
37 |
298.426 |
0 |
↓
|
|
|
|
Analogs
-
1849618
-

Draw
Identity
99%
90%
80%
70%
Physical Representations
|
Type
pH range
|
xlogP
|
Des A‑Pol
Apolar desolvation
(kcal/mol)
|
Des Pol
Polar desolvation
(kcal/mol)
|
H Don
H-bond donors
|
H Acc
H-bond acceptors
|
Chg
Net charge
|
tPSA
(Ų)
|
MWT
Molecular weight
(g/mol)
|
RB
Rotatable bonds
|
DL |
|
Ref
Reference (pH 7)
|
3.23 |
7.72 |
-8.68 |
1 |
2 |
0 |
37 |
298.426 |
0 |
↓
|
|
|
|
Analogs
-
16968675
-
Draw
Identity
99%
90%
80%
70%
Clustered Target Annotations
| Code |
Organism Class |
Affinity (nM) |
LE (kcal/mol/atom) |
Type |
|
ESR1-2-E |
Estrogen Receptor Alpha (cluster #2 Of 5), Eukaryotic |
Eukaryotes |
1 |
0.57 |
Binding ≤ 10μM
|
|
ESR2-2-E |
Estrogen Receptor Beta (cluster #2 Of 4), Eukaryotic |
Eukaryotes |
1 |
0.57 |
Binding ≤ 10μM
|
|
PRGR-1-E |
Progesterone Receptor (cluster #1 Of 3), Eukaryotic |
Eukaryotes |
3 |
0.54 |
Binding ≤ 10μM
|
|
PRGR-2-E |
Progesterone Receptor (cluster #2 Of 2), Eukaryotic |
Eukaryotes |
2 |
0.55 |
Functional ≤ 10μM
|
Physical Representations
|
Type
pH range
|
xlogP
|
Des A‑Pol
Apolar desolvation
(kcal/mol)
|
Des Pol
Polar desolvation
(kcal/mol)
|
H Don
H-bond donors
|
H Acc
H-bond acceptors
|
Chg
Net charge
|
tPSA
(Ų)
|
MWT
Molecular weight
(g/mol)
|
RB
Rotatable bonds
|
DL |
|
Ref
Reference (pH 7)
|
3.07 |
8.05 |
-6.86 |
1 |
2 |
0 |
37 |
298.426 |
0 |
↓
|
|
|
|
Analogs
-
1849618
-

Draw
Identity
99%
90%
80%
70%
Physical Representations
|
Type
pH range
|
xlogP
|
Des A‑Pol
Apolar desolvation
(kcal/mol)
|
Des Pol
Polar desolvation
(kcal/mol)
|
H Don
H-bond donors
|
H Acc
H-bond acceptors
|
Chg
Net charge
|
tPSA
(Ų)
|
MWT
Molecular weight
(g/mol)
|
RB
Rotatable bonds
|
DL |
|
Ref
Reference (pH 7)
|
3.23 |
7.84 |
-7.33 |
1 |
2 |
0 |
37 |
298.426 |
0 |
↓
|
|
Ref
Reference (pH 7)
|
3.23 |
7.89 |
-9.41 |
1 |
2 |
0 |
37 |
298.426 |
0 |
↓
|
|
|
|
Analogs
-
1482190
-
-
3812889
-
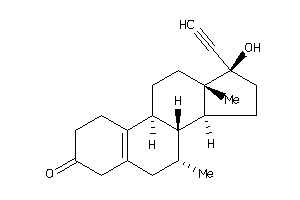
Draw
Identity
99%
90%
80%
70%
Physical Representations
|
Type
pH range
|
xlogP
|
Des A‑Pol
Apolar desolvation
(kcal/mol)
|
Des Pol
Polar desolvation
(kcal/mol)
|
H Don
H-bond donors
|
H Acc
H-bond acceptors
|
Chg
Net charge
|
tPSA
(Ų)
|
MWT
Molecular weight
(g/mol)
|
RB
Rotatable bonds
|
DL |
|
Ref
Reference (pH 7)
|
3.07 |
8.02 |
-6.99 |
1 |
2 |
0 |
37 |
298.426 |
0 |
↓
|
|
|
|
Analogs
-
1482190
-

-
3812889
-

Draw
Identity
99%
90%
80%
70%
Physical Representations
|
Type
pH range
|
xlogP
|
Des A‑Pol
Apolar desolvation
(kcal/mol)
|
Des Pol
Polar desolvation
(kcal/mol)
|
H Don
H-bond donors
|
H Acc
H-bond acceptors
|
Chg
Net charge
|
tPSA
(Ų)
|
MWT
Molecular weight
(g/mol)
|
RB
Rotatable bonds
|
DL |
|
Ref
Reference (pH 7)
|
3.07 |
8.02 |
-6.84 |
1 |
2 |
0 |
37 |
298.426 |
0 |
↓
|
|
|
|
Analogs
-
1482190
-

-
3812889
-

Draw
Identity
99%
90%
80%
70%
Physical Representations
|
Type
pH range
|
xlogP
|
Des A‑Pol
Apolar desolvation
(kcal/mol)
|
Des Pol
Polar desolvation
(kcal/mol)
|
H Don
H-bond donors
|
H Acc
H-bond acceptors
|
Chg
Net charge
|
tPSA
(Ų)
|
MWT
Molecular weight
(g/mol)
|
RB
Rotatable bonds
|
DL |
|
Ref
Reference (pH 7)
|
3.07 |
7.83 |
-6.61 |
1 |
2 |
0 |
37 |
298.426 |
0 |
↓
|
|
|
|
Analogs
-
5849525
-
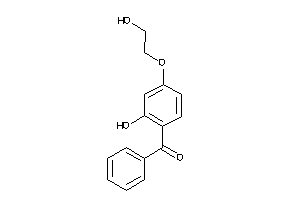
-
187
-
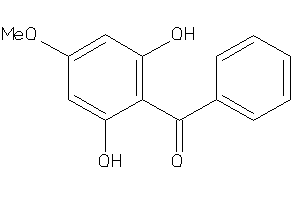
Draw
Identity
99%
90%
80%
70%
Clustered Target Annotations
| Code |
Organism Class |
Affinity (nM) |
LE (kcal/mol/atom) |
Type |
|
LIPS-2-E |
Hormone Sensitive Lipase (cluster #2 Of 3), Eukaryotic |
Eukaryotes |
3250 |
0.45 |
Binding ≤ 10μM
|
ChEMBL Target Annotations
| Uniprot |
Swissprot |
Affinity (nM) |
LE (kcal/mol/atom) |
Type |
|
LIPS_RAT |
P15304
|
Hormone-sensitive Lipase, Rat |
3250 |
0.45 |
Binding ≤ 10μM
|
Physical Representations
|
Type
pH range
|
xlogP
|
Des A‑Pol
Apolar desolvation
(kcal/mol)
|
Des Pol
Polar desolvation
(kcal/mol)
|
H Don
H-bond donors
|
H Acc
H-bond acceptors
|
Chg
Net charge
|
tPSA
(Ų)
|
MWT
Molecular weight
(g/mol)
|
RB
Rotatable bonds
|
DL |
|
Ref
Reference (pH 7)
|
3.37 |
4.46 |
-8.1 |
1 |
3 |
0 |
47 |
228.247 |
3 |
↓
|
|
Hi
High (pH 8-9.5)
|
3.37 |
5.24 |
-49.88 |
0 |
3 |
-1 |
49 |
227.239 |
3 |
↓
|
|
|
|
Analogs
Draw
Identity
99%
90%
80%
70%
Clustered Target Annotations
| Code |
Organism Class |
Affinity (nM) |
LE (kcal/mol/atom) |
Type |
|
MDR1-2-E |
P-glycoprotein 1 (cluster #2 Of 2), Eukaryotic |
Eukaryotes |
1500 |
0.16 |
Functional ≤ 10μM
|
|
CP2B6-3-E |
Cytochrome P450 2B6 (cluster #3 Of 4), Eukaryotic |
Eukaryotes |
2000 |
0.16 |
ADME/T ≤ 10μM
|
|
CP3A4-2-E |
Cytochrome P450 3A4 (cluster #2 Of 4), Eukaryotic |
Eukaryotes |
50 |
0.20 |
ADME/T ≤ 10μM
|
|
CP3A5-1-E |
Cytochrome P450 3A5 (cluster #1 Of 1), Eukaryotic |
Eukaryotes |
120 |
0.19 |
ADME/T ≤ 10μM
|
|
Z102015-1-O |
Plasmodium Vivax (cluster #1 Of 1), Other |
Other |
2233 |
0.16 |
Functional ≤ 10μM
|
|
Z50038-1-O |
Plasmodium Yoelii Yoelii (cluster #1 Of 2), Other |
Other |
34 |
0.21 |
Functional ≤ 10μM
|
|
Z50425-3-O |
Plasmodium Falciparum (cluster #3 Of 22), Other |
Other |
9664 |
0.14 |
Functional ≤ 10μM
|
|
Z50607-1-O |
Human Immunodeficiency Virus 1 (cluster #1 Of 10), Other |
Other |
25 |
0.21 |
Functional ≤ 10μM
|
|
Z50607-1-O |
Human Immunodeficiency Virus 1 (cluster #1 Of 10), Other |
Other |
90 |
0.20 |
Functional ≤ 10μM
|
|
Z50658-3-O |
Human Immunodeficiency Virus 2 (cluster #3 Of 4), Other |
Other |
84 |
0.20 |
Functional ≤ 10μM
|
|
Z50677-1-O |
Human Immunodeficiency Virus (cluster #1 Of 3), Other |
Other |
38 |
0.21 |
Functional ≤ 10μM
|
|
Z80294-1-O |
MT2 (Lymphocytes) (cluster #1 Of 1), Other |
Other |
10 |
0.22 |
Functional ≤ 10μM
|
|
Z80295-2-O |
MT4 (Lymphocytes) (cluster #2 Of 8), Other |
Other |
90 |
0.20 |
Functional ≤ 10μM |
|
Z102164-1-O |
Liver Microsomes (cluster #1 Of 1), Other |
Other |
40 |
0.21 |
ADME/T ≤ 10μM
|
|
Q72874-1-V |
Human Immunodeficiency Virus Type 1 Protease (cluster #1 Of 3), Viral |
Viruses |
60 |
0.20 |
Binding ≤ 10μM
|
Physical Representations
|
Type
pH range
|
xlogP
|
Des A‑Pol
Apolar desolvation
(kcal/mol)
|
Des Pol
Polar desolvation
(kcal/mol)
|
H Don
H-bond donors
|
H Acc
H-bond acceptors
|
Chg
Net charge
|
tPSA
(Ų)
|
MWT
Molecular weight
(g/mol)
|
RB
Rotatable bonds
|
DL |
|
Ref
Reference (pH 7)
|
7.51 |
12.91 |
-25.34 |
4 |
11 |
0 |
146 |
720.962 |
18 |
↓
|
|
|
|
|
|
|
|
|
|
Analogs
Draw
Identity
99%
90%
80%
70%
Physical Representations
|
Type
pH range
|
xlogP
|
Des A‑Pol
Apolar desolvation
(kcal/mol)
|
Des Pol
Polar desolvation
(kcal/mol)
|
H Don
H-bond donors
|
H Acc
H-bond acceptors
|
Chg
Net charge
|
tPSA
(Ų)
|
MWT
Molecular weight
(g/mol)
|
RB
Rotatable bonds
|
DL |
|
Ref
Reference (pH 7)
|
2.14 |
2.16 |
-3.31 |
1 |
1 |
0 |
20 |
128.558 |
0 |
↓
|
|
|
|
Analogs
-
4400
-
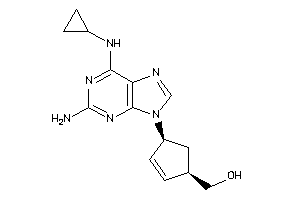
Draw
Identity
99%
90%
80%
70%
Physical Representations
|
Type
pH range
|
xlogP
|
Des A‑Pol
Apolar desolvation
(kcal/mol)
|
Des Pol
Polar desolvation
(kcal/mol)
|
H Don
H-bond donors
|
H Acc
H-bond acceptors
|
Chg
Net charge
|
tPSA
(Ų)
|
MWT
Molecular weight
(g/mol)
|
RB
Rotatable bonds
|
DL |
|
Ref
Reference (pH 7)
|
1.22 |
5.36 |
-10.23 |
4 |
7 |
0 |
102 |
286.339 |
4 |
↓
|
|
Lo
Low (pH 4.5-6)
|
1.22 |
5.75 |
-28.77 |
5 |
7 |
1 |
103 |
287.347 |
4 |
↓
|
|
|
|
Analogs
-
4400
-

Draw
Identity
99%
90%
80%
70%
Physical Representations
|
Type
pH range
|
xlogP
|
Des A‑Pol
Apolar desolvation
(kcal/mol)
|
Des Pol
Polar desolvation
(kcal/mol)
|
H Don
H-bond donors
|
H Acc
H-bond acceptors
|
Chg
Net charge
|
tPSA
(Ų)
|
MWT
Molecular weight
(g/mol)
|
RB
Rotatable bonds
|
DL |
|
Ref
Reference (pH 7)
|
1.22 |
5.28 |
-10.07 |
4 |
7 |
0 |
102 |
286.339 |
4 |
↓
|
|
|
|
Analogs
Draw
Identity
99%
90%
80%
70%
Physical Representations
|
Type
pH range
|
xlogP
|
Des A‑Pol
Apolar desolvation
(kcal/mol)
|
Des Pol
Polar desolvation
(kcal/mol)
|
H Don
H-bond donors
|
H Acc
H-bond acceptors
|
Chg
Net charge
|
tPSA
(Ų)
|
MWT
Molecular weight
(g/mol)
|
RB
Rotatable bonds
|
DL |
|
Ref
Reference (pH 7)
|
0.50 |
2.26 |
-19.27 |
3 |
4 |
0 |
72 |
178.191 |
2 |
↓
|
|
|
|
Analogs
-
26895588
-
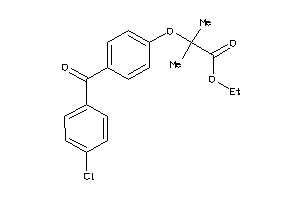
-
33754608
-
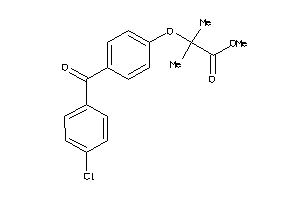
Draw
Identity
99%
90%
80%
70%
Clustered Target Annotations
| Code |
Organism Class |
Affinity (nM) |
LE (kcal/mol/atom) |
Type |
|
FABPL-3-E |
Fatty Acid-binding Protein, Liver (cluster #3 Of 4), Eukaryotic |
Eukaryotes |
62 |
0.40 |
Binding ≤ 10μM
|
|
PPARA-1-E |
Peroxisome Proliferator-activated Receptor Alpha (cluster #1 Of 3), Eukaryotic |
Eukaryotes |
3210 |
0.31 |
Binding ≤ 10μM
|
|
PPARG-1-E |
Peroxisome Proliferator-activated Receptor Gamma (cluster #1 Of 2), Eukaryotic |
Eukaryotes |
570 |
0.35 |
Binding ≤ 10μM
|
|
PPARA-1-E |
Peroxisome Proliferator-activated Receptor Alpha (cluster #1 Of 2), Eukaryotic |
Eukaryotes |
2000 |
0.32 |
Functional ≤ 10μM
|
|
Z50425-1-O |
Plasmodium Falciparum (cluster #1 Of 22), Other |
Other |
7943 |
0.29 |
Functional ≤ 10μM
|
Physical Representations
|
Type
pH range
|
xlogP
|
Des A‑Pol
Apolar desolvation
(kcal/mol)
|
Des Pol
Polar desolvation
(kcal/mol)
|
H Don
H-bond donors
|
H Acc
H-bond acceptors
|
Chg
Net charge
|
tPSA
(Ų)
|
MWT
Molecular weight
(g/mol)
|
RB
Rotatable bonds
|
DL |
|
Ref
Reference (pH 7)
|
5.54 |
11.71 |
-10.11 |
0 |
4 |
0 |
53 |
360.837 |
7 |
↓
|
|
|
|
Analogs
Draw
Identity
99%
90%
80%
70%
Clustered Target Annotations
| Code |
Organism Class |
Affinity (nM) |
LE (kcal/mol/atom) |
Type |
|
CP19A-3-E |
Cytochrome P450 19A1 (cluster #3 Of 3), Eukaryotic |
Eukaryotes |
8 |
0.52 |
Binding ≤ 10μM |
Physical Representations
|
Type
pH range
|
xlogP
|
Des A‑Pol
Apolar desolvation
(kcal/mol)
|
Des Pol
Polar desolvation
(kcal/mol)
|
H Don
H-bond donors
|
H Acc
H-bond acceptors
|
Chg
Net charge
|
tPSA
(Ų)
|
MWT
Molecular weight
(g/mol)
|
RB
Rotatable bonds
|
DL |
|
Ref
Reference (pH 7)
|
2.15 |
10.78 |
-13.32 |
0 |
5 |
0 |
78 |
285.31 |
3 |
↓
|
|
|
|
Analogs
Draw
Identity
99%
90%
80%
70%
Physical Representations
|
Type
pH range
|
xlogP
|
Des A‑Pol
Apolar desolvation
(kcal/mol)
|
Des Pol
Polar desolvation
(kcal/mol)
|
H Don
H-bond donors
|
H Acc
H-bond acceptors
|
Chg
Net charge
|
tPSA
(Ų)
|
MWT
Molecular weight
(g/mol)
|
RB
Rotatable bonds
|
DL |
|
Ref
Reference (pH 7)
|
3.54 |
8.27 |
-7 |
1 |
2 |
0 |
37 |
312.453 |
0 |
↓
|
|
|
|
Analogs
Draw
Identity
99%
90%
80%
70%
Physical Representations
|
Type
pH range
|
xlogP
|
Des A‑Pol
Apolar desolvation
(kcal/mol)
|
Des Pol
Polar desolvation
(kcal/mol)
|
H Don
H-bond donors
|
H Acc
H-bond acceptors
|
Chg
Net charge
|
tPSA
(Ų)
|
MWT
Molecular weight
(g/mol)
|
RB
Rotatable bonds
|
DL |
|
Ref
Reference (pH 7)
|
3.54 |
8.24 |
-6.8 |
1 |
2 |
0 |
37 |
312.453 |
0 |
↓
|
|
|
|
Analogs
Draw
Identity
99%
90%
80%
70%
Physical Representations
|
Type
pH range
|
xlogP
|
Des A‑Pol
Apolar desolvation
(kcal/mol)
|
Des Pol
Polar desolvation
(kcal/mol)
|
H Don
H-bond donors
|
H Acc
H-bond acceptors
|
Chg
Net charge
|
tPSA
(Ų)
|
MWT
Molecular weight
(g/mol)
|
RB
Rotatable bonds
|
DL |
|
Ref
Reference (pH 7)
|
9.46 |
15.79 |
-5.38 |
2 |
2 |
0 |
40 |
516.857 |
8 |
↓
|
|
|
|
Analogs
Draw
Identity
99%
90%
80%
70%
Physical Representations
|
Type
pH range
|
xlogP
|
Des A‑Pol
Apolar desolvation
(kcal/mol)
|
Des Pol
Polar desolvation
(kcal/mol)
|
H Don
H-bond donors
|
H Acc
H-bond acceptors
|
Chg
Net charge
|
tPSA
(Ų)
|
MWT
Molecular weight
(g/mol)
|
RB
Rotatable bonds
|
DL |
|
Ref
Reference (pH 7)
|
-0.58 |
-2.83 |
-15.15 |
5 |
5 |
0 |
98 |
217.14 |
2 |
↓
|
|
|
|
Analogs
Draw
Identity
99%
90%
80%
70%
Physical Representations
|
Type
pH range
|
xlogP
|
Des A‑Pol
Apolar desolvation
(kcal/mol)
|
Des Pol
Polar desolvation
(kcal/mol)
|
H Don
H-bond donors
|
H Acc
H-bond acceptors
|
Chg
Net charge
|
tPSA
(Ų)
|
MWT
Molecular weight
(g/mol)
|
RB
Rotatable bonds
|
DL |
|
Ref
Reference (pH 7)
|
0.12 |
-9.01 |
-11.06 |
4 |
8 |
0 |
119 |
303.681 |
2 |
↓
|
|
|
|
Analogs
Draw
Identity
99%
90%
80%
70%
Physical Representations
|
Type
pH range
|
xlogP
|
Des A‑Pol
Apolar desolvation
(kcal/mol)
|
Des Pol
Polar desolvation
(kcal/mol)
|
H Don
H-bond donors
|
H Acc
H-bond acceptors
|
Chg
Net charge
|
tPSA
(Ų)
|
MWT
Molecular weight
(g/mol)
|
RB
Rotatable bonds
|
DL |
|
Ref
Reference (pH 7)
|
0.12 |
-8.62 |
-11.55 |
4 |
8 |
0 |
119 |
303.681 |
2 |
↓
|
|
|
|
Analogs
Draw
Identity
99%
90%
80%
70%
Clustered Target Annotations
| Code |
Organism Class |
Affinity (nM) |
LE (kcal/mol/atom) |
Type |
|
HDAH-1-B |
Histone Deacetylase-like Amidohydrolase (cluster #1 Of 2), Bacterial |
Bacteria |
1300 |
0.43 |
Binding ≤ 10μM
|
|
B1WBY8-1-E |
Histone Deacetylase 2 (cluster #1 Of 1), Eukaryotic |
Eukaryotes |
440 |
0.47 |
Binding ≤ 10μM
|
|
HDA10-1-E |
Histone Deacetylase 10 (cluster #1 Of 3), Eukaryotic |
Eukaryotes |
72 |
0.53 |
Binding ≤ 10μM
|
|
HDA11-3-E |
Histone Deacetylase 11 (cluster #3 Of 3), Eukaryotic |
Eukaryotes |
50 |
0.54 |
Binding ≤ 10μM
|
|
HDAC1-3-E |
Histone Deacetylase 1 (cluster #3 Of 4), Eukaryotic |
Eukaryotes |
440 |
0.47 |
Binding ≤ 10μM
|
|
HDAC2-4-E |
Histone Deacetylase 2 (cluster #4 Of 4), Eukaryotic |
Eukaryotes |
921 |
0.44 |
Binding ≤ 10μM |
|
HDAC3-2-E |
Histone Deacetylase 3 (cluster #2 Of 3), Eukaryotic |
Eukaryotes |
440 |
0.47 |
Binding ≤ 10μM
|
|
HDAC4-2-E |
Histone Deacetylase 4 (cluster #2 Of 3), Eukaryotic |
Eukaryotes |
440 |
0.47 |
Binding ≤ 10μM
|
|
HDAC5-1-E |
Histone Deacetylase 5 (cluster #1 Of 3), Eukaryotic |
Eukaryotes |
50 |
0.54 |
Binding ≤ 10μM
|
|
HDAC6-2-E |
Histone Deacetylase 6 (cluster #2 Of 3), Eukaryotic |
Eukaryotes |
90 |
0.52 |
Binding ≤ 10μM
|
|
HDAC7-3-E |
Histone Deacetylase 7 (cluster #3 Of 3), Eukaryotic |
Eukaryotes |
440 |
0.47 |
Binding ≤ 10μM
|
|
HDAC8-1-E |
Histone Deacetylase 8 (cluster #1 Of 4), Eukaryotic |
Eukaryotes |
820 |
0.45 |
Binding ≤ 10μM
|
|
HDAC9-3-E |
Histone Deacetylase 9 (cluster #3 Of 3), Eukaryotic |
Eukaryotes |
65 |
0.53 |
Binding ≤ 10μM
|
|
NCOR2-1-E |
Nuclear Receptor Corepressor 2 (cluster #1 Of 2), Eukaryotic |
Eukaryotes |
34 |
0.55 |
Binding ≤ 10μM
|
|
Q5RJZ2-1-E |
Histone Deacetylase 5 (cluster #1 Of 1), Eukaryotic |
Eukaryotes |
440 |
0.47 |
Binding ≤ 10μM
|
|
Q7K6A1-1-E |
Histone Deacetylase (cluster #1 Of 1), Eukaryotic |
Eukaryotes |
100 |
0.52 |
Binding ≤ 10μM
|
|
Q94F81-1-E |
Histone Deacetylase HD2 (cluster #1 Of 1), Eukaryotic |
Eukaryotes |
50 |
0.54 |
Binding ≤ 10μM
|
|
Q99P97-1-E |
Histone Deacetylase 6 (cluster #1 Of 1), Eukaryotic |
Eukaryotes |
440 |
0.47 |
Binding ≤ 10μM
|
|
Q9XYC7-1-E |
Histone Deacetylase (cluster #1 Of 1), Eukaryotic |
Eukaryotes |
59 |
0.53 |
Binding ≤ 10μM
|
|
Q9ZTP8-1-E |
Histone Deacetylase HD1B (cluster #1 Of 1), Eukaryotic |
Eukaryotes |
30 |
0.55 |
Binding ≤ 10μM
|
|
HDA10-1-E |
Histone Deacetylase 10 (cluster #1 Of 1), Eukaryotic |
Eukaryotes |
7200 |
0.38 |
Functional ≤ 10μM
|
|
HDA11-1-E |
Histone Deacetylase 11 (cluster #1 Of 1), Eukaryotic |
Eukaryotes |
7200 |
0.38 |
Functional ≤ 10μM
|
|
HDAC1-1-E |
Histone Deacetylase 1 (cluster #1 Of 2), Eukaryotic |
Eukaryotes |
7200 |
0.38 |
Functional ≤ 10μM
|
|
HDAC2-1-E |
Histone Deacetylase 2 (cluster #1 Of 2), Eukaryotic |
Eukaryotes |
7200 |
0.38 |
Functional ≤ 10μM
|
|
HDAC3-1-E |
Histone Deacetylase 3 (cluster #1 Of 2), Eukaryotic |
Eukaryotes |
7200 |
0.38 |
Functional ≤ 10μM
|
|
HDAC4-1-E |
Histone Deacetylase 4 (cluster #1 Of 2), Eukaryotic |
Eukaryotes |
7200 |
0.38 |
Functional ≤ 10μM
|
|
HDAC5-1-E |
Histone Deacetylase 5 (cluster #1 Of 2), Eukaryotic |
Eukaryotes |
7200 |
0.38 |
Functional ≤ 10μM
|
|
HDAC6-1-E |
Histone Deacetylase 6 (cluster #1 Of 1), Eukaryotic |
Eukaryotes |
7200 |
0.38 |
Functional ≤ 10μM
|
|
HDAC7-1-E |
Histone Deacetylase 7 (cluster #1 Of 2), Eukaryotic |
Eukaryotes |
7200 |
0.38 |
Functional ≤ 10μM
|
|
HDAC8-1-E |
Histone Deacetylase 8 (cluster #1 Of 2), Eukaryotic |
Eukaryotes |
7200 |
0.38 |
Functional ≤ 10μM
|
|
HDAC9-1-E |
Histone Deacetylase 9 (cluster #1 Of 2), Eukaryotic |
Eukaryotes |
7200 |
0.38 |
Functional ≤ 10μM
|
|
Q94F81-2-E |
Histone Deacetylase HD2 (cluster #2 Of 2), Eukaryotic |
Eukaryotes |
50 |
0.54 |
Functional ≤ 10μM
|
|
Z102015-1-O |
Plasmodium Vivax (cluster #1 Of 1), Other |
Other |
170 |
0.50 |
Functional ≤ 10μM
|
|
Z103205-2-O |
A431 (cluster #2 Of 4), Other |
Other |
4200 |
0.40 |
Functional ≤ 10μM
|
|
Z103348-2-O |
NCI-H2122 (cluster #2 Of 2), Other |
Other |
7500 |
0.38 |
Functional ≤ 10μM
|
|
Z50136-2-O |
Plasmodium Falciparum (isolate FcB1 / Columbia) (cluster #2 Of 3), Other |
Other |
820 |
0.45 |
Functional ≤ 10μM
|
|
Z50425-5-O |
Plasmodium Falciparum (cluster #5 Of 22), Other |
Other |
800 |
0.45 |
Functional ≤ 10μM
|
|
Z80054-4-O |
Caco-2 (Colon Adenocarcinoma Cells) (cluster #4 Of 4), Other |
Other |
8100 |
0.38 |
Functional ≤ 10μM
|
|
Z80064-7-O |
CCRF-CEM (T-cell Leukemia) (cluster #7 Of 9), Other |
Other |
950 |
0.44 |
Functional ≤ 10μM
|
|
Z80125-1-O |
DU-145 (Prostate Carcinoma) (cluster #1 Of 9), Other |
Other |
2120 |
0.42 |
Functional ≤ 10μM
|
|
Z80156-4-O |
HL-60 (Promyeloblast Leukemia Cells) (cluster #4 Of 12), Other |
Other |
1200 |
0.44 |
Functional ≤ 10μM
|
|
Z80164-1-O |
HT-1080 (Fibrosarcoma Cells) (cluster #1 Of 6), Other |
Other |
2400 |
0.41 |
Functional ≤ 10μM
|
|
Z80166-4-O |
HT-29 (Colon Adenocarcinoma Cells) (cluster #4 Of 12), Other |
Other |
2000 |
0.42 |
Functional ≤ 10μM
|
|
Z80186-1-O |
K562 (Erythroleukemia Cells) (cluster #1 Of 11), Other |
Other |
750 |
0.45 |
Functional ≤ 10μM
|
|
Z80224-6-O |
MCF7 (Breast Carcinoma Cells) (cluster #6 Of 14), Other |
Other |
8500 |
0.37 |
Functional ≤ 10μM
|
|
Z80244-1-O |
MDA-MB-468 (Breast Adenocarcinoma) (cluster #1 Of 7), Other |
Other |
5000 |
0.39 |
Functional ≤ 10μM
|
|
Z80322-1-O |
NCI-H358 (Lung Carcinama Cells) (cluster #1 Of 2), Other |
Other |
2500 |
0.41 |
Functional ≤ 10μM
|
|
Z80390-3-O |
PC-3 (Prostate Carcinoma Cells) (cluster #3 Of 10), Other |
Other |
6500 |
0.38 |
Functional ≤ 10μM
|
|
Z80418-9-O |
RAW264.7 (Monocytic-macrophage Leukemia Cells) (cluster #9 Of 9), Other |
Other |
760 |
0.45 |
Functional ≤ 10μM
|
|
Z80475-2-O |
SK-BR-3 (Breast Adenocarcinoma) (cluster #2 Of 3), Other |
Other |
2100 |
0.42 |
Functional ≤ 10μM
|
|
Z80493-3-O |
SK-OV-3 (Ovarian Carcinoma Cells) (cluster #3 Of 6), Other |
Other |
2500 |
0.41 |
Functional ≤ 10μM
|
|
Z80513-1-O |
SQ20B (cluster #1 Of 1), Other |
Other |
3000 |
0.41 |
Functional ≤ 10μM
|
|
Z80514-1-O |
St-4 (Stomach Carcinoma Cells) (cluster #1 Of 1), Other |
Other |
5200 |
0.39 |
Functional ≤ 10μM
|
|
Z80682-2-O |
A549 (Lung Carcinoma Cells) (cluster #2 Of 11), Other |
Other |
868 |
0.45 |
Functional ≤ 10μM
|
|
Z80838-1-O |
EOL1 (Eosinophilic Cells) (cluster #1 Of 1), Other |
Other |
1000 |
0.44 |
Functional ≤ 10μM
|
|
Z80857-1-O |
Friend Leukemia Cell Line (cluster #1 Of 2), Other |
Other |
990 |
0.44 |
Functional ≤ 10μM
|
|
Z80874-3-O |
CEM (T-cell Leukemia) (cluster #3 Of 7), Other |
Other |
1900 |
0.42 |
Functional ≤ 10μM
|
|
Z80877-1-O |
NCI-H1299 (Non-small Cell Lung Carcinoma) (cluster #1 Of 2), Other |
Other |
7240 |
0.38 |
Functional ≤ 10μM
|
|
Z80896-1-O |
NCI-H69 (Small Cell Lung Carcinoma Cells) (cluster #1 Of 1), Other |
Other |
2060 |
0.42 |
Functional ≤ 10μM
|
|
Z80928-3-O |
HCT-116 (Colon Carcinoma Cells) (cluster #3 Of 9), Other |
Other |
900 |
0.45 |
Functional ≤ 10μM
|
|
Z81020-4-O |
HepG2 (Hepatoblastoma Cells) (cluster #4 Of 8), Other |
Other |
9300 |
0.37 |
Functional ≤ 10μM
|
|
Z81024-2-O |
NCI-H460 (Non-small Cell Lung Carcinoma) (cluster #2 Of 8), Other |
Other |
3448 |
0.40 |
Functional ≤ 10μM
|
|
Z81034-3-O |
A2780 (Ovarian Carcinoma Cells) (cluster #3 Of 10), Other |
Other |
2600 |
0.41 |
Functional ≤ 10μM
|
|
Z81072-6-O |
Jurkat (Acute Leukemic T-cells) (cluster #6 Of 10), Other |
Other |
2300 |
0.42 |
Functional ≤ 10μM
|
|
Z81170-3-O |
LNCaP (Prostate Carcinoma) (cluster #3 Of 5), Other |
Other |
580 |
0.46 |
Functional ≤ 10μM
|
|
Z81184-5-O |
LOX IMVI (Melanoma Cells) (cluster #5 Of 5), Other |
Other |
1300 |
0.43 |
Functional ≤ 10μM
|
|
Z81245-4-O |
MDA-MB-435 (Breast Carcinoma Cells) (cluster #4 Of 6), Other |
Other |
1900 |
0.42 |
Functional ≤ 10μM
|
|
Z81247-6-O |
HeLa (Cervical Adenocarcinoma Cells) (cluster #6 Of 9), Other |
Other |
460 |
0.47 |
Functional ≤ 10μM
|
|
Z81252-6-O |
MDA-MB-231 (Breast Adenocarcinoma Cells) (cluster #6 Of 11), Other |
Other |
2200 |
0.42 |
Functional ≤ 10μM
|
|
Z81280-3-O |
NCI-H226 (Non-small Cell Lung Carcinoma Cells) (cluster #3 Of 3), Other |
Other |
3480 |
0.40 |
Functional ≤ 10μM
|
|
Z81281-4-O |
NCI-H23 (Non-small Cell Lung Carcinoma Cells) (cluster #4 Of 5), Other |
Other |
383 |
0.47 |
Functional ≤ 10μM
|
|
Z81283-1-O |
NCI-H522 (Non-small Cell Lung Carcinoma Cells) (cluster #1 Of 2), Other |
Other |
832 |
0.45 |
Functional ≤ 10μM
|
|
Z81331-1-O |
SW-620 (Colon Adenocarcinoma Cells) (cluster #1 Of 6), Other |
Other |
600 |
0.46 |
Functional ≤ 10μM
|
|
Z81335-2-O |
HCT-15 (Colon Adenocarcinoma Cells) (cluster #2 Of 5), Other |
Other |
3900 |
0.40 |
Functional ≤ 10μM
|
|
Z80957-2-O |
HMEC (Microvascular Endothelial Cells) (cluster #2 Of 2), Other |
Other |
1300 |
0.43 |
ADME/T ≤ 10μM
|
ChEMBL Target Annotations
| Uniprot |
Swissprot |
Affinity (nM) |
LE (kcal/mol/atom) |
Type |
|
Q9XYC7_PLAFA |
Q9XYC7
|
Histone Deacetylase, Plafa |
130 |
0.51 |
Binding ≤ 1μM
|
|
Q7K6A1_PLAF7 |
Q7K6A1
|
Histone Deacetylase, Plaf7 |
100 |
0.52 |
Binding ≤ 1μM
|
|
HDAC1_MOUSE |
O09106
|
Histone Deacetylase 1, Mouse |
112 |
0.51 |
Binding ≤ 1μM
|
|
HDAC1_RAT |
Q4QQW4
|
Histone Deacetylase 1, Rat |
165 |
0.50 |
Binding ≤ 1μM
|
|
HDAC1_HUMAN |
Q13547
|
Histone Deacetylase 1, Human |
1.3 |
0.65 |
Binding ≤ 1μM
|
|
HDA10_HUMAN |
Q969S8
|
Histone Deacetylase 10, Human |
10 |
0.59 |
Binding ≤ 1μM
|
|
HDA11_HUMAN |
Q96DB2
|
Histone Deacetylase 11, Human |
10 |
0.59 |
Binding ≤ 1μM
|
|
HDAC2_HUMAN |
Q92769
|
Histone Deacetylase 2, Human |
1.6 |
0.65 |
Binding ≤ 1μM
|
|
B1WBY8_RAT |
B1WBY8
|
Histone Deacetylase 2, Rat |
165 |
0.50 |
Binding ≤ 1μM
|
|
HDAC3_HUMAN |
O15379
|
Histone Deacetylase 3, Human |
10 |
0.59 |
Binding ≤ 1μM
|
|
HDAC3_RAT |
Q6P6W3
|
Histone Deacetylase 3, Rat |
165 |
0.50 |
Binding ≤ 1μM
|
|
HDAC4_HUMAN |
P56524
|
Histone Deacetylase 4, Human |
10 |
0.59 |
Binding ≤ 1μM
|
|
HDAC4_RAT |
Q99P99
|
Histone Deacetylase 4, Rat |
165 |
0.50 |
Binding ≤ 1μM
|
|
HDAC5_HUMAN |
Q9UQL6
|
Histone Deacetylase 5, Human |
10 |
0.59 |
Binding ≤ 1μM
|
|
Q5RJZ2_RAT |
Q5RJZ2
|
Histone Deacetylase 5, Rat |
165 |
0.50 |
Binding ≤ 1μM
|
|
HDAC6_HUMAN |
Q9UBN7
|
Histone Deacetylase 6, Human |
1 |
0.66 |
Binding ≤ 1μM
|
|
Q99P97_RAT |
Q99P97
|
Histone Deacetylase 6, Rat |
165 |
0.50 |
Binding ≤ 1μM
|
|
HDAC7_HUMAN |
Q8WUI4
|
Histone Deacetylase 7, Human |
10 |
0.59 |
Binding ≤ 1μM
|
|
HDAC7_RAT |
Q99P96
|
Histone Deacetylase 7, Rat |
165 |
0.50 |
Binding ≤ 1μM
|
|
HDAC8_HUMAN |
Q9BY41
|
Histone Deacetylase 8, Human |
10 |
0.59 |
Binding ≤ 1μM
|
|
HDAC9_HUMAN |
Q9UKV0
|
Histone Deacetylase 9, Human |
10 |
0.59 |
Binding ≤ 1μM
|
|
Q9ZTP8_MAIZE |
Q9ZTP8
|
Histone Deacetylase HD1B, Maize |
28 |
0.56 |
Binding ≤ 1μM
|
|
Q94F81_MAIZE |
Q94F81
|
Histone Deacetylase HD2, Maize |
1000 |
0.44 |
Binding ≤ 1μM
|
|
HDAH_ALCSD |
Q70I53
|
Histone Deacetylase-like Amidohydrolase, Alcsd |
1000 |
0.44 |
Binding ≤ 1μM
|
|
NCOR2_HUMAN |
Q9Y618
|
Nuclear Receptor Corepressor 2, Human |
18.8 |
0.57 |
Binding ≤ 1μM
|
|
Q9XYC7_PLAFA |
Q9XYC7
|
Histone Deacetylase, Plafa |
130 |
0.51 |
Binding ≤ 10μM
|
|
Q7K6A1_PLAF7 |
Q7K6A1
|
Histone Deacetylase, Plaf7 |
100 |
0.52 |
Binding ≤ 10μM
|
|
HDAC1_RAT |
Q4QQW4
|
Histone Deacetylase 1, Rat |
165 |
0.50 |
Binding ≤ 10μM
|
|
HDAC1_HUMAN |
Q13547
|
Histone Deacetylase 1, Human |
1.3 |
0.65 |
Binding ≤ 10μM
|
|
HDAC1_MOUSE |
O09106
|
Histone Deacetylase 1, Mouse |
112 |
0.51 |
Binding ≤ 10μM
|
|
HDA10_HUMAN |
Q969S8
|
Histone Deacetylase 10, Human |
10 |
0.59 |
Binding ≤ 10μM
|
|
HDA11_HUMAN |
Q96DB2
|
Histone Deacetylase 11, Human |
10 |
0.59 |
Binding ≤ 10μM
|
|
HDAC2_HUMAN |
Q92769
|
Histone Deacetylase 2, Human |
1.6 |
0.65 |
Binding ≤ 10μM
|
|
B1WBY8_RAT |
B1WBY8
|
Histone Deacetylase 2, Rat |
165 |
0.50 |
Binding ≤ 10μM
|
|
HDAC3_RAT |
Q6P6W3
|
Histone Deacetylase 3, Rat |
165 |
0.50 |
Binding ≤ 10μM
|
|
HDAC3_HUMAN |
O15379
|
Histone Deacetylase 3, Human |
10 |
0.59 |
Binding ≤ 10μM
|
|
HDAC4_RAT |
Q99P99
|
Histone Deacetylase 4, Rat |
165 |
0.50 |
Binding ≤ 10μM
|
|
HDAC4_HUMAN |
P56524
|
Histone Deacetylase 4, Human |
10 |
0.59 |
Binding ≤ 10μM
|
|
Q5RJZ2_RAT |
Q5RJZ2
|
Histone Deacetylase 5, Rat |
165 |
0.50 |
Binding ≤ 10μM
|
|
HDAC5_HUMAN |
Q9UQL6
|
Histone Deacetylase 5, Human |
10 |
0.59 |
Binding ≤ 10μM
|
|
Q99P97_RAT |
Q99P97
|
Histone Deacetylase 6, Rat |
165 |
0.50 |
Binding ≤ 10μM
|
|
HDAC6_HUMAN |
Q9UBN7
|
Histone Deacetylase 6, Human |
1 |
0.66 |
Binding ≤ 10μM
|
|
HDAC7_RAT |
Q99P96
|
Histone Deacetylase 7, Rat |
165 |
0.50 |
Binding ≤ 10μM
|
|
HDAC7_HUMAN |
Q8WUI4
|
Histone Deacetylase 7, Human |
10 |
0.59 |
Binding ≤ 10μM
|
|
HDAC8_HUMAN |
Q9BY41
|
Histone Deacetylase 8, Human |
10 |
0.59 |
Binding ≤ 10μM
|
|
HDAC9_HUMAN |
Q9UKV0
|
Histone Deacetylase 9, Human |
10 |
0.59 |
Binding ≤ 10μM
|
|
Q9ZTP8_MAIZE |
Q9ZTP8
|
Histone Deacetylase HD1B, Maize |
28 |
0.56 |
Binding ≤ 10μM
|
|
Q94F81_MAIZE |
Q94F81
|
Histone Deacetylase HD2, Maize |
1000 |
0.44 |
Binding ≤ 10μM
|
|
HDAH_ALCSD |
Q70I53
|
Histone Deacetylase-like Amidohydrolase, Alcsd |
1000 |
0.44 |
Binding ≤ 10μM
|
|
NCOR2_HUMAN |
Q9Y618
|
Nuclear Receptor Corepressor 2, Human |
18.8 |
0.57 |
Binding ≤ 10μM
|
|
Z81034 |
Z81034
|
A2780 (Ovarian Carcinoma Cells) |
1620 |
0.43 |
Functional ≤ 10μM
|
|
Z103205 |
Z103205
|
A431 |
4200 |
0.40 |
Functional ≤ 10μM
|
|
Z80682 |
Z80682
|
A549 (Lung Carcinoma Cells) |
1800 |
0.42 |
Functional ≤ 10μM
|
|
Z80054 |
Z80054
|
Caco-2 (Colon Adenocarcinoma Cells) |
8100 |
0.38 |
Functional ≤ 10μM
|
|
Z80064 |
Z80064
|
CCRF-CEM (T-cell Leukemia) |
800 |
0.45 |
Functional ≤ 10μM
|
|
Z80874 |
Z80874
|
CEM (T-cell Leukemia) |
1900 |
0.42 |
Functional ≤ 10μM
|
|
Z80125 |
Z80125
|
DU-145 (Prostate Carcinoma) |
1600 |
0.43 |
Functional ≤ 10μM
|
|
Z80838 |
Z80838
|
EOL1 (Eosinophilic Cells) |
1000 |
0.44 |
Functional ≤ 10μM
|
|
Z80857 |
Z80857
|
Friend Leukemia Cell Line |
990 |
0.44 |
Functional ≤ 10μM
|
|
Z80928 |
Z80928
|
HCT-116 (Colon Carcinoma Cells) |
1000 |
0.44 |
Functional ≤ 10μM
|
|
Z81335 |
Z81335
|
HCT-15 (Colon Adenocarcinoma Cells) |
3900 |
0.40 |
Functional ≤ 10μM
|
|
Z81247 |
Z81247
|
HeLa (Cervical Adenocarcinoma Cells) |
1500 |
0.43 |
Functional ≤ 10μM
|
|
Z81020 |
Z81020
|
HepG2 (Hepatoblastoma Cells) |
0.6 |
0.68 |
Functional ≤ 10μM
|
|
HDAC1_HUMAN |
Q13547
|
Histone Deacetylase 1, Human |
125 |
0.51 |
Functional ≤ 10μM
|
|
HDA10_HUMAN |
Q969S8
|
Histone Deacetylase 10, Human |
7200 |
0.38 |
Functional ≤ 10μM
|
|
HDA11_HUMAN |
Q96DB2
|
Histone Deacetylase 11, Human |
7200 |
0.38 |
Functional ≤ 10μM
|
|
HDAC2_HUMAN |
Q92769
|
Histone Deacetylase 2, Human |
28 |
0.56 |
Functional ≤ 10μM
|
|
HDAC3_HUMAN |
O15379
|
Histone Deacetylase 3, Human |
28 |
0.56 |
Functional ≤ 10μM
|
|
HDAC4_HUMAN |
P56524
|
Histone Deacetylase 4, Human |
178 |
0.50 |
Functional ≤ 10μM
|
|
HDAC5_HUMAN |
Q9UQL6
|
Histone Deacetylase 5, Human |
178 |
0.50 |
Functional ≤ 10μM
|
|
HDAC6_HUMAN |
Q9UBN7
|
Histone Deacetylase 6, Human |
7200 |
0.38 |
Functional ≤ 10μM
|
|
HDAC7_HUMAN |
Q8WUI4
|
Histone Deacetylase 7, Human |
178 |
0.50 |
Functional ≤ 10μM
|
|
HDAC8_HUMAN |
Q9BY41
|
Histone Deacetylase 8, Human |
28 |
0.56 |
Functional ≤ 10μM
|
|
HDAC9_HUMAN |
Q9UKV0
|
Histone Deacetylase 9, Human |
178 |
0.50 |
Functional ≤ 10μM
|
|
Q94F81_MAIZE |
Q94F81
|
Histone Deacetylase HD2, Maize |
50 |
0.54 |
Functional ≤ 10μM
|
|
Z80156 |
Z80156
|
HL-60 (Promyeloblast Leukemia Cells) |
1200 |
0.44 |
Functional ≤ 10μM
|
|
Z80164 |
Z80164
|
HT-1080 (Fibrosarcoma Cells) |
2.4 |
0.64 |
Functional ≤ 10μM
|
|
Z80166 |
Z80166
|
HT-29 (Colon Adenocarcinoma Cells) |
2000 |
0.42 |
Functional ≤ 10μM
|
|
Z81072 |
Z81072
|
Jurkat (Acute Leukemic T-cells) |
2300 |
0.42 |
Functional ≤ 10μM
|
|
Z80186 |
Z80186
|
K562 (Erythroleukemia Cells) |
2200 |
0.42 |
Functional ≤ 10μM
|
|
Z81170 |
Z81170
|
LNCaP (Prostate Carcinoma) |
1000 |
0.44 |
Functional ≤ 10μM
|
|
Z81184 |
Z81184
|
LOX IMVI (Melanoma Cells) |
1300 |
0.43 |
Functional ≤ 10μM
|
|
Z80224 |
Z80224
|
MCF7 (Breast Carcinoma Cells) |
1150 |
0.44 |
Functional ≤ 10μM |
|
Z81252 |
Z81252
|
MDA-MB-231 (Breast Adenocarcinoma Cells) |
1180 |
0.44 |
Functional ≤ 10μM |
|
Z81245 |
Z81245
|
MDA-MB-435 (Breast Carcinoma Cells) |
1900 |
0.42 |
Functional ≤ 10μM
|
|
Z80244 |
Z80244
|
MDA-MB-468 (Breast Adenocarcinoma) |
1300 |
0.43 |
Functional ≤ 10μM
|
|
Z80877 |
Z80877
|
NCI-H1299 (Non-small Cell Lung Carcinoma) |
550 |
0.46 |
Functional ≤ 10μM
|
|
Z103348 |
Z103348
|
NCI-H2122 |
7500 |
0.38 |
Functional ≤ 10μM
|
|
Z81280 |
Z81280
|
NCI-H226 (Non-small Cell Lung Carcinoma Cells) |
2600 |
0.41 |
Functional ≤ 10μM
|
|
Z81281 |
Z81281
|
NCI-H23 (Non-small Cell Lung Carcinoma Cells) |
383 |
0.47 |
Functional ≤ 10μM
|
|
Z80322 |
Z80322
|
NCI-H358 (Lung Carcinama Cells) |
2500 |
0.41 |
Functional ≤ 10μM
|
|
Z81024 |
Z81024
|
NCI-H460 (Non-small Cell Lung Carcinoma) |
3448 |
0.40 |
Functional ≤ 10μM
|
|
Z81283 |
Z81283
|
NCI-H522 (Non-small Cell Lung Carcinoma Cells) |
832 |
0.45 |
Functional ≤ 10μM
|
|
Z80896 |
Z80896
|
NCI-H69 (Small Cell Lung Carcinoma Cells) |
2060 |
0.42 |
Functional ≤ 10μM
|
|
Z80390 |
Z80390
|
PC-3 (Prostate Carcinoma Cells) |
1210 |
0.44 |
Functional ≤ 10μM
|
|
Z50425 |
Z50425
|
Plasmodium Falciparum |
109.7 |
0.51 |
Functional ≤ 10μM
|
|
Z50136 |
Z50136
|
Plasmodium Falciparum (isolate FcB1 / Columbia) |
820 |
0.45 |
Functional ≤ 10μM
|
|
Z102015 |
Z102015
|
Plasmodium Vivax |
147 |
0.50 |
Functional ≤ 10μM
|
|
Z80418 |
Z80418
|
RAW264.7 (Monocytic-macrophage Leukemia Cells) |
1880 |
0.42 |
Functional ≤ 10μM
|
|
Z80475 |
Z80475
|
SK-BR-3 (Breast Adenocarcinoma) |
1190 |
0.44 |
Functional ≤ 10μM
|
|
Z80493 |
Z80493
|
SK-OV-3 (Ovarian Carcinoma Cells) |
2200 |
0.42 |
Functional ≤ 10μM
|
|
Z80513 |
Z80513
|
SQ20B |
3000 |
0.41 |
Functional ≤ 10μM
|
|
Z80514 |
Z80514
|
St-4 (Stomach Carcinoma Cells) |
5200 |
0.39 |
Functional ≤ 10μM
|
|
Z81331 |
Z81331
|
SW-620 (Colon Adenocarcinoma Cells) |
600 |
0.46 |
Functional ≤ 10μM
|
|
Z80957 |
Z80957
|
HMEC (Microvascular Endothelial Cells) |
1300 |
0.43 |
ADME/T ≤ 10μM
|
Physical Representations
|
Type
pH range
|
xlogP
|
Des A‑Pol
Apolar desolvation
(kcal/mol)
|
Des Pol
Polar desolvation
(kcal/mol)
|
H Don
H-bond donors
|
H Acc
H-bond acceptors
|
Chg
Net charge
|
tPSA
(Ų)
|
MWT
Molecular weight
(g/mol)
|
RB
Rotatable bonds
|
DL |
|
Ref
Reference (pH 7)
|
2.47 |
4.41 |
-18.87 |
3 |
5 |
0 |
78 |
264.325 |
8 |
↓
|
|
|
|
|
|
|
Analogs
-
11616162
-
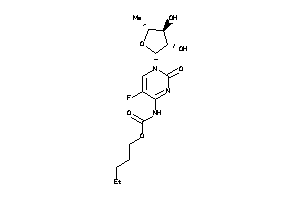
Draw
Identity
99%
90%
80%
70%
Physical Representations
|
Type
pH range
|
xlogP
|
Des A‑Pol
Apolar desolvation
(kcal/mol)
|
Des Pol
Polar desolvation
(kcal/mol)
|
H Don
H-bond donors
|
H Acc
H-bond acceptors
|
Chg
Net charge
|
tPSA
(Ų)
|
MWT
Molecular weight
(g/mol)
|
RB
Rotatable bonds
|
DL |
|
Ref
Reference (pH 7)
|
1.88 |
-6.22 |
-19.62 |
3 |
9 |
0 |
122 |
359.354 |
7 |
↓
|
|
|
|
Analogs
Draw
Identity
99%
90%
80%
70%
Clustered Target Annotations
| Code |
Organism Class |
Affinity (nM) |
LE (kcal/mol/atom) |
Type |
|
ABCG2-1-E |
ATP-binding Cassette Sub-family G Member 2 (cluster #1 Of 2), Eukaryotic |
Eukaryotes |
1260 |
0.27 |
Binding ≤ 10μM
|
|
ABL1-1-E |
Tyrosine-protein Kinase ABL (cluster #1 Of 1), Eukaryotic |
Eukaryotes |
1200 |
0.27 |
Binding ≤ 10μM
|
|
BLK-1-E |
Tyrosine-protein Kinase BLK (cluster #1 Of 1), Eukaryotic |
Eukaryotes |
1200 |
0.27 |
Binding ≤ 10μM
|
|
CTRO-1-E |
Citron Rho-interacting Kinase (cluster #1 Of 1), Eukaryotic |
Eukaryotes |
1300 |
0.27 |
Binding ≤ 10μM
|
|
DAPK3-1-E |
Death-associated Protein Kinase 3 (cluster #1 Of 2), Eukaryotic |
Eukaryotes |
5700 |
0.24 |
Binding ≤ 10μM
|
|
DMPK-1-E |
Myotonin-protein Kinase (cluster #1 Of 1), Eukaryotic |
Eukaryotes |
6900 |
0.23 |
Binding ≤ 10μM
|
|
EGFR-3-E |
Epidermal Growth Factor Receptor ErbB1 (cluster #3 Of 4), Eukaryotic |
Eukaryotes |
70 |
0.32 |
Binding ≤ 10μM
|
|
EPHA1-1-E |
Ephrin Type-A Receptor 1 (cluster #1 Of 1), Eukaryotic |
Eukaryotes |
4000 |
0.24 |
Binding ≤ 10μM
|
|
EPHA6-1-E |
Ephrin Type-A Receptor 6 (cluster #1 Of 1), Eukaryotic |
Eukaryotes |
590 |
0.28 |
Binding ≤ 10μM
|
|
EPHA8-1-E |
Ephrin Type-A Receptor 8 (cluster #1 Of 1), Eukaryotic |
Eukaryotes |
1800 |
0.26 |
Binding ≤ 10μM
|
|
EPHB1-1-E |
Ephrin Type-B Receptor 1 (cluster #1 Of 1), Eukaryotic |
Eukaryotes |
7300 |
0.23 |
Binding ≤ 10μM
|
|
EPHB4-1-E |
Ephrin Type-B Receptor 4 (cluster #1 Of 1), Eukaryotic |
Eukaryotes |
1000 |
0.27 |
Binding ≤ 10μM
|
|
ERBB2-2-E |
Receptor Protein-tyrosine Kinase ErbB-2 (cluster #2 Of 3), Eukaryotic |
Eukaryotes |
3500 |
0.25 |
Binding ≤ 10μM
|
|
FLT3-1-E |
Tyrosine-protein Kinase Receptor FLT3 (cluster #1 Of 1), Eukaryotic |
Eukaryotes |
3000 |
0.25 |
Binding ≤ 10μM
|
|
FRK-1-E |
Tyrosine-protein Kinase FRK (cluster #1 Of 1), Eukaryotic |
Eukaryotes |
2000 |
0.26 |
Binding ≤ 10μM
|
|
GAK-1-E |
Serine/threonine-protein Kinase GAK (cluster #1 Of 2), Eukaryotic |
Eukaryotes |
7 |
0.37 |
Binding ≤ 10μM
|
|
HCK-1-E |
Tyrosine-protein Kinase HCK (cluster #1 Of 1), Eukaryotic |
Eukaryotes |
4400 |
0.24 |
Binding ≤ 10μM
|
|
IRAK3-1-E |
Interleukin-1 Receptor-associated Kinase 3 (cluster #1 Of 1), Eukaryotic |
Eukaryotes |
1500 |
0.26 |
Binding ≤ 10μM
|
|
KC1E-1-E |
Casein Kinase I Epsilon (cluster #1 Of 2), Eukaryotic |
Eukaryotes |
430 |
0.29 |
Binding ≤ 10μM
|
|
KIT-1-E |
Stem Cell Growth Factor Receptor (cluster #1 Of 1), Eukaryotic |
Eukaryotes |
4300 |
0.24 |
Binding ≤ 10μM
|
|
LCK-1-E |
Tyrosine-protein Kinase LCK (cluster #1 Of 4), Eukaryotic |
Eukaryotes |
630 |
0.28 |
Binding ≤ 10μM
|
|
LYN-1-E |
Tyrosine-protein Kinase Lyn (cluster #1 Of 1), Eukaryotic |
Eukaryotes |
990 |
0.27 |
Binding ≤ 10μM
|
|
MK04-1-E |
Mitogen-activated Protein Kinase 4 (cluster #1 Of 1), Eukaryotic |
Eukaryotes |
3100 |
0.25 |
Binding ≤ 10μM
|
|
MK06-1-E |
Mitogen-activated Protein Kinase 6 (cluster #1 Of 1), Eukaryotic |
Eukaryotes |
1600 |
0.26 |
Binding ≤ 10μM
|
|
MK09-1-E |
C-Jun N-terminal Kinase 2 (cluster #1 Of 3), Eukaryotic |
Eukaryotes |
1400 |
0.26 |
Binding ≤ 10μM
|
|
MK10-1-E |
C-Jun N-terminal Kinase 3 (cluster #1 Of 2), Eukaryotic |
Eukaryotes |
3200 |
0.25 |
Binding ≤ 10μM
|
|
MKNK1-1-E |
MAP Kinase-interacting Serine/threonine-protein Kinase MNK1 (cluster #1 Of 1), Eukaryotic |
Eukaryotes |
290 |
0.30 |
Binding ≤ 10μM
|
|
MKNK2-1-E |
MAP Kinase Signal-integrating Kinase 2 (cluster #1 Of 2), Eukaryotic |
Eukaryotes |
360 |
0.29 |
Binding ≤ 10μM
|
|
MYLK2-1-E |
Myosin Light Chain Kinase 2 (cluster #1 Of 1), Eukaryotic |
Eukaryotes |
1900 |
0.26 |
Binding ≤ 10μM
|
|
PHKG1-1-E |
Phosphorylase Kinase Gamma Subunit 1 (cluster #1 Of 2), Eukaryotic |
Eukaryotes |
3700 |
0.25 |
Binding ≤ 10μM
|
|
PHKG2-1-E |
Phosphorylase Kinase Gamma Subunit 2 (cluster #1 Of 2), Eukaryotic |
Eukaryotes |
6400 |
0.23 |
Binding ≤ 10μM
|
|
PIM3-1-E |
Serine/threonine-protein Kinase PIM3 (cluster #1 Of 1), Eukaryotic |
Eukaryotes |
5800 |
0.24 |
Binding ≤ 10μM
|
|
RET-1-E |
Tyrosine-protein Kinase Receptor RET (cluster #1 Of 1), Eukaryotic |
Eukaryotes |
1700 |
0.26 |
Binding ≤ 10μM
|
|
RIPK2-1-E |
Serine/threonine-protein Kinase RIPK2 (cluster #1 Of 1), Eukaryotic |
Eukaryotes |
800 |
0.28 |
Binding ≤ 10μM
|
|
SIK2-1-E |
Serine/threonine-protein Kinase SIK2 (cluster #1 Of 1), Eukaryotic |
Eukaryotes |
2100 |
0.26 |
Binding ≤ 10μM
|
|
SLK-1-E |
Serine/threonine-protein Kinase 2 (cluster #1 Of 2), Eukaryotic |
Eukaryotes |
920 |
0.27 |
Binding ≤ 10μM
|
|
SRC-1-E |
Tyrosine-protein Kinase SRC (cluster #1 Of 3), Eukaryotic |
Eukaryotes |
5000 |
0.24 |
Binding ≤ 10μM
|
|
ST17A-1-E |
Serine/threonine-protein Kinase 17A (cluster #1 Of 2), Eukaryotic |
Eukaryotes |
2900 |
0.25 |
Binding ≤ 10μM
|
|
ST17B-1-E |
Serine/threonine-protein Kinase 17B (cluster #1 Of 1), Eukaryotic |
Eukaryotes |
6500 |
0.23 |
Binding ≤ 10μM
|
|
STK10-1-E |
Serine/threonine-protein Kinase 10 (cluster #1 Of 1), Eukaryotic |
Eukaryotes |
870 |
0.27 |
Binding ≤ 10μM
|
|
TBA1A-2-E |
Tubulin Alpha-3 Chain (cluster #2 Of 3), Eukaryotic |
Eukaryotes |
410 |
0.29 |
Binding ≤ 10μM
|
|
TXK-1-E |
Tyrosine-protein Kinase TXK (cluster #1 Of 1), Eukaryotic |
Eukaryotes |
6000 |
0.24 |
Binding ≤ 10μM
|
|
ULK3-1-E |
Serine/threonine-protein Kinase ULK3 (cluster #1 Of 2), Eukaryotic |
Eukaryotes |
1400 |
0.26 |
Binding ≤ 10μM
|
|
VGFR2-1-E |
Vascular Endothelial Growth Factor Receptor 2 (cluster #1 Of 2), Eukaryotic |
Eukaryotes |
1900 |
0.26 |
Binding ≤ 10μM
|
|
EGFR-1-E |
Epidermal Growth Factor Receptor ErbB1 (cluster #1 Of 2), Eukaryotic |
Eukaryotes |
80 |
0.32 |
Functional ≤ 10μM
|
|
ERBB2-2-E |
Receptor Protein-tyrosine Kinase ErbB-2 (cluster #2 Of 3), Eukaryotic |
Eukaryotes |
599 |
0.28 |
Functional ≤ 10μM
|
|
Z80166-1-O |
HT-29 (Colon Adenocarcinoma Cells) (cluster #1 Of 12), Other |
Other |
9800 |
0.23 |
Functional ≤ 10μM
|
|
Z80186-9-O |
K562 (Erythroleukemia Cells) (cluster #9 Of 11), Other |
Other |
9360 |
0.23 |
Functional ≤ 10μM
|
|
Z80188-1-O |
KB 3-1 (Cervical Epithelial Carcinoma Cells) (cluster #1 Of 2), Other |
Other |
80 |
0.32 |
Functional ≤ 10μM
|
|
Z80224-1-O |
MCF7 (Breast Carcinoma Cells) (cluster #1 Of 14), Other |
Other |
1000 |
0.27 |
Functional ≤ 10μM
|
|
Z80262-1-O |
NCI-H1975 (Bronchoalveolar Carcinoma Cells) (cluster #1 Of 1), Other |
Other |
8260 |
0.23 |
Functional ≤ 10μM
|
|
Z80390-1-O |
PC-3 (Prostate Carcinoma Cells) (cluster #1 Of 10), Other |
Other |
7400 |
0.23 |
Functional ≤ 10μM
|
|
Z80682-1-O |
A549 (Lung Carcinoma Cells) (cluster #1 Of 11), Other |
Other |
7000 |
0.23 |
Functional ≤ 10μM
|
|
Z80961-1-O |
HN5 (Squamous Cell Carcinoma) (cluster #1 Of 1), Other |
Other |
10 |
0.36 |
Functional ≤ 10μM
|
|
Z81115-2-O |
KB (Squamous Cell Carcinoma) (cluster #2 Of 6), Other |
Other |
80 |
0.32 |
Functional ≤ 10μM
|
ChEMBL Target Annotations
| Uniprot |
Swissprot |
Affinity (nM) |
LE (kcal/mol/atom) |
Type |
|
KC1E_HUMAN |
P49674
|
Casein Kinase I Epsilon, Human |
430 |
0.29 |
Binding ≤ 1μM
|
|
EPHA6_HUMAN |
Q9UF33
|
Ephrin Type-A Receptor 6, Human |
590 |
0.28 |
Binding ≤ 1μM
|
|
EPHB4_HUMAN |
P54760
|
Ephrin Type-B Receptor 4, Human |
1000 |
0.27 |
Binding ≤ 1μM
|
|
EGFR_HUMAN |
P00533
|
Epidermal Growth Factor Receptor ErbB1, Human |
0.4 |
0.42 |
Binding ≤ 1μM
|
|
MKNK2_HUMAN |
Q9HBH9
|
MAP Kinase Signal-integrating Kinase 2, Human |
360 |
0.29 |
Binding ≤ 1μM
|
|
MKNK1_HUMAN |
Q9BUB5
|
MAP Kinase-interacting Serine/threonine-protein Kinase MNK1, Human |
290 |
0.30 |
Binding ≤ 1μM
|
|
ERBB2_HUMAN |
P04626
|
Receptor Protein-tyrosine Kinase ErbB-2, Human |
240 |
0.30 |
Binding ≤ 1μM
|
|
STK10_HUMAN |
O94804
|
Serine/threonine-protein Kinase 10, Human |
470 |
0.29 |
Binding ≤ 1μM
|
|
SLK_HUMAN |
Q9H2G2
|
Serine/threonine-protein Kinase 2, Human |
920 |
0.27 |
Binding ≤ 1μM
|
|
GAK_HUMAN |
O14976
|
Serine/threonine-protein Kinase GAK, Human |
13 |
0.36 |
Binding ≤ 1μM
|
|
RIPK2_HUMAN |
O43353
|
Serine/threonine-protein Kinase RIPK2, Human |
530 |
0.28 |
Binding ≤ 1μM
|
|
TBA1A_RAT |
P68370
|
Tubulin Alpha-1 Chain, Rat |
410 |
0.29 |
Binding ≤ 1μM
|
|
HCK_HUMAN |
P08631
|
Tyrosine-protein Kinase HCK, Human |
110 |
0.31 |
Binding ≤ 1μM
|
|
LCK_HUMAN |
P06239
|
Tyrosine-protein Kinase LCK, Human |
630 |
0.28 |
Binding ≤ 1μM
|
|
LYN_HUMAN |
P07948
|
Tyrosine-protein Kinase Lyn, Human |
990 |
0.27 |
Binding ≤ 1μM
|
|
FLT3_HUMAN |
P36888
|
Tyrosine-protein Kinase Receptor FLT3, Human |
1000 |
0.27 |
Binding ≤ 1μM
|
|
ABCG2_HUMAN |
Q9UNQ0
|
ATP-binding Cassette Sub-family G Member 2, Human |
1100 |
0.27 |
Binding ≤ 10μM
|
|
MK09_HUMAN |
P45984
|
C-Jun N-terminal Kinase 2, Human |
1400 |
0.26 |
Binding ≤ 10μM
|
|
MK10_HUMAN |
P53779
|
C-Jun N-terminal Kinase 3, Human |
2300 |
0.25 |
Binding ≤ 10μM
|
|
KC1E_HUMAN |
P49674
|
Casein Kinase I Epsilon, Human |
2000 |
0.26 |
Binding ≤ 10μM
|
|
CTRO_HUMAN |
O14578
|
Citron Rho-interacting Kinase, Human |
1300 |
0.27 |
Binding ≤ 10μM
|
|
DAPK3_HUMAN |
O43293
|
Death-associated Protein Kinase 3, Human |
5700 |
0.24 |
Binding ≤ 10μM
|
|
EPHA1_HUMAN |
P21709
|
Ephrin Type-A Receptor 1, Human |
4000 |
0.24 |
Binding ≤ 10μM
|
|
EPHA6_HUMAN |
Q9UF33
|
Ephrin Type-A Receptor 6, Human |
1400 |
0.26 |
Binding ≤ 10μM
|
|
EPHA8_HUMAN |
P29322
|
Ephrin Type-A Receptor 8, Human |
1800 |
0.26 |
Binding ≤ 10μM
|
|
EPHB1_HUMAN |
P54762
|
Ephrin Type-B Receptor 1, Human |
7300 |
0.23 |
Binding ≤ 10μM
|
|
EPHB4_HUMAN |
P54760
|
Ephrin Type-B Receptor 4, Human |
1000 |
0.27 |
Binding ≤ 10μM
|
|
EGFR_HUMAN |
P00533
|
Epidermal Growth Factor Receptor ErbB1, Human |
0.4 |
0.42 |
Binding ≤ 10μM
|
|
IRAK3_HUMAN |
Q9Y616
|
Interleukin-1 Receptor-associated Kinase 3, Human |
1500 |
0.26 |
Binding ≤ 10μM
|
|
MKNK2_HUMAN |
Q9HBH9
|
MAP Kinase Signal-integrating Kinase 2, Human |
1200 |
0.27 |
Binding ≤ 10μM
|
|
MKNK1_HUMAN |
Q9BUB5
|
MAP Kinase-interacting Serine/threonine-protein Kinase MNK1, Human |
290 |
0.30 |
Binding ≤ 10μM
|
|
MK04_HUMAN |
P31152
|
Mitogen-activated Protein Kinase 4, Human |
3100 |
0.25 |
Binding ≤ 10μM
|
|
MK06_HUMAN |
Q16659
|
Mitogen-activated Protein Kinase 6, Human |
1600 |
0.26 |
Binding ≤ 10μM
|
|
MYLK2_HUMAN |
Q9H1R3
|
Myosin Light Chain Kinase 2, Human |
1900 |
0.26 |
Binding ≤ 10μM
|
|
DMPK_HUMAN |
Q09013
|
Myotonin-protein Kinase, Human |
6900 |
0.23 |
Binding ≤ 10μM
|
|
PHKG1_HUMAN |
Q16816
|
Phosphorylase Kinase Gamma Subunit 1, Human |
3700 |
0.25 |
Binding ≤ 10μM
|
|
PHKG2_HUMAN |
P15735
|
Phosphorylase Kinase Gamma Subunit 2, Human |
6400 |
0.23 |
Binding ≤ 10μM
|
|
ERBB2_HUMAN |
P04626
|
Receptor Protein-tyrosine Kinase ErbB-2, Human |
1100 |
0.27 |
Binding ≤ 10μM
|
|
STK10_HUMAN |
O94804
|
Serine/threonine-protein Kinase 10, Human |
470 |
0.29 |
Binding ≤ 10μM
|
|
ST17A_HUMAN |
Q9UEE5
|
Serine/threonine-protein Kinase 17A, Human |
2000 |
0.26 |
Binding ≤ 10μM
|
|
ST17B_HUMAN |
O94768
|
Serine/threonine-protein Kinase 17B, Human |
3800 |
0.24 |
Binding ≤ 10μM
|
|
SLK_HUMAN |
Q9H2G2
|
Serine/threonine-protein Kinase 2, Human |
1100 |
0.27 |
Binding ≤ 10μM
|
|
GAK_HUMAN |
O14976
|
Serine/threonine-protein Kinase GAK, Human |
13 |
0.36 |
Binding ≤ 10μM
|
|
PIM3_HUMAN |
Q86V86
|
Serine/threonine-protein Kinase PIM3, Human |
5800 |
0.24 |
Binding ≤ 10μM
|
|
RIPK2_HUMAN |
O43353
|
Serine/threonine-protein Kinase RIPK2, Human |
530 |
0.28 |
Binding ≤ 10μM
|
|
SIK2_HUMAN |
Q9H0K1
|
Serine/threonine-protein Kinase SIK2, Human |
2100 |
0.26 |
Binding ≤ 10μM
|
|
KIT_HUMAN |
P10721
|
Stem Cell Growth Factor Receptor, Human |
4300 |
0.24 |
Binding ≤ 10μM
|
|
TBA1A_RAT |
P68370
|
Tubulin Alpha-1 Chain, Rat |
410 |
0.29 |
Binding ≤ 10μM
|
|
ABL1_HUMAN |
P00519
|
Tyrosine-protein Kinase ABL, Human |
1200 |
0.27 |
Binding ≤ 10μM
|
|
BLK_HUMAN |
P51451
|
Tyrosine-protein Kinase BLK, Human |
1200 |
0.27 |
Binding ≤ 10μM
|
|
FRK_HUMAN |
P42685
|
Tyrosine-protein Kinase FRK, Human |
2000 |
0.26 |
Binding ≤ 10μM
|
|
HCK_HUMAN |
P08631
|
Tyrosine-protein Kinase HCK, Human |
110 |
0.31 |
Binding ≤ 10μM
|
|
LCK_HUMAN |
P06239
|
Tyrosine-protein Kinase LCK, Human |
1100 |
0.27 |
Binding ≤ 10μM
|
|
LYN_HUMAN |
P07948
|
Tyrosine-protein Kinase Lyn, Human |
990 |
0.27 |
Binding ≤ 10μM
|
|
FLT3_HUMAN |
P36888
|
Tyrosine-protein Kinase Receptor FLT3, Human |
1000 |
0.27 |
Binding ≤ 10μM
|
|
RET_HUMAN |
P07949
|
Tyrosine-protein Kinase Receptor RET, Human |
1700 |
0.26 |
Binding ≤ 10μM
|
|
SRC_HUMAN |
P12931
|
Tyrosine-protein Kinase SRC, Human |
1100 |
0.27 |
Binding ≤ 10μM
|
|
TXK_HUMAN |
P42681
|
Tyrosine-protein Kinase TXK, Human |
6000 |
0.24 |
Binding ≤ 10μM
|
|
ULK3_MOUSE |
Q3U3Q1
|
ULK3 Kinase, Mouse |
1400 |
0.26 |
Binding ≤ 10μM
|
|
VGFR2_HUMAN |
P35968
|
Vascular Endothelial Growth Factor Receptor 2, Human |
1900 |
0.26 |
Binding ≤ 10μM
|
|
Z80682 |
Z80682
|
A549 (Lung Carcinoma Cells) |
7000 |
0.23 |
Functional ≤ 10μM
|
|
EGFR_HUMAN |
P00533
|
Epidermal Growth Factor Receptor ErbB1, Human |
14.4 |
0.35 |
Functional ≤ 10μM
|
|
Z80961 |
Z80961
|
HN5 (Squamous Cell Carcinoma) |
10 |
0.36 |
Functional ≤ 10μM
|
|
Z80166 |
Z80166
|
HT-29 (Colon Adenocarcinoma Cells) |
9800 |
0.23 |
Functional ≤ 10μM
|
|
Z80186 |
Z80186
|
K562 (Erythroleukemia Cells) |
9360 |
0.23 |
Functional ≤ 10μM
|
|
Z81115 |
Z81115
|
KB (Squamous Cell Carcinoma) |
54 |
0.33 |
Functional ≤ 10μM
|
|
Z80188 |
Z80188
|
KB 3-1 (Cervical Epithelial Carcinoma Cells) |
380 |
0.29 |
Functional ≤ 10μM
|
|
Z80224 |
Z80224
|
MCF7 (Breast Carcinoma Cells) |
1000 |
0.27 |
Functional ≤ 10μM
|
|
Z80262 |
Z80262
|
NCI-H1975 (Bronchoalveolar Carcinoma Cells) |
8260 |
0.23 |
Functional ≤ 10μM
|
|
Z80390 |
Z80390
|
PC-3 (Prostate Carcinoma Cells) |
7400 |
0.23 |
Functional ≤ 10μM
|
|
ERBB2_HUMAN |
P04626
|
Receptor Protein-tyrosine Kinase ErbB-2, Human |
1604 |
0.26 |
Functional ≤ 10μM
|
Physical Representations
|
Type
pH range
|
xlogP
|
Des A‑Pol
Apolar desolvation
(kcal/mol)
|
Des Pol
Polar desolvation
(kcal/mol)
|
H Don
H-bond donors
|
H Acc
H-bond acceptors
|
Chg
Net charge
|
tPSA
(Ų)
|
MWT
Molecular weight
(g/mol)
|
RB
Rotatable bonds
|
DL |
|
Ref
Reference (pH 7)
|
4.19 |
8.75 |
-11.24 |
1 |
7 |
0 |
69 |
446.91 |
8 |
↓
|
|
Mid
Mid (pH 6-8)
|
3.93 |
9.92 |
-78.3 |
3 |
7 |
2 |
75 |
448.926 |
7 |
↓
|
|
|
|
Analogs
-
44699428
-
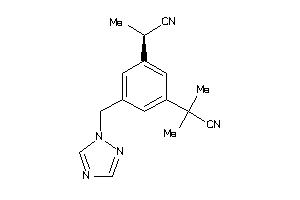
-
44699430
-
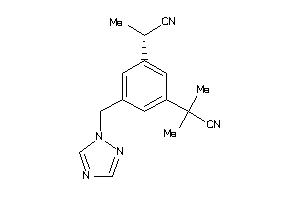
Draw
Identity
99%
90%
80%
70%
Clustered Target Annotations
| Code |
Organism Class |
Affinity (nM) |
LE (kcal/mol/atom) |
Type |
|
CP19A-3-E |
Cytochrome P450 19A1 (cluster #3 Of 3), Eukaryotic |
Eukaryotes |
600 |
0.40 |
Binding ≤ 10μM
|
Physical Representations
|
Type
pH range
|
xlogP
|
Des A‑Pol
Apolar desolvation
(kcal/mol)
|
Des Pol
Polar desolvation
(kcal/mol)
|
H Don
H-bond donors
|
H Acc
H-bond acceptors
|
Chg
Net charge
|
tPSA
(Ų)
|
MWT
Molecular weight
(g/mol)
|
RB
Rotatable bonds
|
DL |
|
Ref
Reference (pH 7)
|
2.85 |
11.46 |
-17.13 |
0 |
5 |
0 |
78 |
293.374 |
4 |
↓
|
|